full article:
Of 180 million people suffering from vision impairment globally, approximately 40-45 million are legally blind1. Some 58% of these people are aged over 60 years, 32% are between 45 and 59 years, 7% between 15 and 44 years, and approximately 4% are under 14 years2. It is estimated that by 2020 there will be 54 million blind people aged over 60 years worldwide. This demonstrates the importance of epidemiological research and the application of effective primary health strategies at international and regional levels3,4.
Geospatial analysis and modern geographical technologies are able to select, store, distribute, and analyze data relating to various diseases or disorders and epidemiological information. When such applications are used in public health, valuable and reliable results can be produced5-8. The applications comprise a range, from simple distributions (dot maps) to spatial analysis and prediction models (interpolation methods, multicriteria analyses, and geostatistical models)9-11.
One aim of this study was to measure the prevalence of ophthalmologic disorders found during visits by the Mobile Ophthalmologic Unit (MOU) of the Vardinogiannion Eye Institute of Crete (VEIC) to villages in Crete, using spatial analysis. The second aim was to estimate increased 'risk' of ophthalmological disease based on demographic and location factors, and thus, use the present findings as a basis to plan future services and optimal clinical coverage.
Setting
The island of Crete is located in southern Greece and divided into four prefectures (Heraklion, Lasithi, Chania, Rethymno) and 20 provinces. According to national census, the population of the island was 601 159 in 2001, and 621 000 in 2011. The majority of Cretan villages in the area have a population of less than 1000 people.
The MOU is a well-equipped unit, staffed with specialized clinicians who carry out all primary ophthalmological examinations autonomously. The purpose of the MOU is to provide primary healthcare services in locations that lack sufficient ophthalmological coverage. The services are mainly located in the capital cities of each prefecture12.
Sample and area of interest
A total of 953 volunteers from 83 villages in rural areas of Crete were examined by the MOU1. The study included 21 villages from the Prefecture of Chania, 23 villages from the Prefecture of Rethymno, 15 villages from the Prefecture of Heraklio, and 24 villages from the Prefecture of Lasithi.
Examination variables collected were demographic characteristics (age, gender, date of birth), diagnosis coded using ICD-10 (including the date of diagnosis, presence of ophthalmological disorder, and new or old diagnosis), and location parameters (province and distance from nearest ophthalmologist).
Preparations before visits and ethics approval
At the researchers' request, local authorities were informed at least one month before the visit about the date, place of examination, and the aims of the examination. The mobile unit of the IVO was used for examinations.
Preparation commenced after approval of the Postgraduate Committee of the Optics and Vision, Postgraduate Program of the Department of Medicine, University of Crete; and approval by the University Hospital Director (protocol number: 16/2003). Special attention was given to confidentiality and anonymity regarding the data collected, following the principles of the Helsinki Declaration of Human Rights.
Examination
All patients were volunteers. The patient's medical history was obtained from a short interview and from their insurance records. Patient examinations included measurement of ocular acuity using a Snellen chart, autorefractometry, slit-lamp biomicroscopy, tonometry, and fundus examination after dilation. A stenopic diaphragm (pinhole) was used to assess the need for additional corrective refraction.
Definitions of most commonly encountered ophthalmic diseases: Cataracts are defined as cloudiness or opacity in the normally transparent crystalline lens of the eye. This cloudiness can cause a decrease in vision and may lead to eventual blindness13. Glaucoma is a group of eye diseases characterized by damage to the optic nerve, usually due to excessively high intraocular pressure (IOP). If untreated, this increased pressurecan lead to optic nerve damage resulting in progressive, permanent loss of vision, commencing with unnoticeable blind spots at the edges of the visual field, progressing to tunnel vision, and then to blindness13. Refractive error refers to defective ability of the eye's lens to accurately focus on an image, as occurs in near- and far-sightedness. This term includes myopia, hyperopia, astigmatism, and presbyopia13.
Statistical and spatial analysis
Pearson's χ2 test for contingency tables and Mantel-Haesnzel test were used to estimate association between the presence of ophthalmological disorder and demographic factors (eg age, sex, and distance from the nearest ophthalmologist). The control group consisted of people who did not have any eye abnormality, and cataract patient participants were required to be aged over 40 years. Based on the control group, a regression model was created to test the effects of independent variables (demographic and location factors) for the risk of the three selected abnormalities. Specifically, multiple logistic regression models were used to examine the influence of each factor. The software SPSS v13.0 (www.spss.com) was used for statistical analyses.
Data were analyzed spatially in Arc View v3.2 and Arc Map v9.0 GIS (www.esri.com). First, a density dot map was created to distribute the present ophthalmological disorders in Crete and identify possible spatial clusters14-16. A probability map was created using kriging interpolation models in order to propose appropriate places for optimal clinical coverage15,16. Kriging is a spatial interpolation technique that uses polynomials in order to 'predict' the values of an unknown function. This refers to the estimation of the number of events (of a variable) even in areas where we have no data. A reference map of Crete and its prefectures is provided (Fig1).
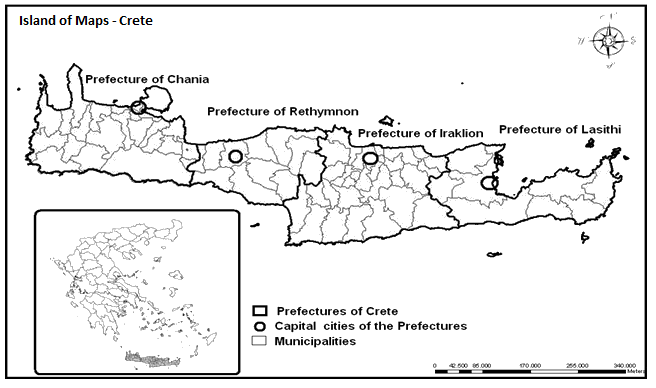
Figure 1: The geographic position of Crete, showing prefectures and municipalities.
The demographic characteristics of the participants are shown (Table 1). Approximately 86.8% of the sample lived in villages with less than 1000 people. Some 42.2% of the participants had physiological findings, and the remainder had at least one diagnosis.
The most frequent diseases were cataracts (236 cases, 24.8%), refractive errors (91 cases, 9.5%), glaucoma (51 cases, 5.4%), macular hole (29 cases, 3.0%), blepharitis (18 cases, 1.9%), and conjunctivitis (17 cases, 1.8%). All other ophthalmologic disorders were found in less than 1.5% of participants. Only four cases of cataracts were first diagnosed when participants were aged less than 40 years.
Among the 378 patients suffering from cataracts, glaucoma, and refractive errors, 142 cases (14.9% of the total sample) were newly diagnosed (Table 2). There were 22 newly diagnosed cases of glaucoma (43.1% of total glaucoma cases).
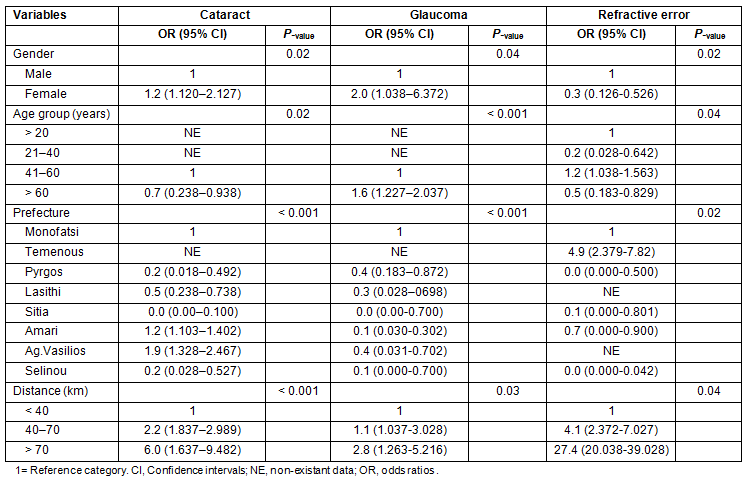
When adjusted odds ratios (OR) were estimated using multiple logistic regression models with the variables distance from the nearest ophthalmologist, age, and gender of the participants, the results included OR for cataracts, glaucoma, and refractive errors compared with the control group (Table 3). In addition, distance greater than 70 km from the nearest ophthalmologist was found to increase the probability of cataract diagnosis (OR = 6.0; 95% CI = 1.637-9.482). Corresponding analysis for refractive errors revealed the same distance dependence (OR = 27.4; 95% CI = 20.038-39.028). Women presented a higher risk than men, both for glaucoma and cataracts. Women had a 1.2 times higher risk for cataracts (95% CI = 1.120-2.127) and 2.0 times for glaucoma (95% CI = 1.038-6.372). However, women had a lower risk for refractive errors (OR = 0.3; 95% CI = 0.126-0.526). Similarly, age affected the risk of the three eye abnormalities, especially glaucoma (age group >60 years). Also, the age distribution of cataract cases showed a higher prevalence in people aged 60 years or more compared with those aged 41-60 years. The most common type of cataract was senile cataract, which is common in persons aged over 60 years. Glaucoma and refractive errors seemed to be affected uniformly by age in the present sample.
Table 1: Participants' descriptive statistics according to
ophthalmological disorders, province in Crete, gender and age
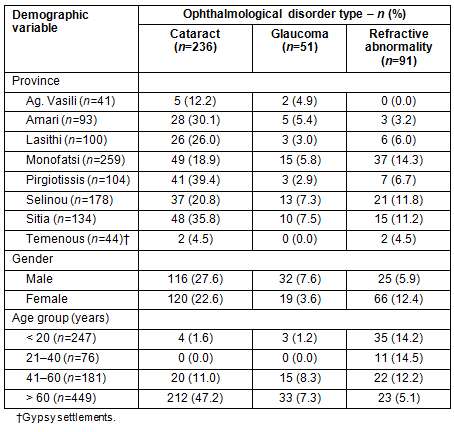
Table 2: Newly diagnosed cases of cataract,
glaucoma, and refractive errors in Crete's provinces
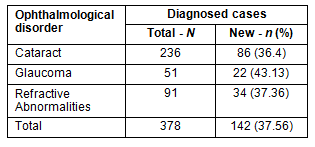
Table 3: Adjusted odds ratios and 95% confidence intervals for cataract, glaucoma, and refractive errors, according to gender, age and province in Crete
A map showing the prefectures and municipalities of the island of Crete and Crete's geographic position is provided (Fig1). A following density map shows the number of sample patients in villages per m2 (Fig2), with density represented by a circle symbol of increasing density as the number of patients increases. High heterogeneity and high density levels existed in villages in southern Asterousia, eastern Rethymnon, and southwestern Chania. However, lower densities were found in southwestern Rethymnon and the Prefecture of Lasithi.
The probability density of ophthalmological disorders is provided (Fig3), ophthalmological disorders defined as the existence of at least one positive diagnosis. Higher rates of ophthalmological disorders can be seen in the provinces of Sitia, Selinou, and Monofatsi. The map aims to constantly monitor disorder prevalence and identify high risk areas that should be under hospital and primary healthcare coverage. Based on these findings, a list has been compiled of villages suitable for future visits by the MOU.
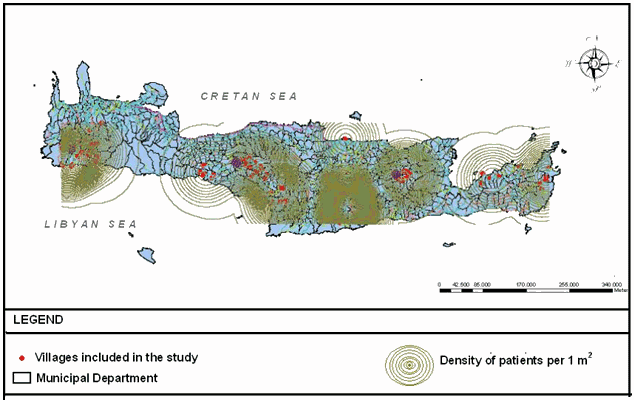
Figure 2: Density map of the island of Crete showing number of sample
patients per m2 in villages (as n patients increase the circles become denser).
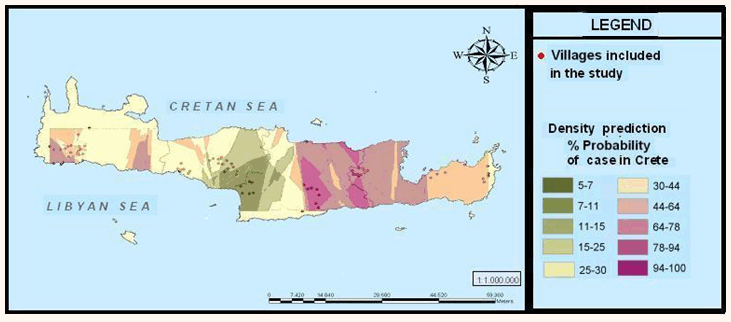
Figure 3: Probability of cases of ophthalmological disorders in Crete, mapped using kriging methodology.
Discussion
Main findings
There are many studies examining the prevalence of ophthalmologic diseases worldwide or presenting the results of similar surveys. Most of these studies have taken place in developing countries that lack sufficient coverage by ophthalmologic services, and the prevalence of blindness, glaucoma, and cataracts estimated is in a range very similar to that found in the present study17,18. However, other studies concerning these eye abnormalities are concordant with the present study both in relation to the results and the applied spatial methodology. For instance, in the study of Ramakrishnan et al, spatial methods were applied to determine the prevalence of glaucoma and detect risk factors in a rural population of northern India19. The prevalence of glaucoma was found to be 2.6% (2.3% in the present study), while the authors found that glaucoma varies accorded to region, race, and age19. Additionally, a study by Koichi et al assessed the geographic distribution of eye health professionals and cataract surgery procedures in Lao People's Democratic Republic for the past few decades20. Although this study used cataract surgery (rather than cataract cases as in the present study), it utilized methodological patterns very similar to the present study; these authors also highlighted spatial heterogeneity, and noted significant changes over time20. As far as the authors know, this is the first time that geospatial analysis of ophthalmic diseases has been performed in rural areas of Crete. The density of cases with an ophthalmologic disorder seemed to vary among different locations on the island leading to a significant spatial heterogeneity. This heterogeneous distribution occurs despite the fact that Crete is considered to have a fairly homogeneous population.
Geospatial analysis could be used as a means to constantly monitor disorders and identify high-risk areas where there should be more intense primary healthcare and hospital coverage. Based on the geospatial analysis of the present data, the authors were able to suggest 'high-risk' locations to be considered for future visits of the MOU. Specifically, this type of analysis was used to assess the primary ophthalmological coverage of each location.
Limitations and strengths
The study sample was not randomly selected, so the estimated prevalence has selection bias. A possible result of this bias might be a higher percentage of patients with refractive errors in the younger aged group of patients; this may result from reduced interest in eye examination by young people without known eye problems, leading to overrepresentation of patients with refractive errors in this group. Despite this limitation, the study results rank the prevalence of ophthalmologic disorders (cataracts, glaucoma, refractive errors) similarly to other studies. Furthermore, the estimated glaucoma prevalence was 2.3%, a result close to the value of 2.8% that was recently estimated by the study of Cozobolis et al of the region of Crete21, and also close to Ramakrishnan et al's finding19. Further, the type of analysis applied in this study is appropriate for managing any such bias, due to its reliable and sophisticated mathematical models and equations.
Implications
The ratio of newly diagnosed cases to already diagnosed cases was extremely high, with glaucoma having the highest ratio. Because glaucoma progresses silently for a long period before it induces symptoms, people are less likely to seek ophthalmological consultation early in the disease course. As can be derived from the results, there is no effect from the demographic variables (age, sex), but there is a higher risk for cataracts and refractive errors in people living in rural areas, especially remote areas, due to difficulties in accessibility. This result indicates that there is insufficient ophthalmological service coverage in remote villages in the island of Crete.
Finally, the reported spatial processing of data collected will assist with the planning of future MOU visits.
Spatial analysis of primary ophthalmological data collected by an MOU can be used to assess high risk areas and plan more effectively for future visits. This study introduces a novel combination of spatial analysis and epidemiological research to diagnose glaucoma, cataracts, and refractive errors in order to assist with improving regional medical coverage, and planning public health interventions. A future, larger, randomly selected sample will facilitate effective planning of MOU activity.
References
1. World Health Organization. World health report. (Online) 2011. Available: http://www.who.int/whr/2001/en/ (Accessed 1 June 2011).
2. Tielsch JM, Javitt JC, Coleman A, Katz J, Sommer A. The Prevalance of blindness and visual impairment among nursing home residents in Baltimore. New England Journal of Medicine 1995; 332: 1205-1209
3. Pistolla G, Prastakos P, Vassilaki M, Philalithis A. Spatial-mathematic methods for analysis of indicators of mortality. International Journal of Advanced Engineering Sciences and Technologies 2011; 2: 136-137.
4. Christopher JLM, Lopez AD. Mortality by cause for eight regions of the world: Global Burden of Disease Study. The Lancet 1997; 349: 1271-1276.
5. Bell SB, Hoskins RE, Pickle LW, Wartenberg D. Current practices in spatial analysis of cancer data: mapping health statistics to inform policymakers and the public. International Journal of Health Geographics 2006; 8(2): 49-63.
6. Jacquez GM. Current practices in the spatial analysis of cancer: flies in the ointment. International Journal of Health Geographics 2004; 3(3): 22-32.
7. Boscoe FP, Ward MH, Reynolds P. Current practices in spatial analysis of cancer data: data characteristics and data sources for geographic studies of cancer. International Journal of Health Geographics 2004; 3(1): 28-42.
8. Buntinx, Geys H, Lousbergh D, Broeders G, Cloes E, Dhollander D et al. Geographical differences in cancer incidence in the Belgian province of Limburg. European Journal of Cancer 2003; 39: 2061-2065.
9. Emery X. Simple and Ordinary Kriging Multigaussian Kriging for Estimating Recoverable Reserves. Mathematical Geology 2005; 37: 295-319.
10. Stein A, Van der Meer F, Gorte B. Spatial Statistics for remote sensing. Environmental and Ecological Statistics 2002; 83: 17-33.
11. Oliver MA. Kriging: A Method of Interpolation for Geographical Information Systems. International Journal of Geographic Information Systems 1990; 4: 314: 332.
12. MMIC. Mobile Ophthalmological Unit, Mobile Medical International. (Online) 2011. Available: http://www.mobile-medical.com/MOU (Accessed 1 June 2011).
13. Psillas GK. Introduction in ophthalmology and neuro-ophthalmology, 2nd edn. Thessaloniki, Greece: University Studio, 1996.
14. Burrough PA. Principles of Geographical Information Systems for Land Resources Assessment. New York: Oxford University Press, 1986.
15. Heine GW. A Controlled Study of Some Two-Dimensional Interpolation Methods. COGS Computer Contributions 1986; 3: 60-72.
16. McBratney AB, Webster R. Choosing Functions for Semi-variograms of Soil Properties and Fitting Them to Sampling Estimates. Journal of Soil Science 1986; 37: 617-639.
17. Atteco K, Mitchell P, Smith W. Visual Acuity and the Causes of Visual Loss in Australia. The Blue Mountains Eye Study. Ophthalmology 1996; 103: 357-364.
18. Bergman B, Sjostrand J. Vision and Vision Disability in the Daily Life of a Representative Population Sample Age 82 Years. Acta Ophthalmologica (Copenh) 1992; 70: 33-43.
19. Ramakrishnan R, Nirmalan PK, Krishnadas R, Thulasiraj RD, Tielsch JM, Katz J et al. Glaucoma in a Rural Population of Southern India: The Aravind Comprehensive Eye Survey. Ophthalmology 2004; 111: 331-334.
20. Koichi O, Visonnavong V, Konyama K, Hiratsuka Y, Murakami A. Geographical Distribution of Eye Health Professionals and Cataract Surgery in Lao People's Democratic Republic. Ophthalmic Epidemiology 2009; 16: 354-361.
21. Kozobolis VP, Detorakis ET, Tsilimbaris M, Siganos DS, Vlachonikolis IG, Pallikaris J. Crete, Greece Glaucoma Study. Journal of Glaucoma 2000; 9:143-149.
