Introduction
Health care in Canada is open to all Canadians and landed immigrants. It allows individuals to choose their primary care provider, whether in clinics, emergency rooms, or doctors' rooms. In Quebec, the number of family physicians approved to practice in a regional area is a complex process determined by the Ministry of Health. Although in the province of Quebec 75% of the population is said to have a family doctor1, rural regions experience difficulties in attracting sufficient family physicians. The system's capacity to satisfy the demand of the population to consult a doctor has been subject to many constraints and variations. The use of regional emergency room (ER) services for non-urgent health problems is increasing at the disturbing rate of 4.9% per year2 with a possible link to the lack of other alternatives. Drivers to potentially reduce demand for health care include the evolution of shifts in healthcare institutions that affect the level and type of services demanded3.
Demand for health care has been studied for many years. Since the 1960s, Andersen's Health Care Utilisation Model has been used, adapted, and modified to integrate the 'who's and the why's of health services' use'4. The original model suggested that the use of healthcare services is a function of a person's predisposition to use services, factors enabling or impeding their use, and the person's need for care. Among those predisposing factors were demographics (eg age and sex), social structure (eg social networks and interactions) and health beliefs. Enabling factors included health personnel and facilities, education and income, waiting times and distance. 'Need for care' includes the person's assessment of his/her general health and functional state. Environment and provider-level measures are necessary but not sufficient conditions because perceived or evaluated need is required for utilization to take place5. But how to measure the influence of those factors?
Studies involving use of services of a large population are uncommon. An exception is the Manitoba Centre for Health Policy. In their 2009 report, it was found that use of physicians was significantly related to income in rural areas, but not urban areas6. For both sexes, the crude rates of ambulatory visits to physicians were similar over time with two noticeable changes since 2003: children and young adults rates were lower, and oldest residents' rates were higher.
Most research on healthcare demand is based on samples and targeting specific sub-populations or facilities, mainly ERs7-9. Patients interviewed in the studies mentioned cited many factors affecting their preferences to seek primary care, but proximity, unavailability of care in a regular clinic, and incompatible office hours were often reported. The researchers of these studies classified visits as a 'posteriori' and some were labelled 'inappropriate' or 'non-urgent', using different criteria10. However, the results showed that extensive use of ERs is linked to a lack of other alternatives preferred by users. The effects of the lack of better alternatives on other facilities were not considered, with the research mainly describing patients' opinions or quantifying the amount of unnecessary visits to the ER.
The purpose of the present study was to link administrative data from six facilities to find the variables that better explain the choice of patients in the Val Saint Francois (VSF) area. The present results provide a first insight into different patients' profiles, according to age, sex, and community. A quantitative evaluation was made of the effects created in nearby facilities when a facility modified its offer of services.
Information on Val Saint François
Val Saint-Francois is a region in south-eastern Quebec with approximately 30 000 inhabitants in 18 municipalities, including Richmond, Windsor and Valcourt. According to the 2006 Census, the population density is 20.4 inhabitants per km2, making it a rural area according to the OECD (Organization of Economic Co-operation and Development) definition of less than 150 people/km2 (Fig1). Windsor, the main center, is located a half-hour's travel from the city of Sherbrooke. The population is stable, with a reported growth of approximately 1% in period 2001-2006. There are 6 communities in VSF. The community of each person is defined according to their postal code and roughly corresponds to municipalities or to geographic areas created by Statistics Canada's 2006 Community Profiles11 of approximately 5000 inhabitants. Like other rural areas, 52% of the population is 40 years or older.
Information on healthcare facilities
Medical care is mainly provided by general doctors working on clinics and emergency rooms; the two emergency rooms are located in the Fleurimont Hospital (FL) and the Hotel-Dieu hospital (HD). There is a Minor Medical Emergency in Windsor and three Clinique Local de Santé Communautaire (local community health clinic; CLSC) clinics, located in the main cities of Richmond, Windsor and Valcourt. The Minor Medical Emergency is a walk-in clinic open 12 hours per day, providing medical services, X-rays and sampling for laboratory analysis, and is the most important medical facility in the region. The CLSC clinics provide regular medical services by appointment, depending on the availability of doctors. These clinics open from Monday to Friday and serve a mostly older population. The other facilities included in the present study are the 2 ERs of the regional hospital located in the city of Sherbrooke; both ERs are open 24 hours/7 days and are located 11 km from Stoke and 50 km from Richmond, respectively.
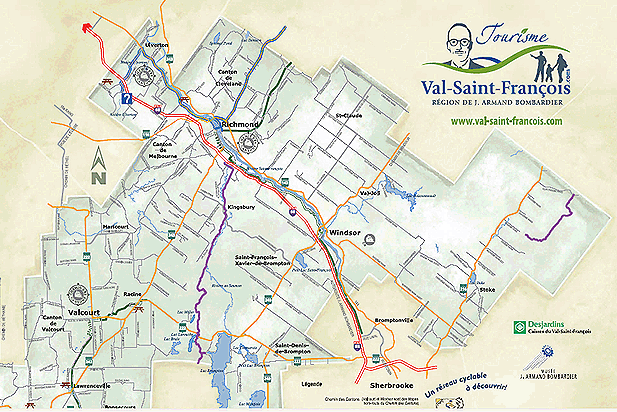
Figure 1: Map of Val Saint Francois12(reproduced with permission).
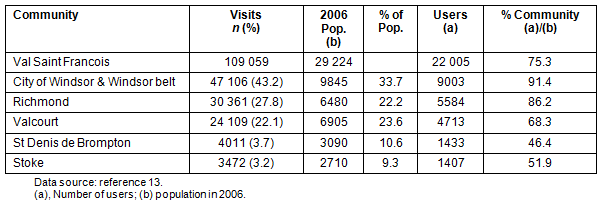
Table 1 shows that the 6 facilities considered in the present study satisfy a high proportion of the primary care demand. The highest participation is in the Windsor area, where 91.4% of its population visited at least one of the six facilities in the present study once. A low percentage of users came from the communities of St Denis de Brompton and Stoke, indicating that these communities were probably seeking healthcare services outside the Val Saint Francois, because there is no medical service in either community. For the purposes of this study, a 'visit' is a formal request to see a doctor. Tourists, visitors, and individuals without a valid healthcare card are accepted at all medical services but these visits were excluded from this study.
Table 1: Distribution of visits, population, and users13
Methods
The data source was two information systems. One was the local healthcare commission system, containing all visits to the CLSC clinics and the Minor Medical Emergency from 1 January 2002 to 31 March 2006. The other data source was the information system of the regional hospital, which contains less urgent and non-urgent visits (Canadian triage and acuity scale; CTAS IV and V) to the ER from 29 April 2002 to 30 June 2006. Both databases were linked through the healthcare card number, eliminating individual health care numbers to protect data confidentiality. The period of time studied was therefore determined by the intersection of the two systems' time periods. All visits to the 6 facilities included in the present study are medical visits. The record for each visit contains the patient's age and sex, the postal code, the date, and the facility visited. Only those records having a postal code within VSF and a valid healthcare card were retained. These represent 93% of all ER visits, 87% of CLSC visits and 85% of Minor Medical Emergency visits. Children had to have their own healthcare card to be included in the present data. The present study does not include visits to the other 4 medical clinics in VSF or to any facility outside VSF.
Ethics approval to access the administrative data was obtained from the Research Ethics Committee of the Eastern Townships Health and Social Services Agency on 30 October 2006.
Recursive induction trees
In order to better understand patients' choices, a recursive tree method, S-PLUS, v5 (Insightful Corp; Palo Alto, CA, USA), was run on the linked database of visits, with 'facility' as the response variable and the other 4 factors (sex, age, date, and community) as explanatory variables. The procedure defines the set of combinations of explanatory factors that allows partitioning the visits into several groups, the most homogeneous but also the most distant possible14. There is no requirement for the explanatory variables to be independent, as it is the case in regression analysis, and it is possible to introduce in the model a mix of categorical and numerical variables. The groups created by the induction process are more or less homogeneous and an error value measures the degree of homogeneity of the values taken by the response variable over the entire set of groups created. Perfect homogeneity in the present case would mean that all users in a partition went to the same facility and, therefore, the homogeneity of such unrealistic groups would have an error value of zero.
The resulting tree is often pruned to keep only meaningful partitions, because the algorithm keeps partitioning the subsets until a stop criterion is met, a minimal size of the subsets, for example. A minimum size of 350 visits in a partition was set. With a categorical response variable like the present, the recursive tree provides not only a category for each subset, as in the case of multinomial regression, but also a full probability distribution of the possible responses. The facility with the highest probability value is the most likely to be visited, then the second largest corresponds to the subset's second choice, and so on. The solution tree obtained with the present data was pruned a posterior, to remove all subsets whose probabilities were similar, in that they did not show a clearly different behaviour. The results of the pruned induction tree for the Windsor area will be provided.
A graphical representation of the tree for the city of Windsor and Windsor belt is presented (Fig2). Note that the visits from these communities were split first by sex, men's visits were then divided by age groups, and one age group subdivided according to date of visit. This tree indicates the existence of four users' profiles for men and only one for women. The homogeneity of women's visits by age or date did not lead to further mining. Patterned boxes in Figure 2 show the five homogeneous groups, the three percentages in parenthesis indicating each group's preferences for hospital ERs, CSLCs, and the Minor Emergency. A change in user behaviour occurred by 21 May 2004, when the probability of choosing the Minor Emergency went from 80.3% to 73.4%. The 7% decrease was split between the hospital ERs and the CLSCs, increasing their probabilities by 3.3% and 3.6%, respectively. Classification trees do not provide the reason for such change but they point out a search direction for further analysis.
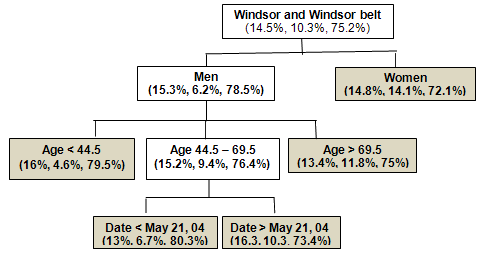
Figure 2: Classification tree for the Windsor communities
Results
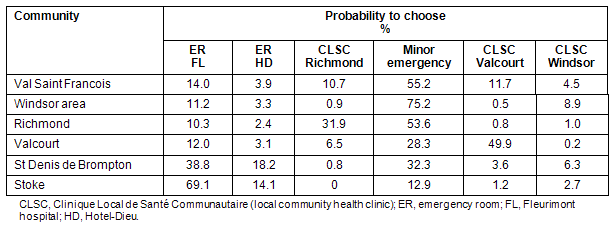
The most important explanatory factor in patients' choice of primary care facility was the community. The first split of the recursive tree method is presented (Table 2): the distribution of visits among the 6 healthcare facilities for each community, with the city of Windsor and Windsor belt aggregated by the classification tree because the distribution of visits was homogeneous enough to further split. Overall, the most preferred facility of VSF was Minor Emergency with 55.2%, followed by the ER of FL with 14% and the local CLSC clinics. The populations of Richmond and Valcourt used their local CLSC clinics more than the other communities and the preference for the FL in St Denis de Brompton and to Stoke may be explained by the fact that it is the closest facility. Distance is therefore the first important factor of choice.
Table 2: Effect of community on the choice of healthcare facility
Choices in the Windsor area
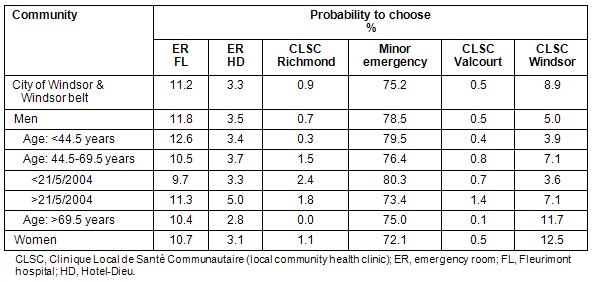
In the Windsor area sex and age were the second and third factors of importance in facility choice. A larger proportion of men used the Minor Emergency, and older men and women used the local CLSC (Table 3). All 6 probabilities of choosing the facilities are presented (Table 3: data expanded from Fig 1). The Minor Emergency was found to be closed during weekends from the beginning of May 2004 until mid-July 2005. Men in the age group 44.5-69.5 years changed their preferences after this reduction in service but the percentages of women of all ages did not change. It is interesting to note that although weekend services resumed in July 2005, men aged 44.5-69.5 years did not resume their previous behaviour.
Table 3: Preferences by sex, age, and date of Windsor and surrounding areas
Choices in Richmond
Age and sex were the second and third most important factors in facility choice for the population of Richmond, as shown (Table 4). Minor Emergency was the most preferred facility (53.6%) followed by the local CLSC (31.9%). As with the Windsor area, young men used the Minor Emergency and the ER of Fleurimont much more than women, and women used the CLSC more than young men. For the older population, men between 46.5 and 64.5 years still preferred the Minor Emergency.
Before July 2002, 30% of males aged between 1.5 and 46.5 years changed preferences. This date was just 3 months after the start of the present data collection; no special event occurred at that time and so this change may not be significant to previous level of service. On 1 June 2005, women aged 46.5 years and older shifted from the local CLSC to the further Minor Emergency. Around this date, the CLSC lost two doctors, reducing the capacity of this facility for a few weeks. The recursive tree found that older women changed their choices but this reduction in service did not affect men older than 46.5 years who preferred the ERs. Figure 3 shows a declining number of visits per month in the CLSC Richmond. The service reduction in the summer of 2005 is clearly visible in the graph (Fig3), but identifying the shift of preferences and its magnitude is one of the benefits of the classification tree.
Table 4: Preferences by age, sex, and date of Richmond
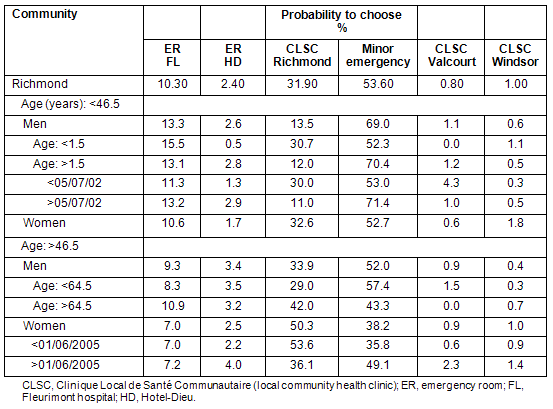
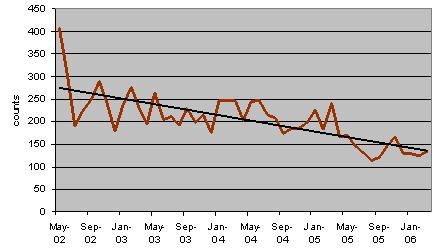
Figure 3: Visits per month to Clinique Local de Santé Communautaire Richmond
Choices in Valcourt
The recursive tree results for the community of Valcourt are shown (Table 5). Age again is the second criterion, and sex third. Young men (<39.5 years) preferred the Minor Emergency more than older men who preferred the local CLSC.
Table 5: Preferences by age, sex, and date of Valcourt
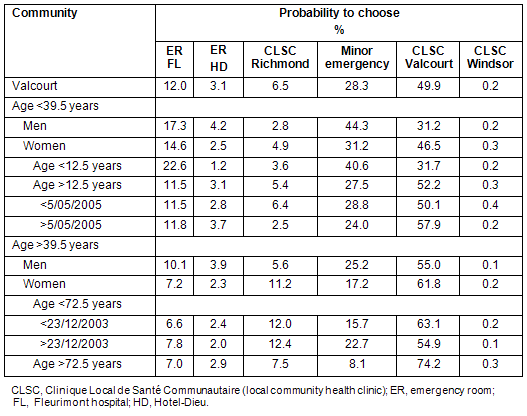
After 23 December 2003, women aged between 39.5 and 72.5 years changed preferences. The 9% fall in visits to the local CLSC caused an 8% increase to the Minor Emergency and an extra 1% to the ER Fleurimont. The total number of visits to this CLSC clinic plummeted during 2004 (Fig4), and then increased to surpass the number of visits in 2003. When services resumed, younger women's preferences increased by 7.8%, with a decrease to Minor Emergency of 4.8%.
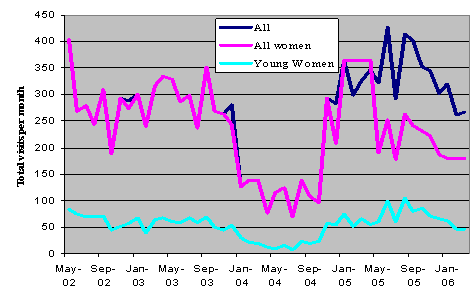
Figure 4: Visits per month to Clinique Local de Santé Communautaire Valcourt
Choices in St Denis and Stoke
St Denis de Brompton and Stoke are two small communities that are very different from the other three. The recursive induction tree only found significant differences by age in the community of St Denis. For population ages under 62.5 years, regardless of sex, the prime destination was the ER of Fleurimont. The choices were different and more spread for the older population. Finally, the classification process did not find any important differences in the visits from Stoke when age, sex or dates were the factors considered; this may be due to the small number of visits from these communities.
Changes in service levels and frequency of use
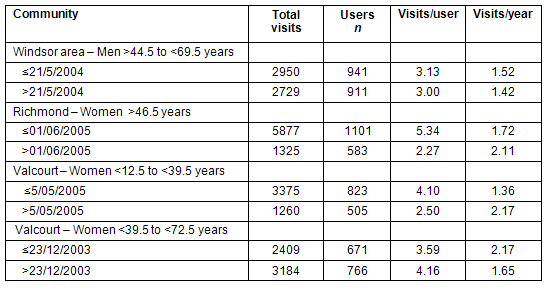
In the previous section four major preference changes within the same age-sex group was found. Further analysis of these groups revealed that average use also changed for all of them. The number of total visits, number of users, average number of visits per user and the equivalent average number of visits per year is provided (Table 6). It was necessary to add this last value because the dates split the present 4 year period of study into uneven time intervals; because the number of patients in each interval is different, the changes were underlined in an equivalent per year basis.
For the first group, Windsor men decreased the annual number of visits per person after changing preferences to a further hospital ER from 1.52 to 1.42 visits per person per year. In the second group, Richmond women aged over 46.5 years increased their average visits from 1.72 to 2.11 visits per person per year after switching choices from their local CLSC clinic in favour of the Minor Emergency. This increase was also observed in the third group (Valcourt women aged 12.5-39.5 years) who went from 1.36 to 2.17 visits per person per year when changing to their local CSLC. Finally for the last group, the change in women's preferences to Minor Emergency was followed by a decrease in the average visits per year from 2.17 to 1.65. The present data do not allow any explanation for these changes in the frequency of use, but further investigation would be important.
Table 6: Changes in primary care use
Discussion
When a need for care was identified, the present findings support the idea that requests to see a doctor vary according to enabling and predisposing factors. Community, followed by age and sex are the three most important determinants of the choice of facility in VSF. Moreover, exact dates were discovered when a change in the hours of operation was followed by a change in patients' choices. This finding supports the notion that barriers that prevent the potential of healthcare delivery to be realized. Such barriers include the internal organization of resources, such as appointment systems and hours of operation, which should match the patient's ability to utilize them.
A study on the access to health care in rural India found that price of and distance to a health facility play significant roles in provider choice decision15. The role of distance to a near hospital was also found to be associated with high use of ER in the US Medicaid population16, where individuals living more than 30 min from the hospital had 26% fewer visits to the ER than those living 10 min away or less. The effect of distance on reducing the average number of visits was found only for the Windsor men and older Valcourt women but not for the Richmond older women.
Use of ERs rather than clinics was also found among individuals with no family doctor or regular health clinic17,18. The present data do not include information about whether the patient has a regular doctor. However, given the shortage of family physicians in the region, it is possible that a large percent of ER users did not have other alternatives, given that CLSC clinics require an appointment during regular working hours.
Efforts to reduce non-urgent visits to the ER include the establishment of primary care clinics near hospitals. In Belgium, one year after the implementation of a General Practitioner Cooperative more people sought help at the general practitioner cooperative (GPC), while the number of contacts at the ER remained the same19. In July 2010 a multisite GPC opened in VSF. As the number of doctors in the area remains the same, it will be interesting to see how the new organization of services modifies the use of the 6 facilities studied in this research.
Conclusions
In this article, administrative data were analyzed and it was found that the choices of healthcare facility vary according to community, age and sex. It was possible to relate changes in some age-sex group choices to reductions and/or increases in the amount of services available. The impact of those changes were calculated.
Patients in VSF strongly preferred a local facility or a near one even, if it is the ER of a large hospital. Men of all ages used the ERs more than women, who preferred the care given at local CLSC clinics. Overall, it was found that 15% more medical visits were made by women than men, indicating perhaps that CLSC clinics are giving continuity of care, a task for which hospital ERs are not organized. It is interesting to note that for all groups, one or two facilities satisfied at least 70% of demand; this shows a strong loyalty to preferred facility, possibly reflecting the importance to patients of good personal rapport and communication with their doctor.
Knowledge of the way patients react to changes in the supply of primary care is important for a proactive delivery of services. When facing the loss of a family physician (eg due to illness, retirement, parental leave) healthcare officials may anticipate the demand increase or decrease at nearby facilities, mainly the ERs, based on results similar to those here presented. The benefits of an effective and efficient resource allocation are felt by everyone.
Acknowledgments
The authors thank the three anonymous referees for their very helpful comments. They also acknowledge the support of the Archives Department of the CHUS Fleurimont, and the support of the CSSS Val Saint-François, mainly Mrs Manon Allard, in the long process of acquiring the data and for her help in interpreting some of the results. This work was partially funded by a research grant from Bishop's University, Quebec, Canada.
References
1. Donovan D. Accès aux médecins de famille. Infobulle 2005; 6(2). Available: http://www.santeestrie.qc.ca/publication_documentation/ (Accessed 8 January 2010).
2. Zubieta L, Béquet S. Recursive Induction for non urgent visits to ER. In: Proceedings, Conference of the Administrative Sciences Association of Canada; 2-5 June 2007; Ottawa, Canada, 2007.
3. Murray G, Gilbert J, Wong J. Managing the Demand for Healthcare in Canada. Hospital Quarterly 2002; 6: 55-58.
4. Andersen R. Revisiting the behavioural model and access to medical care: does it matter? Journal of Health and Social Behaviour 1995; 36(1): 1-10.
5. Aday LA, Begley CE, Lairson DR, Balkrishnan R. Evaluating the healthcare system: effectiveness, efficiency, and equity, 3rd Edition. Chicago, IL: Health Administration Press; Academy Health, 2004.
6. Fransoo R, Martens P, Burland E, The Need to Know Team, Prior H, Burchill C. Manitoba RHA Indicators Atlas. (Online) 2009. Available: http://mchp-appserv.cpe.umanitoba.ca/deliverablesList.html (Accessed 2 May 2010).
7. Brown EM, Goel V. Factors related to emergency department use: results from the Ontario health survey 1990. Annals of Emergency Medicine 1994; 24(6): 1083-1091.
8. Carret MLV, Fassa AG, Domingues MR. Inappropriate use of emergency services: a systematic review of prevalence and associated factors. Caderno de Saúde Pública 2009; 25(1): 7-28.
9. Oktay C, Cete Y, Eray O, Pekdemir M, Gunerli A. Appropriateness of emergency department visits in a Turkish university hospital. Croatian Medical Journal 2003; 44(5): 585-591.
10. Harris L, Bombin M, Chi F, deBortoli T, Long J. Use of the emergency room in Elliot Lake, a rural community of Northern Ontario, Canada. Rural and Remote Health 4: 240. (Online) 2004. Available http://www.rrh.org.au (Accessed 15 January 2010).
11. Statistics Canada. Community profiles cat no 92-597-XWE. (Online) 2006. Available: http://www.statcan.gc.ca/bsolc/olc-cel/olc-cel?lang=eng&catno=92-597-X (Accessed 2 May 2010).
12. CLD de la MRC du Val-Saint-François. Map of Val Saint Francois. Available: http://tourisme.val-saint-francois.com (Accessed 15 January 2010).
13. Tableau de Bord des Communautés de l'Estrie. Observatoire estrien pour le développement des communautés. (Online) 2006. Available: http://www.oedc.qc.ca/tableau-de-bord (Accessed 10 January 2010).
14. Ritschard G, Zighed D. Modélisation de tables de contingences par arbres d'induction [Modeling contingency tables by induction trees]. Revue des Sciences et Technologies de l'Information 2003; 17(1-3): 381-392.
15. Borah BJ. A mixed logit model of provider choice: analysis of NSS data for rural India. Health Economics 2006; 15(9): 915-932.
16. Lowe RA, Fu R, Ong ET, McGinnis PB, Fagnan LJ, Vuckovic N et al. Community characteristics affecting emergency department use by Medicaid enrolees. Medical Care 2009; 47(1): 15-22.
17. Petersen LA, Burstin HR, O'neil AC, Orav J, Brennan TA. Non-urgent emergency department visits: the effect of having a regular doctor. Medical Care 1998; 36(8): 1249-1255.
18. Lang T, Davido A, Diakité B, Agay E, Viel JF, Flicoteaux B. Using the hospital emergency department as a regular source of care. European Journal of Epidemiology1997; 13(2): 223-228.
19. Philips H, Remmen R, Van Royen P, Teblick M, Geudens L, Bronckaers M et al. What's the effect of the implementation of general practitioner cooperatives on caseload? Prospective intervention study on primary and secondary care. BMC Health Services Research 2010; 10: 222. (Online) 2010. Available: http://www.biomedcentral.com/1472-6963/10/222 (Accessed 30 July 2010).
Modified 29 November 2010: The order of references 11 and 13-19 has been adjusted.
