Research in Canada, and elsewhere, has examined the relationship between rural residence and health. Although patterns differ by indicator, residents of Canada's rural and remote areas generally show a health disadvantage relative to their urban and suburban counterparts1-8.
While showing that there are differences in rural and urban health is interesting, existing literature has not given adequate consideration to variations in health among rural areas, and the factors that account for that heterogeneity2,9. In Canada, population trends and migration intersect with economic, social, and political processes, contributing to the differentiation of remarkably heterogeneous rural places10-12. Health in rural areas, and its determinants, is likely to be variable as well.
Despite ongoing research, the mechanisms by which rurality may be associated with health remain unclear. While rural location in itself does not necessarily lead to poor health, it may be related to population age and ethnicity, socio-economic disadvantage, more hazardous occupational, environmental and transport conditions, and poorer health care service availability13,14. Such factors have potential to influence health through both compositional and contextual effects15,16.
This article describes health in Canada along the urban-rural continuum. It then examines variation in health both between and within categories of rural areas, and explore individual and area factors that may explain observed variations in health.
Data sources and study population
Data on individual health and covariates (age, sex, income, educational attainment, Aboriginal, and Francophone identity) were obtained from the Canadian Community Health Survey (CCHS) Cycle 1.1. The CCHS is a cross-sectional national survey conducted by Statistics Canada in partnership with Health Canada. It employs a multi-stage stratified cluster sampling design, and includes questions dealing with health status, health determinants, and healthcare utilization. People living on Aboriginal reserves and full time members of the Canadian Forces are not included. Cycle 1.1 was selected as it was the last year in which the Health Utilities Index (HUI) was obtained for all responses, and it coincided with a census year (2001). In subsequent years HUI was only collected for a small subset of the sample, greatly limiting statistical power to examine small area variations in health. The study population was drawn from the 118 336 respondents who were aged 18 years or older.
The attributes of rural areas were described at the level of census subdivisions (CSDs), using data from the 2001 Canadian Census. The CSDs include formally-delineated areas such as municipalities, or areas treated as municipal equivalents for statistical purposes (eg First Nations reserves and settlements), as well as areas of rural Canada that are not formally organized. In this way, CSDs provide complete coverage of rural places in Canada, and also reflect meaningful administrative units. They are also the unit at which Metropolitan Influenced Zones (MIZ), the classifications of rurality used in this study, are applied. There were 3187 CSDs at the time of the 2001 census.
The CCHS Cycle 1.1 employed 1996 census geography, and was translated to 2001 geography and linked to census data using the postal code conversion file (PCCF+)17 following published procedures from Statistics Canada18. Access to the CCHS data was obtained from the Atlantic Research Data Centre. Research ethics approval was obtained from the Dalhousie Health Sciences Research Ethics Board.
Measures
The Health Utilities Index (HUI) were used to measure health status. It provides a multi-dimensional utility score for health-related quality of life. It has been validated for a wide range of health conditions19-21 and was the only preference-weighted measure of health status available for all respondents on the CCHS. Another commonly-used measure of health that is available on the CCHS, self-reported health, may reflect differences in preference and valuation of health in addition to latent health22. The HUI minimizes the impact of these differences as it assigns standardized score to each health state. The HUI is skewed, with a high proportion of respondents scoring close to 1 (perfect health). The cut-point of 0.83 has been suggested as indicative of dysfunction, based on clinical judgment and consensus among investigators in previous studies23-26. In the analysis HUI was dichotomized; a score of 0.83 or above is considered 'good health'.
Canadian definitions of 'rural' have been described in detail elsewhere27,28. The Metropolitan Influenced Zones (MIZ) classification, developed by Statistics Canada, was chosen for the present analysis because it is readily comparable to other Canadian research, and takes into account not simply geographic proximity, but degree of connectivity with urban areas27,29. Urban areas are Census Metropolitan Areas (CMAs), which have a core population greater than 100 000 and include neighboring municipalities where 50% or more of the workforce commutes into the core, and Census Agglomerations (CAs), which have urban core populations between 10 000 and 100 000 and also include neighboring commuting areas. To distinguish populations with greater access to the resources of large urban centers from those with less access, rural areas are divided into zones of metropolitan influence based on commuting flows of the employed labor-force to nearby urban areas. Strong MIZ corresponds to 30-50% commuters, Moderate MIZ to 5-30%, and Weak MIZ to 0-5%. Areas of no MIZ include CSDs that have an employed labor-force of fewer than 40 people, and CSDs that have no commuters to a CMA or CA. The Territories are not classified using the MIZ system, and were included as a separate category in analysis.
Individual-level variables included in analysis were age, sex, education, median household income, employment, and self-identification as Aboriginal or Francophone. Income was categorized into <$10,000, $10,000-$19,999, $20,000-$39,999, ≥$40,000, and unknown. Education was grouped by highest level of educational attainment.
Chosen census variables have been shown to be related to health in previous research, or were thought to be important in capturing social or economic differences among rural areas. Areas with a high proportion of older residents may experience particular challenges in the provision of health and social services, and thus the proportion of residents aged over 65 years on the 2001 census was included. The proportion of the population identifying as Aboriginal was examined, as communities with large Aboriginal populations may experience unique health challenges (although First Nations Reserves are not included in the CCHS). The proportion of the population of French or Acadian ethnic origin was included to explore differences between Francophone and Anglophone communities. While migration may be an important driver of the composition of rural places, it was not possible to examine this using cross-sectional data. The variable 'five year movers' captures the proportion of CSD residents in 2001 that had moved in the previous 5 years (including those who moved within the CSD, from elsewhere in the province, or from another province).
Income, education, and employment were included as area measures of socioeconomic status, reflecting the shared opportunity structure of a given area. Area income categories (close to quartiles), reflect the narrower distribution of median incomes: <$17,000, $17,000-$19,999, $20,000-$23,000, ≥$23,000. Area education was measured by the proportion of the population with secondary diplomas. Unemployment was captured as the proportion of the total labor force that was unemployed in the week prior to the census. Unemployment therefore includes members of the labor force not currently working, though it does not reflect discouraged workers, who are unemployed and no longer looking for work.
The proportion of the labor force employed in primary industry (agriculture, forestry, fishing and/or hunting) was based on the 2001 National Occupational Classification used by Statistics Canada30. This variable was included as high risk of injury in these occupations has been cited as a factor contributing to poor health in rural areas13. At the same time, such employment may be more physical in nature and demand higher levels of physical function. Since primary industries are particularly susceptible to boom-and-bust cycles31,32, employment in these sectors may also be related to economic decline or rapid growth.
Statistical analysis
The percent of people in good health (HUI ≥0.83) was tabulated by degree of metropolitan influence and by individual categorical variables. Sample weights for the CCHS were used to account for the complex sample design, and to adjust for non-response and for post-stratification. Weighted and un-weighted values are reported.
Regression analyses investigated the associations of HUI with individual and area characteristics. Because individuals are 'nested' within areas, simple regression is not appropriate as it cannot be assumed that there is independence of errors between the responses. Multilevel modeling accounts for the nested structure of the data, including variables at two levels of analysis: individual and area. This analysis also partitions to overall variation between individuals, which is not explained by the variables in the model, into between-area and between-individual components, thereby quantifying heterogeneity among areas. All models were random intercept models of the form:

The effects of individual level variables (vector ) and area level variables (vector
 ) are estimated with the fixed-effect coefficient vectors
 and
and  . In all tables, these effects are expressed as odds ratios with 95% confidence intervals. The
 is the random effect capturing variation between areas in the intercept, and is assumed to be normally distributed and independent of the individual error term,
 . Since the dependent variable,
 was the dichotomized HUI score, logistic regression models were estimated. Although sample weights are available in the CCHS and were used for descriptive analysis, the sampling units employed by the CCHS do not correspond to the area units used in regression analysis, and so were not appropriate for multilevel analysis. However, the chosen analytic method addresses geographic clustering inherent to survey design, and adjustment for age and sex further accounts for unequal probabilities of selection. All models were estimated using STATA v10 (StataCorp; College Station, TX, United States).
To describe between-area variation in health, the proportion of the total variation accounted for by the area random effect were estimated, which is the intra-class correlation coefficient (ICC). In addition, to aid interpretation of the magnitude of the effect of area relative to other variables in the models, the ICC was expressed using the median odds ratio (MOR)33,34. The MOR can be interpreted as the median amount by which the probability of disability will change for an individual who moves from one area to another. Essentially, this re-expresses between-area variation in an odds ratio scale (ie if it is equal to one, there is no between-area variance), and so allows the magnitude of the area effect to be compared with the magnitude of the fixed individual and area effects in the models. The formula used is as follows:

Two incremental modeling procedures were undertaken. Throughout all analyses, a random intercept was included at the area level, but all other variables were assumed to have fixed effects. Wald χ2 tests were used to test whether the coefficients for categorical variables with more than two levels were jointly equal to zero.
The first set of models re-examined differences in health between urban and rural Canada by exploring the effect of MIZ on HUI in the full CCHS sample (including CMAs and CAs). This analysis included 116 658 CCHS respondents, corresponding to 3187 CSDs (out of a total of 5600 in the 2001 Census). The geographic clustering of the CCHS sample design explains why a large proportion of CSDs do not contain respondents. A total of 59 respondents were excluded who could not be linked to a CSD using the PCCF+ and 1619 respondents missing HUI in the survey. Three models were run to describe the degree to which MIZ and area effects were explained by compositional and contextual factors: the first included MIZ alone, the second added effects for age and sex, and the third added the remaining individual-level variables. Models stratified by MIZ were run next, in order to describe between-area heterogeneity (ie ICC and MOR) within each level of MIZ, and the degree to which it was explained by individual-level characteristics.
The second set of models examined variation in health among the 39 744 CCHS respondents living outside of CMAs and CAs, and included variables at the level of census subdivision. Three respondents who lived in CSDs without socioeconomic data were excluded. A total of 2469 CSDs were included, out of a total of 4505 non-metropolitan CSDs on the 2001 Census. As with the first set of models, examination started with the amount of variation among rural areas. Then it was explored whether this could be explained by the composition of the population in different areas, adding age and sex, and then all individual variables. Finally, the role of contextual factors was explored by including all individual and area-level variables.
On a simple descriptive level, a relationship between health and rurality was confirmed, with a gradient observed in bivariate tabulations of MIZ and HUI and in models unadjusted for age and sex (Tables 1,2). Respondents in areas of weaker metropolitan influence and the territories were less likely to be in good health than respondents in areas of stronger metropolitan influence. The territories had the lowest percent good health (74%) (Table 1).
There were notable aberrations to the gradient in urban areas. Respondents in CAs had among the lowest percent good health (78%) (Table 1), and were significantly less healthy than those in CMAs (Table 2, model 1). Respondents outside of CMAs or CAs, but in areas with strong metropolitan influence, were among the healthiest. Their odds of good health were not significantly different than respondents in CMAs, a pattern which remained after adjusting for age and sex, and all individual variables (Table 2, models 2&3).
Table 1: Percent of 2001 Canadian Community Health Survey (CCHS) respondents
with good health (Health Utilities Index ≥0.83) by degree of metropolitan influence
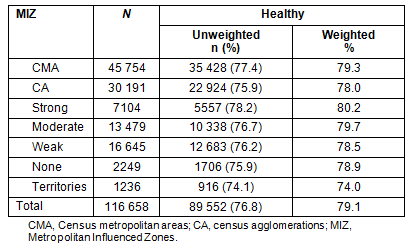
Table 2: Odds of Health Utilities Index (HUI) score indicative of good health (HUI ≥0.83)
and 95% CIs for all eligible Canadian Community Health Survey (CCHS) respondents
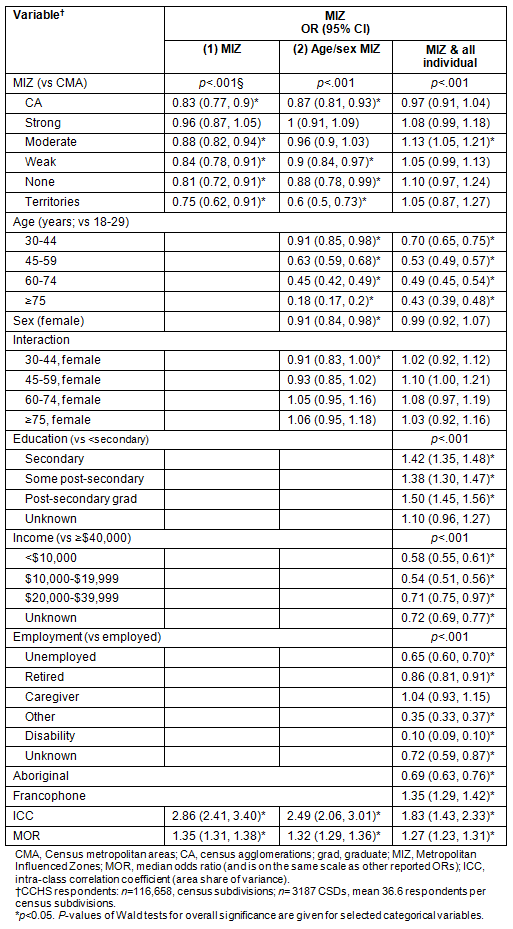
It was found that the composition of areas with respect to a range of individual variables helped explain differences in health by MIZ. In a model including all individual variables, the gradient in health by MIZ disappeared (Table 2, model 3), and nearly all of the odds ratios for MIZ were close to one. The exception was for respondents in areas with moderate MIZ who, after adjustment, had 13% higher odds of being in good health than respondents in CMAs. Having higher education, higher income, being employed, not identifying as aboriginal, and identifying as francophone were associated with higher odds of good health.
Models indicate substantial between-area heterogeneity in health, and CSD area effects are large relative to the effects of MIZ. For example, in Model 1 of Table 2, the ICC of 2.86 indicates that the percent of variance explained by between-CSD variations in health is 2.86%. This may seem small, but as indicated by the MOR its effect size is large relative to the effect sizes of the MIZ variable. The estimated MOR of 1.35 (or its inverse: 0.74) is large relative to the significant relative odds for MIZ, which range from 0.75 for the Territories to 0.88 for moderate MIZ. In other words, the median effect on the odds of having good health from moving between CSDs is larger than the effect of moving between from a CMA to an area in another MIZ level. Adjustments for age, sex, and other individual-level variables (Models 2 & 3, Table 2) reduce the MOR from 1.35 to 1.27, but it remains significant. Moreover, in the adjusted model (Model 3) the effect size of between-area effects are in the midrange of effect sizes observed for individual variables. The effects of MIZ, on the other hand, become insignificant or reverse in sign.
Stratifying by the level of MIZ (Table 3) shows that heterogeneity in health between CSDs is substantial across the urban-rural continuum. In unadjusted models (Table 3, top panel), MORs are significant and greater than 1.3 for all levels of MIZ. Although the confidence intervals are large, MORs exceed 1.5 in the territories and areas with no MIZ. Even after adjustment for age, sex and individual level variables, MORs remain significant for each level of MIZ.
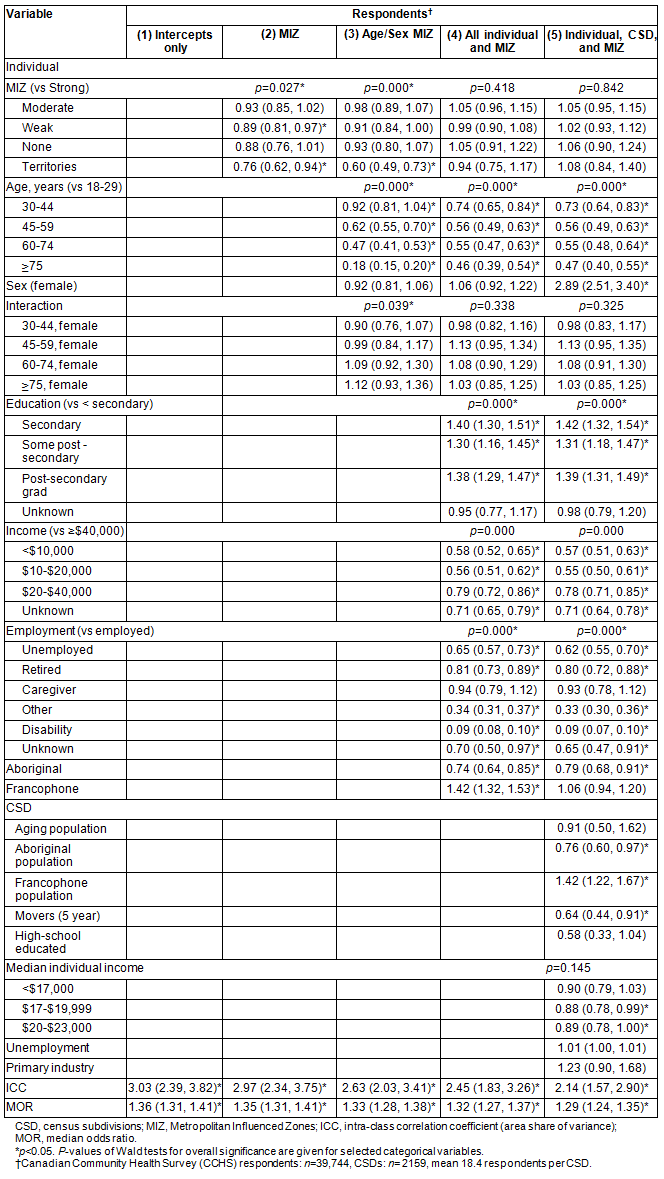
Separate analyses for rural areas alone (Tables 4,5) further reinforce results on the extent of between-area heterogeneity, After the inclusion of CSD-level variables thought to be important in determining community health, the ICC and MOR are only slightly attenuated (2.45 to 2.14, and 1.32 to 1.29 respectively).
In rural areas alone, the compositional characteristics of individuals are important to understanding health (Table 5), and show consistent relationships with those in multivariate analysis the entire study sample (Table 2). At area-level, lower percent Aboriginal and higher percent Francophone were associated with higher odds of good health (Table 4, model 4). After controlling for individual age, the proportion of residents over 65 years was not significant, but a higher percentage of movers within the past 5 years was associated with lower odds of good health. Having controlled for individual income, education and employment, these variables were not significant (or only marginally) at area level. Percent employed in primary industry was not associated with odds of good health. Heterogeneity remains apparent in all models of rural respondents (Table 5), though ICC and MOR decline in each successive model, from 3.03% (CI: 2.39, 3.82) for intercepts only, to 2.14% (CI: 1.57, 2.90) in Model 5.
Table 3: Odds of having a Health Utilities Index (HUI) score indicative of good health (HUI ≥0.83) and 95% CIs by category of Metropolitan Influenced Zone
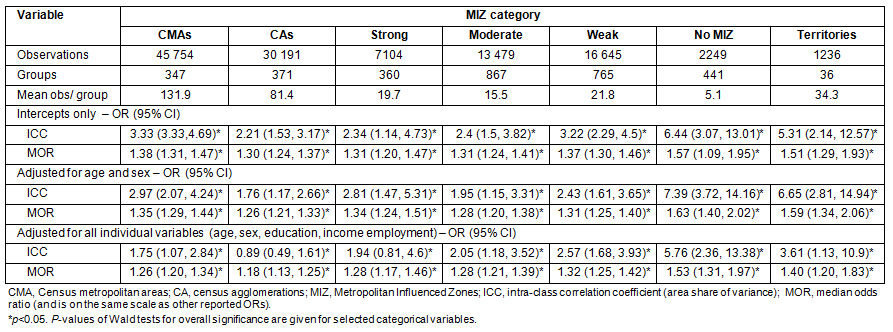
Table 4: Number and percent (unweighted and weighted) of rural respondents with a Health Utilities Index (HUI)
indicative of good health (HUI ≥0.83) and total non-metropolitan sample, by individual variables
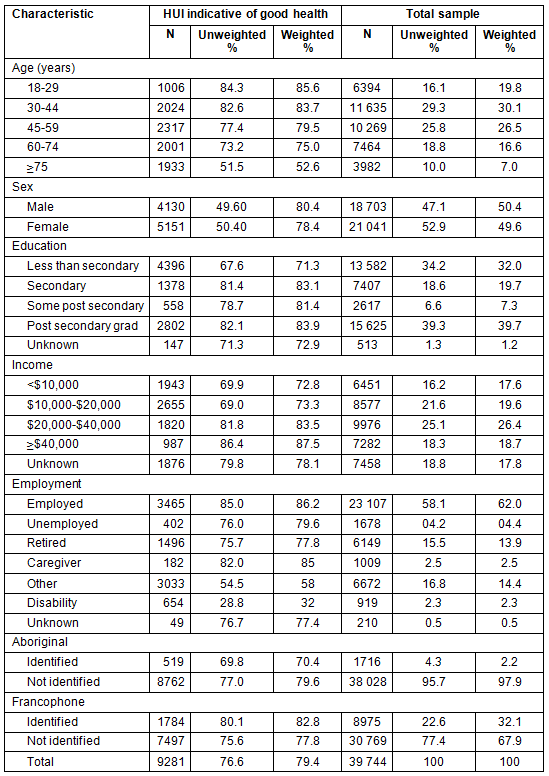
Table 5: Odds of an Health Utilities Index (HUI) score indicative of good health
(HUI ≥0.83) and 95% confidence intervals for all rural respondents
Much has been made in the literature about the effects of rurality on health1,3,5,7. This study shows that rural areas are highly heterogeneous in terms of health, suggesting that rural health research needs to shift focus from rurality as a determinant of health, to the determinants of health within and between rural areas. A better understanding is needed of what it is that makes some rural areas healthy and other not.
While previous results were confirmed that health is associated with metropolitan influence, these effects are small, especially when compared to the substantial heterogeneity in health between rural areas. The size of estimated effects for MIZ was also generally small compared with other individual and area variables. There was no significant difference between areas of strong MIZ and metropolitan areas in any model. In fact, these urban fringe areas had higher odds of good health than CAs, a finding consistent with previous studies of mortality and premature illness35,36. A study in the US found that residents of 'large fringe' counties (adjacent to large metropolitan areas but not including the central city) were better off than any other counties, and also found better health in big rather than small cities37. These findings also prompt consideration of what remoteness might mean in the context of health, and what size of city is relevant for health-supporting resources. Many CAs are actually more remote from metropolitan centers (possible including access to acute care facilities and specialists) than areas of strong MIZ.
The composition of rural areas is clearly important to understand patterns in health. In both the models of all CCHS respondents and rural areas alone, individual variables together render differences in health by MIZ null. At the area level, percent Aboriginal population, Francophone population, and movers, which also reflect area composition, showed the largest effects. It should be noted, however, that the objective of this analysis was not to produce unbiased effect estimates of individual and area-level covariates on health, and the resulting coefficients have limited interpretability. For example, the observed effect of Francophone population may reflect differences between Quebec and other provinces. The effect of having a large Francophone population, outside of Quebec, likely differs. Future work should explore more fully the how the effect of Francophone population on the health of rural areas varies depending on region and context.
Similarly, an earlier study found that self-reported health status varies among the 136 health regions in Canada, but when accounting for characteristics of the individuals residing within these regions, there little remaining variation to be 'explained' by regional socioeconomic characteristics38. As with the current research, much of the variation was explained in models by the composition of each health region, rather than variables explicitly measuring context39. This is also consistent with recent research which found that the magnitude of inequalities in survival in rural areas was greater when deprivation was measured at the level of individuals rather than areas9.
It was observed that between-area heterogeneity in health is substantial. Indeed, across all models, the median effect on health from moving from one rural census subdivisions to another is greater than the effect of moving from a metropolitan to a rural area, or of moving between levels of rurality. Individual income, education, and employment, and area characteristics such as Francophone or Aboriginal populations, and migration patterns account for some of this between-area heterogeneity, but considerable variation remains.
The results from this study indicate that rural health research focusing on urban versus rural disparities, or even continuum-based measures of rurality like MIZ, may be less informative than finding ways to classify and examine different types of rural areas according to factors relevant to health. Macintyre et al. caution that 'place' is sometimes treated as 'an unspecified black box of somewhat mystical influences on health that remain after investigators have controlled for a range of factors'16. In the case of health research, the designation 'rural' may also be treated as such a black box, as measures of rurality may be included in analysis as proxies for a range of related factors, without effort to theorize the pathways through which the characteristics of heterogeneous rural areas influence health. To move forward, there is a need for richer comparisons among rural communities, to uncover why some are healthier than others.
Acknowledgment
Ruth Lavergne was supported by Student Award PSO SRA 2007 3664 from the Nova Scotia Health Research Foundation.
References
1. Pong RW, DesMeules M, Lagacé C. Rural-Urban disparities in health: how does Canada fare and how does Canada compare with Australia? Australian Journal of Rural Health 2009; 17(1): 58-64.
2. Pampalon R, Lebel A, Hamel D. Exploring rural health inequalities at a local scale: the case of Portneuf, Queebec. Canadian Journal of Public Health 2007; 98(2): 143-148.
3. DesMeules M, Pong R, Lagace C, Heng D, Manuel DG, Pitblado JR et al. Canadian Population Health Initiative. How healthy are rural Canadians? An assessment of their health status and health determinants. Ottawa: Canadian Institute for Health Information, 2006.
4. Pampalon R, Martinez J, Hamel D. Does living in rural areas make a difference for health in Quebec? Health & Place 2006; 12(4): 421-435.
5. Mitura V, Bollman R. Health status and behaviours of Canada's youth: a rural-urban comparison. Rural and Small Town Canada Analysis Bulletin 2004; 5(3): 1-22.
6. Nagarajan KV. Rural and remote community health care in Canada: beyond the Kirby Panel Report, the Romanow Report and the federal budget of 2003. Canadian Journal of Rural Medicine 2004; 9(4): 245-251.
7. Mitura V, Bollman RD. The health of rural Canadians: a rural-urban comparison of health indicators. Rural and Small Town Canada Analysis Bulletin 2003; 4(6): 1-23.
8. Pampalon R. Health discrepancies in rural areas in Quebec. Social Science & Medicine 1991; 33(4): 355-360.
9. Pampalon R, Hamel D, Gamache P. Health inequalities in urban and rural Canada: comparing inequalities in survival according to an individual and area-based deprivation index. Health & Place 2010; 16(2): 416-420.
10. Bollman R, Beshiri R. Demographics, Employment, income, and networks: differential characteristics of rural populations. Journal of Agromedicine 2009; 14: 132-141.
11. Southcott C. Spatial based social differentiation in Canada's future: trends in urban/non-urban differences in the next decade. In: LD Juteau (Ed.). Social differentiation: patterns and processes. Toronto: University of Toronto Press, 2003; 205-252.
12. Bryant C, Joseph AE. Canada's rural population: trends in space and implications in place. Canadian Geographer 2001; 45(1): 132-137.
13. Smith KB, Humphreys JS, Wilson MG. Addressing the health disadvantage of rural populations: how does epidemiological evidence inform rural health policies and research? Australian Journal of Rural Health 2008; 16(2): 56-66.
14. Leight SB. The application of a vulnerable populations conceptual model to rural health. Public Health Nursing 2003; 20(6): 440-448.
15. Probst JC, Moore CG, Glover SH, Samuels ME. Person and place: the compounding effects of race/ethnicity and rurality on health. American Journal of Public Health 2004; 94(10): 1695-1703.
16. Macintyre S, Ellaway A, Cummins S. Place effects on health: how can we conceptualise, operationalise and measure them? Social Science & Medicine 2002; 55(1): 125-139.
17. Wilkins R. PCCF+ Version 4G User's Guide. Automated geographic coding based on the statistics postal code conversion files. Cat no. #82F0086-XDB. Ottawa: Statistics Canada, 2006.
18. Gonthier D, Hotton T, Cook C, Wilkins R. Merging area-level census data with survey data in Statistics Canada Research Data Centres. Statistics Canada Information and Technical Bulletin 2006; 3(1): 21-39.
19. Horsman J, Furlong W, Feeny D, Torrence G. The Health Utilities Index (HUI): concepts, measurement properties and applications. Health and Quality of Life Outcomes 2003; 1: 54.
20. Feeny D, Furlong W, Torrance GW, Goldsmith CH, Zhu Z, DePauw S et al. Multiattribute and single-attribute utility functions for the Health Utilities Index Mark 3 system. Medical Care 2002; 40(2): 113-128.
21. Furlong WJ, Feeny DH, Torrance GW, Barr RD. The Health Utilities Index (HUI) system for assessing health-related quality of life in clinical studies. Annals of Medicine 2001; 33(5): 375-384.
22. Shmueli A. Reporting heterogeneity in the measurement of health and health-related Quality of Life. Pharmacoeconomics 2002; 20(6): 405-412.
23. Kopec JA, Williams JI, To T, Austin PC. Cross-cultural comparisons of health status in Canada using the Health Utilities Index. Ethnicity & Health 2001; 6(1): 41-50.
24. Kopec JA, Williams JI, To T, Austin PC. Measuring population health: correlates of the health utilities index among English and French Canadians. Canadian Journal of Public Health 2000; 91(6): 465-470.
25. Tempier R, Pawliuk N. Measuring patient quality of life: is the health utility index useful? Psychiatric Quarterly 2007; 78(1): 53-62.
26. Vozoris NT, Tarasuk VS. Household food insufficiency is associated with poorer health. Journal of Nutrition 2003; 133(1): 120-126.
27. du Plessis V, Beshiri R, Bollman R, Clemenson H. Definitions of rural. Rural and Small Town Canada Analysis Bulletin 2001; 3(3): 2-16.
28. Pong RW, Pitblado JR, Irvine A. A strategy for developing environmental health indicators for rural Canada. Canadian Journal of Public Health 2002; 93(Suppl1): S52-56.
29. McNiven C, Puderer H, Janes D. Census Metropolitan Area and Census Agglomeration Influenced Zones (MIZ): a description of the methodology. Cat no. 92F0138MIE2000002. Ottawa: Statistics Canada, 2000.
30. Statistics Canada. 2001 Census Public Use Microdata File, Individuals File User Documentation. Cat no. #95M0015XCB. Ottawa: Statistics Canada, 2001.
31. Clapp RA. The resource cycle in forestry and fishing. Canadian Geographer 1998; 42(2): 129-144.
32. Randall JE, Ironside RG. Communities on the edge: an economic geography of resource-dependent communities in Canada. Canadian Geographer 1996; 40(1): 17-35.
33. Merlo J, Chaix B, Ohlsson H, Beckman A, Johnell K, Hjerpe P et al. A brief conceptual tutorial of multilevel analysis in social epidemiology: using measures of clustering in multilevel logistic regression to investigate contextual phenomena. Journal of Epidemiology & Community Health 2006; 60(4): 290-297.
34. Larsen K, Merlo J. Appropriate assessment of neighborhood effects on individual health: integrating random and fixed effects in multilevel logistic regression. American Journal of Epidemiology 2005; 161(1): 81-88.
35. Lagace C, Desmeules M, Pong RW, Heng D. Non-communicable diseases and injury-related mortality in rural and urban places of residence: a comparison between Canada and Australia. Canadian Journal of Public Health 2007; 98(Suppl1): S62-69.
36. Barnett S, Roderick P, Martin D, Diamond I. A multilevel analysis of the effects of rurality and social deprivation on premature limiting long term illness. Journal of Epidemiology and Community Health 2001; 55(1): 44-51.
37. Eberhardt MS, Ingram DD, Makuk DM, Pamuk ER, Freid VM, Harper SB et al. Urban and rural health chartbook. Health, United States, 2001. Hyattsville, MD: National Center for Health Statistics, 2001.
38. Tremblay A, Ross N, Berthelot JM. Regional socio-economic context and health. Supplement to Health Reports 2002; 13: 1-12.
39. Frohlich KL, Ross N, Richmond C. Health disparities in Canada today: some evidence and a theoretical framework. Health Policy 2006; 79(2-3): 132-143.
