Background
Globesity (the global epidemic of obesity), like undernutrition at the opposite end of the malnutrition spectrum, affects virtually all age and socioeconomic groups in developed and developing countries1. As of 2008, WHO estimates that over 1.5 billion adults aged 20 years and older were overweight, with 200 million men and 300 million women obese2. Additionally, in 2010, approximately 43 million children under the age of 5 years were overweight2.
In addition, nearly 36% of United States (US) adults and 32.2% of US adults aged 20 to 39 years are obese, with obesity rates increasing annually3. At the state level, adult obesity rates in New Mexico increased from 22.9% in 2006 to 25.1% in 20104.
Proximal and distal causes of obesity involve complex iterative feedback loops, which occur locally and globally within socioecological contexts and life history5. Developing alongside undernutrition, the obesogenic niche is characterized by diverse genotypes, diets, lifestyles, nutritional patterns and disease loads6. Hallmarks of the obesogenic environment include economic globalization, the availability of affordable and well-marketed processed high caloric and high fat foods, and an increasingly sedentary lifestyles7. Obesity affiliates with a series of comorbidities, diseases such as diabetes mellitus, hypertension, cardiovascular disease, stroke and some cancers, and may also result in socially induced stress, which is a risk factor for all of these diseases/conditions8,9. Further, in many modern societies, corpulence frequently carries fat-stigmatizing beliefs; may reduce relative prestige and status; may negatively affect economic conditions; and may result in socially induced stress8,10.
Health-related factors and lifestyles have been associated with obesity and weight gain for college students. According to the American College Health Association, nearly 32% of college students are overweight or obese11. There is strong evidence that eating habits, behaviors, attitudes about physical activity and obesity, and lack of physical activity are associated with obesity for college populations12-17. Although some research exists for campus students, little is known about obesity and lifestyle factors of campus students located in rural areas serving largely rural populations.
Purpose
The purpose of this study was to examine the prevalence of overweight/obesity and elements of the obesogenic environment at a rural-serving US-Mexico border university. The 3219 km (2000 mile) long US-Mexico border region includes four US states and six Mexican states18. The border region includes communities within a 100 km distance on the north and south sides of the border running east to west between the Gulf of Mexico and the Pacific Ocean. Obesity and its comorbid diseases are among the major health issues identified for the US-Mexico border region18.
The study venue
This study was conducted at New Mexico State University (NMSU), located approximately 68 kilometers (42 miles) north of the US-Mexico Border, in Dona Ana County, New Mexico. The county is a largely rural county (97.6% geographically with 19.3% of the county's population living in rural areas) that borders El Paso County, Texas, on the east and southeast and shares over 85 km (53 miles) of border with the state of Chihuahua, Mexico, on the south. The land area of the county is approximately 9860 km2 (3807 miles2) with a population density of 142 persons per km2 (55 per mile2)19. The estimated population of the county in 2010 was 209 233, of which 44.6% claimed Hispanic or Latino origin19. The university principally draws students from a rural state where 26 of 33 full counties and 11 additional census tracts are designated as rural, including three census tracts within Dona Ana County where the university is located20. New Mexico State University was established in 1888 by the Territorial Assembly of New Mexico and was designated as the state's land-grant institution (the university designated by its state legislature or Congress to receive the benefits of the Morrill Acts, 1862 and 1890). The Office of Postsecondary Education of the US Department of Education designated NMSU a Hispanic Serving Institution (HSI) (ie it has ≥25% Hispanic undergraduate students). New Mexico State University is represented in every county in the state and serves a multicultural population through teaching, research and service21. As of 7 September 2010, the Las Cruces campus had 18 552 students (79.8% undergraduate and 20.2% graduate) and 4295 employees. Among students who designated ethnicity, 44.1% were Hispanic and 34.3% were white, non-Hispanic21. Demographic data are not currently available for NMSU employees.
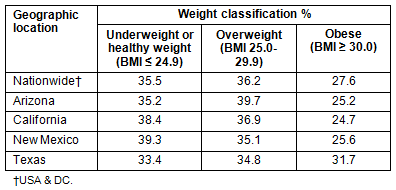
To put the state of New Mexico into national obesity context, weight classification data from the Behavioral Risk Factor Surveillance System (BRFSS) data for the nation and the four US-Mexico Border States are presented (Table 1)22. According to these data, New Mexico has the largest healthy weight and underweight population. It also has the second lowest overweight population, but the second highest obese population.
Table 1: Weight classification (%) in USA and selected states, 2010
Research protocol
A self-administered online survey was developed with 64 items. Items were developed from reviews of items used on national survey tools. A cross-sectional, convenience sample using an asynchronous electronic survey was submitted to approximately 23 000 students, faculty and staff at the main NMSU campus. All individuals with an NMSU email address were advised of survey availability by email as well as by announcements in campus online newsletters. Inclusion criteria required individuals to be 18 years and older. The survey was administered in English, the language of instruction at the university. The survey was modeled on Healthy Campus 2020 and the American College Health Association - National College Health Assessment (ACHA-NCHA) survey to collectively analyze demographics, student behaviors and assessment of health education needs. Additionally, a preliminary survey was piloted in the spring of 2011 and no changes were refined with the survey format. The survey was available online via Survey Monkey (https://www.surveymonkey.com) from 8 to 30 November 2011. Respondents were advised that they could stop the survey at any time, were given an option to skip each question and were eligible to enter a contest for local merchant gift cards upon completion of the survey.
Data analysis
Body mass index (BMI) is the international standard for measuring obesity and one indicator of potential health risks associated with overweight and obesity23. Proxy measures of nutritional status (ie self-reported (SR) anthropometric indicators) were used to calculate BMI; however, this study does not directly examine nutritional patterns. Factors analyzed include the prevalence of overweight/obesity (ie calculated BMI), reported exercise levels, and self-identified body image in the contexts of sex, age, ethnicity, role at the university (student or employee) and residence (on or off campus). Dependent variables included BMI and BMI categories (underweight; normal or healthy weight; overweight; and obese). The following represent cutoff points for defining underweight, healthy weight, overweight and obese based on the effect that body weight has on morbidity and mortality23:
- underweight = BMI of less than 18.5
- healthy weight = BMI of 18.5-24.9
- overweight = BMI of 25.0-29.9
- obese = BMI of 30.0 or more.
Independent variables included: sex, age (18-34 and ≥35 years), ethnic identity, role at the university (student or employee), residence (on or off campus), customary activity levels, body image perception and prevalence of selected diseases/disorders. Descriptive statistics included frequencies for categorical variables and means for continuous variables. Bivariate analyses were used for unadjusted analysis of impact of each sociodemographic characteristic and disease prevalence on BMI or BMI categories. A Chi-squared (χ2) test was used for categorical outcomes and ANOVA (F-test statistics) was used for continuous outcome (Tables 4,5). Multivariable linear and logistic regression analyses were used to provide covariate adjusted analysis (Tables 6,7).
Data were analyzed using Statistical Package for Social Sciences v19 (SPSS, www.spss.com). A p value of 0<0.05 was used for statistical significance.
Ethics approval
The research protocol was approved by the NMSU Institutional Review Board (IRB) for protection of the rights and welfare of human subjects - approval number IRB #483 (exempt).
A total of 4181 individuals logged onto the survey; however, 219 (5.2%) answered no more than two questions and quit the survey or were logged out of the survey because they were under 18 years of age. These responses were considered 'false starts' and eliminated from the analysis. Another 197 individuals did not report sufficient data to calculate BMI and were not included in analyses that required these data. This resulted in a loss of 9.9% of surveys attempted. Therefore, a total of 3962 completed surveys (approximately 17.2% response rate) were analyzed; however, since respondents were also given the option to skip questions, the number of valid answers varies by question.
Sociodemographic findings
Sample demographics are provided (Table 2). The sample included 67.8% females and 32.2% males. Only individuals who checked one racial/ethnic identity were counted in the ethnic group categories. Any individual who checked more than one racial/ethnic identity was placed into the biracial/multiracial count. Overall, 42.9% were White and 40.7% were Hispanic. Most (68.7%) respondents were in the younger age group (18-34 years). The majority of respondents were students, although nearly one-third represented employees of the university. A majority of respondents lived off-campus (81%).
Anthropometric findings
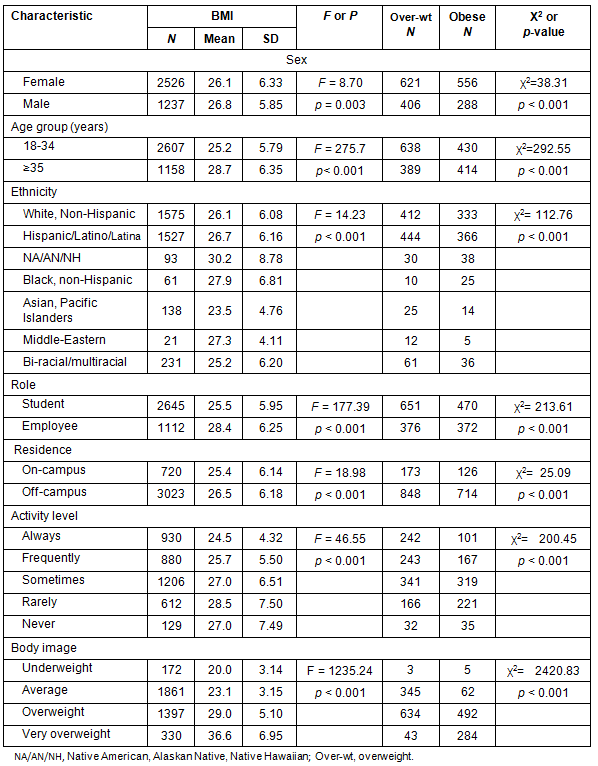
A descriptive summary of height, weight, BMI and BMI category as either obese or overweight for the survey respondents is presented (Table 3). The mean BMI in the sample is 26.3, which is above the threshold for obesity. The percentages of overweight and obese individuals totaled 47.2% of the respondents. A bivariate analysis of BMI and BMI groups (obese and overweight) by sex, age, ethnicity, role at the university, residence, activity level and body image is presented (Table 4). Each variable was found to have statistically significant differences, as shown. When BMI is analyzed by sex, there is a significant difference (p=0.003) between males and females. In the sample population, more males are overweight and obese than females. This pattern differs from state, national and international trends where males typically have more overweight, but less obesity, than females2,23. The rate of overweight and obesity significantly increased with age in this sample (p<0.001). Among participants under 35 years of age, 41% were overweight or obese and more were overweight (24.5%) than were obese (16.5%). The pattern is opposite for those ≥35 years, where more individuals were obese than were overweight, although proportions are more similar. Body mass index and overweight/obesity were significantly different among ethnic groups (p<0.001), and only Asian, Pacific Islanders (BMI=23.5) had a mean BMI below the overweight category. When comparing the two largest ethnic groups in the sample, Hispanics showed the greatest percentage of overweight/obese individuals (53.1% for Hispanics versus 47.3% for Whites). The ratio of overweight to obese individuals did not follow a consistent pattern among ethnic groups; that is, sometimes there were proportionally more overweight than obese respondents and vice versa depending on the ethnic group. Body mass index was significantly different (p<0.001) depending on the respondent's role at the university (student or employee), where employees were more overweight/obese than were students. Individuals living on campus showed less overweight and obesity than those who lived off campus (p<0.001).
Table 2: Participants' sociodemographic characteristics
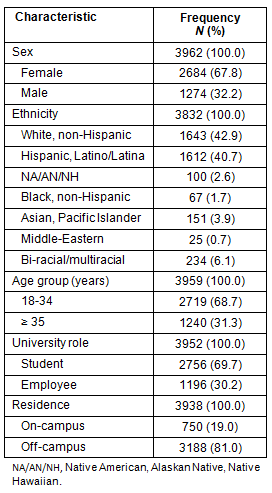
Table 3: Participants' self-reported anthropometric nutritional status

Table 4: Bivariate analysis of selected characteristics according to BMI and overweight/obesity
Sociocultural and disease associations
Respondents were asked to identify their customary activity levels with the question, 'Do you participate in recommended physical activity? (At least 30 minutes, three times a week)?'. Most respondents reported that they participated in physical activity regularly; however, mean BMI increased as reported physical activity decreased (Table 4). Younger individuals were more active than those in the older cohort (p=0.013), but this does not explain all of the differences found.
To address body image, respondents were asked, 'How do you perceive your weight?'. Results were mixed, but perceived weight was significantly different from BMI (p<0.001). Although only a few overweight/obese individuals viewed themselves as underweight, 22.7% overweight/obese individuals perceived their weight to be average. In fact, overweight respondents saw themselves as average much more often than as obese. Concurrently, obese individuals also typically underestimated corpulence (Table 4). These results suggest that the perception of overweight and obese may be higher than defined by anthropometric measurements among the scientific community.
Interpreting results of the question, 'In the last 12 months have you been treated for the following' diseases or conditions is limited because: (i) there were small numbers of 'yes' responses in the sample and (ii) potential overlaps exist where respondents may have selected more than one condition or disease. However, data are reported for each disease/condition as though it was independent even though there may be some overlap (ie a synergistic or syndemic relationship, which may not be ascertainable from these data). No significant relationship to BMI categories was found with the following diseases among participants: asthma, cancer, chronic obstructive pulmonary disorder and heart disease. Diseases/conditions that were found to be significantly associated with BMI categories are listed (Table 5).
Regression analysis
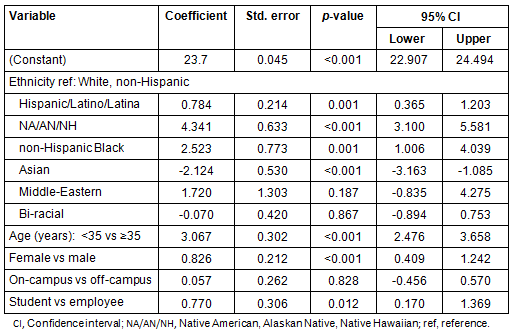
Body mass index as a continuous variable was analyzed using multiple regression analysis adjusted for age, sex, ethnicity, role and residence. The results demonstrate that White participants had lower BMI compared to Hispanics (by 0.78 kg/m2, p=0.001), NA/AN/NH (by 4.34 kg/m2, p<0.001) and non-Hispanic Blacks (by 2.52 kg/m2, p=0.001), whereas Whites had significantly higher BMI than Asian/Pacific Islanders (by 2.12 kg/m2, p<0.001) (Table 6). Body mass index was not significantly different between Whites and Middle Easterners or the biracial participants (p>0.18). The findings show that older participants had significantly higher BMI compared to younger ones (age<35) (more than 3 kg/m2, p<0.001), male participants had about a 0.83 kg/m2 higher BMI than did female participants (p<0.001) and employees had a 0.77 kg/m2 higher BMI than did student participants (p<0.012). After adjusting for ethnicity, age, sex and role there was not a significant difference in BMI between the participants living on-campus and those living off-campus.
Table 5: Diseases significantly related to BMI category
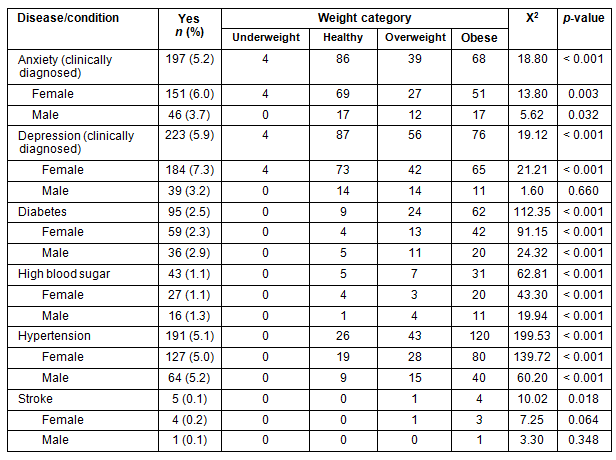
Table 6: Multivariable regression analysis of BMI
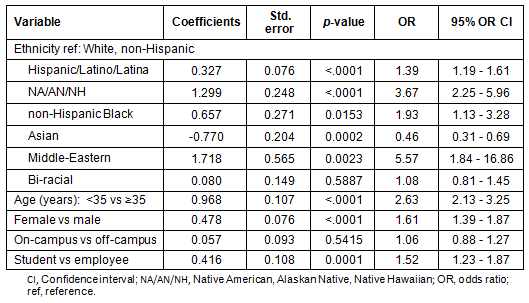
The impact of covariates on the probability of being obese/overweight as compared to being normal/underweight was analyzed. Odds ratios and the corresponding confidence intervals are shown (Table 7). The result of this analysis is very similar to what was found in multiple linear regressions. Compared to Whites, the odds of being overweight was 1.39 times higher for Hispanics, approximately 3.67 times higher for NA/AN/NH, 1.93 times higher for non-Hispanic blacks and 5.57 times higher for Middle Easterners. On the contrary, Asians were 0.46 times less likely to be overweight compared to whites, whereas biracial individuals were equally likely to be obese as whites. Age is another factor which showed significant influence on the odds of being obese. Odds were 2.63 times higher for individuals ≥35 years compared to the younger population. In addition, being overweight also depended on sex and the role of individuals; the odds for males were about 1.61 times higher and for employees the odds were 1.52 times higher. As in the previous analysis, living arrangement did not show a significant impact after accounting for other factors.
Table 7: Odds of being obese or overweight binary logistic regression results
Discussion
Solutions to the world's overweight and obesity epidemic are not simple, nor are the factors affecting overweight and obesity. It appears that human societies were concerned with weight and nutrition from ancient times; however, in some times and places overweight/obesity was favored, whereas at others it was not preferred. Historically, the interaction of food, obesity and health extends back to humans' most ancient ancestors living in times when having a big baby with excess adipose tissue may have meant survival from hypothermia24. In fact, the origins of obesity can be traced back to at least 30 000 years ago when human ancestors carried statuettes, such as the Venus of Willendorf, which depicted an abdominally obese woman25. Also, historical writings show that Ancient Egyptians purged regularly for health reasons, Moses recommended dietary laws and Galen reduced an obese man by making him run until he sweated profusely, after which he gave him food that afforded little nourishment25.
Defining overweight and obesity is problematic, though current trends use WHO rankings as the preferred BMI standard. Body mass index does not measure fat, but correlates with it. It is not independent of stature and reflects body proportions, specifically the relationship between sitting height and standing height26. In other words, individuals with short legs will have higher BMIs than will proportionally longer legged individuals of the same height. BMI is equally inaccurate for individuals such as athletes because BMI is influenced almost equally by lean and fat components23,26. Previous studies have shown that percentages of lean body mass and fat affect teenage blood pressures27-30.
It has long been recognized that obesity has genetic as well as sociocultural and behavioral components, though exactly what role genetics plays is complicated and provides no clear path to understanding the phenomenon. For example, biologists and geneticists have proposed several mechanisms to explain the genetic/physiological basis of obesity, including: the 'thrifty gene'22,31-33; the 'drifty' gene (a selectively neutral gene) based in the predation release hypothesis34; the identification of a gene that may play a key role in human adipogenesis35; and human adaptation to various environmental factors36-41. Embedded in each of these genetic explanations are selective adaptations that result in sexual dimorphism in human stature, physique, adiposity and ecological variants.
Scientific ideas of good nutrition and healthy weight are also frequently complicated by sociocultural determinants of health such as economics, stress, acculturation and education, to name a few. Further, cultural ideas of beauty, normal body shapes and ideal weights play a part in the sociocultural determinants of perceived obesity. This study used self-reported BMI as the measure of obesity. Though BMI (measured or self-reported) is fraught with limitations, it is the standard used worldwide to measure overweight/obesity and serves as a risk factor for hypertension, diabetes and other chronic diseases26. As this study shows, scientific ideas of obesity as measured by BMI do not necessarily correlate with human perceptions of body image. Many participants in the study did not perceive themselves as overweight or obese, though by current scientific standards they were clearly outside the healthy weight range. These results may indicate that cultural values of acceptable or ideal weight and figure may not fit with scientific dictums of the phenomena. Ruth Benedict commented many years ago on the institution of the fatting-house for girls in central Africa: 'In the region where feminine beauty is all but identified with obesity, the girl at puberty is segregated, sometimes for years, fed with sweet and fatty foods, allowed no activity, and her body rubbed assiduously with oils. She is taught during this time her future duties, and her seclusion ends with a parade of her corpulence that is followed by her marriage to her proud bridegroom'42. Although young girls may no longer have to go to fatting-houses and attitudes towards body size preferences may have changed with time, future studies should look more closely at culturally acceptable ideas of weight and corpulence at all ages to facilitate scientific efforts to reduce overweight and obesity in populations worldwide.
Results of this study suggest that sociocultural, physiological and genetic factors were interacting across the population studied at NMSU, which affected the level of overweight and obesity among study participants. Within the group studied, BMI was significantly different for each of the demographic characteristics measured. However, when age, sex and ethnicity were controlled, there was no difference between the role of student and that of employee. This suggests that the differences seen in these demographic characteristics may have been due to students being younger and more active than employees. Most respondents reported they were physically active, though activity levels decreased with increasing obesity. The data collected do not allow analysis to determine if obesity followed the inactivity or inactivity followed the obesity or at what age obesity began. However, these results suggest strongly that the prevalence of overweight and obesity are likely to increase as this young population ages.
It is perplexing to find that respondents tended to underestimate their BMI category when asked about body image. If one assumes that self-reported BMI is likely to be lower than BMI calculated from measurements (as shown in other studies), then the potential future obesity problem and subsequent disease synergistic is multiplied. Perhaps a larger, more obese expectation of what constitutes average or normal body size had become enculturated within the study participants. However, it may be that, for example, comparing oneself to very underweight individuals (such as portrayed in fashion magazines or in the media) created stressors that contributed to the levels of anxiety and depression seen in this population. Alternatively, it may simply be that the university experience was a stressful one. In any case, the role of stress in obesity needs further examination. The results also show that several major diseases associated with an obesogenic environment were already present in the population, though the numbers were small. This result suggests that the population represented by this sample may experience increasing prevalence of diseases associated with obesity observed in other populations.
Clearly, the concept of overweight/obesity has changed with time and from culture to culture43-48. Further, standards for measuring overweight/obesity change periodically29. The issue of overweight/obesity is complex since corpulence is syndromic and frequently presents as a syndemic paradigm (ie 'a complex and widespread phenomenon in population health produced by multiple reinforcing conditions') consisting of multiple comorbid events)49. Obesity is a principle coconspirator in diabetes, hypertension, dyslipidemia and/or metabolic syndrome49. Conjoined with these factors, one often finds numerous stressors such as low socioeconomic status, rurality, lack of sleep, work habits, acculturation, food deserts, low medical literacy, costs of medications, immigration, stigmatization and social inequality6,10,50-53. Participants in this study showed significant levels of anxiety and depression, common stress disorders. It is possible that sources of anxiety and depression were not related to overweight/obesity in the participants; however, it is apparent that the conditions are conjoined even among this relatively young group of participants.
It is beyond the scope of this research to address the complete range of conjoined factors associated with overweight/obesity discussed in the literature (eg fetal and maternal health, stress, the thrifty genotype, acculturation, immigration, globalization and the nutritional transition). However, what is clear from this study is that self-reported obesity, defined using BMI standards, was prevalent in the university environment studied. Further, it is multi-faceted, with no one demographic or sociocultural predictor responsible for the large variability in the sample.
Limitations of the study
One limitation of the study is the use of SR height and weight for calculating BMI. Numerous studies that have addressed this issue by comparing SR data with measurements have found SR data to underestimate actual anthropometric measurements of weight, thus using SR may underestimate the true number of overweight and obese individuals in the population54-62. Since the rates of overweight and obesity in the study group are lower than those reported for the state (also self-reported data), results of this study may underestimate the real prevalence of overweight/obesity in the university population. It is also possible that study participants were younger and more active than the BRFSS sample population for the state. The proportion of females to males was similar to, but not proportional to, campus-wide counts where females were 55% and males were 45% of the student population. Ethnicity data are not strictly comparable to university or census data because only individuals who checked one race/ethnic identity were counted in the group categories. Also, employees responded to the survey in greater proportions than exist in the university population. Generalizability of the results of this study to other populations may be limited by the use of a convenience sample. It should also be mentioned that including other sociocultural determinants of health such as socioeconomic status, daily activity logs, eating patterns, nation of birth, birth weight and dietary diaries would have added significantly to the depth of this study.
Practices that use only the 'food and exercise in/out' model of weight gain have not worked in other populations and are unlikely to work in this population8,52,63. Although, as noted by Brown, 'human predispositions to fatness and obesity are best understood in the context of cultural and biological evolution', adaptive strategies of the past play a role in the etiology of adult obesity today and can be found in the social structure, cultural beliefs about food and body size, the economy and the mode of reproduction48. As argued in 1943 by Margaret Mead, efforts to change food habits are not likely to be successful when authoritarian approaches that invoke moral elements are used45.
Addressing the issue of overweight/obesity is complex. Overweight/obesity frequently presents as a symptom in a syndromic consisting of multiple comorbid events. This observation is complicated by the fact that overweight/obesity commonly fits into a syndemic paradigm with complex associations among genetic, physiological and sociocultural etiological factors. No one demographic or socioecological factor appeared to have a predominant role in predicting obesity in the participants studied at this rural university. It is concluded that levels of overweight and obesity are multifactorial and should be addressed with more holistic actions. These findings suggest that future studies should look more closely at stressors in the environment as well as culturally acceptable versus ideal notions of weight and corpulence. Study findings also suggest that early intervention will be critical to reducing levels of overweight/obesity and associated complications as the population ages. Finally, this study provides evidence for health educators and policy makers to go beyond exercise and calories in/out to develop educational materials that can cross many barriers of culture, age, ethnicity, educational level, residence and body image.
Acknowledgments
The authors thank the Department of Public Health Sciences and the Campus Health Center at New Mexico State University for their partnership in conducting the study.
References
1. World Health Organization. Controlling the global obesity epidemic. Geneva: WHO (Online) 2012. Available: http://www.who.int/nutrition/topics/obesity/en/index.html (Accessed 2 April 2012).
2. World Health Organization. Obesity and overweight. Geneva: WHO (Online) 2011. Available: http://www.who.int/mediacentre/factsheets/fs311/en (Accessed 13 June 2012).
3. Ogden CL, Carroll MD, Kit BK, Flegal KM. Prevalence of Obesity in the United States, 2009-2010. US Department of Health and Human Services, Centers for Disease Control and Prevention, National Center for Health Statistics. 2012.
4. New Mexico Department of Health. The New Mexico Plan to Promote Healthier Weight: 2006-2015. Santa Fe, NM: New Mexico Department of Health, no date; 104.
5. Brewis AA. Obesity and human biology: toward a global perspective. American Journal of Human Biology 2012; 24(3): 258-260.
6. Wells JCK. Obesity as malnutrition: the role of capitalism in the obesity global epidemic. American Journal of Human Biology 2012; 24(3): 261-276.
7. Swinburn BA, Sacks G, Hall KD, McPherson K, Finegood DT, Moodie ML et al. The global obesity pandemic: shaped by global drivers and local environments. The Lancet 2011; 378(9793): 804-814.
8. Brewis AA, Wutich A. Explicit versus implicit fat-stigma. American Journal of Human Biology 2012; 24(3): 332-338.
9. Ely J, Zavaskis T, Wilson SL. Diabetes and stress: an anthropological review for study of modernizing populations in the US-Mexico border region. Rural and Remote Health 11: 1758. (Online) 2011. Available: www.rrh.org.au (Accessed 5 November 2012).
10. Brewis AA, Wutich A, Falletta-Cowden A, Rodriguez-Soto I. Body norms and fat stigma in global perspective. Current Anthropology 2011; 52(2): 269-276.
11. American College Health Association. American College Health Association-National College Health Assessment II: Reference Group Executive Summary. ACHA-NCHA: Hanover, MD, 2012.
12. Magoc D, Tomaka J, Thompson S. Overweight, obesity and strong attitudes: predicting participation in physical activity in a predominantly Hispanic college population. Health Education Journal 2010; 69(4): 427-438.
13. Perusse-Lachance E, Tremblay A, Drapeau V. Lifestyle factors and other health measures in a Canadian university community. Applied Physiology, Nutrition, and Metabolism 2010; 35(4): 498-506.
14. Tremblay A, Pérusse-Lachance É, Brassard P. Impact of 'noncaloric' activity-related factors on the predisposition to obesity in children. Risk Management and Healthcare Policy 2010; 3: 27-32.
15. Pedersen PJ, Ketcham PL. Exploring the climate for overweight and obese students in a student health setting. Journal of American College Health 2009; 57(4): 465-480.
16. Boyle JR, LaRose NR. Personal beliefs, the environment and college students' exercise and eating behaviors. American Journal of Health Studies 2009; 23(4): 195-200.
17. Smith ML, Dickerson JB, Sosa ET, McKyer J, Lisako E, Ory MG. College students' perceived disease risk versus actual prevalence rates. American Journal of Health Behavior 2012; 36(1): 96-106.
18. United States-Mexico Border Health Commission. Healthy border 2010: an agenda for improving health on the United States-Mexico border. El Paso, TX: United States-Border Health Commission, 2003.
19. US Census Bureau. State and county quick facts: Dona Ana County, NM. (Online) 2012. Available: http://quickfacts.census.gov/qfd/states/35000.html (Accessed 20 April 2012).
20. Health Resources and Services Administration. List of rural counties and designated eligible census tracts in metropolitan counties. Rockville, MD: US Department of Health and Human Services, 2005; 1-54.
21. New Mexico State University. Quick facts 2010-2011. Las Cruces, NM: New Mexico State University, 2011 (Online) no date. Available: http://irpoa.nmsu.edu/QuickFacts/Quick_Facts-12-15-10.pdf (Accessed 5 November 2012).
22. Neel JV. Diabetes mellitus: a 'thrifty' genotype rendered detrimental by 'progress'? American Journal of Human Genetics 1962; 14(4): 353-362.
23. Centers for Disease Control and Prevention. Defining overweight and obesity. (Online) 2010. Available: http://www.cdc.gov/obesity/defining.html (Accessed 3 January 2012).
24. Pawlowski B. Why are human newborns so big and fat? Human Evolution 1998; 13(1): 65-72.
25. Haslam D. Obesity: a medical history. Obesity Reviews 2007; 8: 31-36.
26. Garn SM, Leonard WR, Hawthorne VM. Three limitations of the body mass index. The American Journal of Clinical Nutrition 1986; 44(6): 996-997.
27. Wilson S, Gaffney F, Laird W, Fixler D. Body size, composition, and fitness in adolescents with elevated blood pressures. Hypertension 1985; 7(3): 417-422.
28. Fixler D, Laird W, Browne R, Fitzgerald V, Wilson S, Vance R. Response of hypertensive adolescents to dynamic and isometric exercise stress. Pediatrics 1979; 64(5): 579-583.
29. Al-Sendi A, Shetty P, Musaiger A. Prevalence of overweight and obesity among Bahraini adolescents: a comparison between three different sets of criteria. European Journal of Clinical Nutrition 2003; 57(3): 471-474.
30. Al-Sendi AM, Shetty P, Musaiger AO, Myatt M. Relationship between body composition and blood pressure in Bahraini adolescents. British Journal of Nutrition 2003; 90(4): 837-844.
31. Neel JV. Are genetic factors involved in racial and ethnic differences in late-life health? In: LG Martin, BJ Soldo (Eds); Racial and ethnic differences in the health of older Americans. Washington DC: The National Academies Press, 1997; 210-232.
32. King R, Roglic G. Diabetes and the "thrifty gene": Commentary. Bulletin of the World Health Organization 1999; 77(8): 694-703.
33. Eaton SB, Strassman BI, Nesse RM, Neel JV, Ewald PW, Williams GC et al. Evolutionary health promotion. Preventive Medicine 2002; 34(2): 109-118.
34. Speakman J. Thrifty genes for obesity, an attractive but flawed idea, and an alternative perspective: the 'drifty gene' hypothesis. International Journal of Obesity 2008; 32(11): 1611-1617.
35. Auwerx J. PPARγ, the ultimate thrifty gene. Diabetologia 1999; 42(9): 1033-1049.
36. Baker PT. Human adaptation to high altitude. Science 1969; 163(3872): 1149-1156.
37. Frisancho AR. Human adaptation and accommodation. Ann Arbor, MI: The University of Michigan Press, 1993.
38. Pritchard JK, Pickrell JK, Coop G. The genetics of human adaptation: hard sweeps, soft sweeps, and polygenic adaptation. Current Biology 2010; 20(4): R208-R215.
39. Beall CM, Decker MJ, Brittenham GM, Kushner I, Gebremedhin A, Strohl KP. An Ethiopian pattern of human adaptation to high-altitude hypoxia. Proceedings of the National Academy of Sciences 2002; 99(26): 17215-17218.
40. Beall CM. Andean, Tibetan, and Ethiopian patterns of adaptation to high-altitude hypoxia. Integrative and Comparative Biology 2006; 46(1): 18-24.
41. Smithers J, Smit B. Human adaptation to climatic variability and change. Global Environmental Change 1997; 7(2): 129-146.
42. Benedict R. Patterns of culture. Oxford: Houghton Mifflin, 1934.
43. Malinowski B. Argonauts of the South Pacific. New York: Dutton,1922.
44. Boas F. The social organization and the secret societies of the Kwakiutl Indians. New York: Elibron Classics, 1897 (reprint 2001).
45. Mead M. The factor of food habits. Annals of the American Academy of Political and Social Science 1943; 225: 136-141.
46. Powdermaker H. An anthropological approach to the problem of obesity. Bulletin of the New York Academy of Medicine 1960; 36(5): 286-295.
47. Rappaport RA. Pigs for the ancestors: ritual in the ecology of a New Guinea people, 2nd edn. New Haven, CT: Yale University Press, 2000.
48. Brown PJ. Culture and the evolution of obesity. Human Nature 1991; 2(1): 31-57.
49. Candib LM. Obesity and diabetes in vulnerable populations: reflection on proximal and distal causes. The Annals of Family Medicine 2007; 5(6): 547-556.
50. Gartin M. Food deserts and nutritional risk in Paraguay. American Journal of Human Biology 2012; 24(3): 296-301.
51. Schell LM, Gallo MV. Overweight and obesity among North American Indian infants, children, and youth. American Journal of Human Biology 2012; 24(3): 302-313.
52. Knutson KL. Does inadequate sleep play a role in vulnerability to obesity? American Journal of Human Biology 2012; 24: 361-371.
53. Dressler WW, Oths KS, Balieiro MC, Ribeiro RP, Dos Santos JE. How culture shapes the body: cultural consonance and body mass in urban Brazil. American Journal of Human Biology 2012; 24(3): 325-331.
54. Jain R. Regression models to predict corrected weight, height and obesity prevalence from self-reported data: data from BRFSS 1999-2007. International Journal of Obesity 2010; 34(11): 1655-1664.
55. Gorber SC, Tremblay M, Moher D, Gorber B. A comparison of direct vs. self?report measures for assessing height, weight and body mass index: a systematic review. Obesity Reviews 2007; 8(4): 307-326.
56. Kuskowska-Wolk A, Karlsson P, Stolt M, Rössner S. The predictive validity of body mass index based on self-reported weight and height. International Journal of Obesity 1989; 13(4): 441-453.
57. Strauss RS. Comparison of measured and self-reported weight and height in a cross-sectional sample of young adolescents. International Journal of Obesity 1999; 23(8): 904-908.
58. Gillum RF, Sempos CT. Ethnic variation in validity of classification of overweight and obesity using self-reported weight and height in American women and men: the Third National Health and Nutrition Examination Survey. Nutrition Journal 2005; 4: 27.
59. Flood V, Webb K, Lazarus R, Pang G. Use of self?report to monitor overweight and obesity in populations: some issues for consideration. Australian and New Zealand Journal of Public Health 2000; 24(1): 96-99.
60. Fillenbaum GG, Kuchibhatla MN, Whitson HE, Batch BC, Svetkey LP, Pieper CF et al. Accuracy of self-reported height and weight in a community-based sample of older African Americans and whites. The Journals of Gerontology Series A: Biological Sciences and Medical Sciences 2010; 65(10): 1123-1129.
61. Stommel M, Schoenborn C. Accuracy and usefulness of BMI measures based on self-reported weight and height: findings from the NHANES & NHIS 2001-2006. BMC Public Health 2009; 9: 421.
62. Nyholm M, Gullberg B, Merlo J, Lundqvist-Persson C, Råstam L, Lindblad U. The validity of obesity based on self-reported weight and height: implications for population studies. Obesity 2007; 15(1): 197-208.
63. Knutson KL, Van Cauter E. Associations between sleep loss and increased risk of obesity and diabetes. Annals of the New York Academy of Sciences 2008; 1129(1): 287-304.

