


Considerable research has been undertaken exploring the health impact of social and physical environments. These characteristics, or health determinants, have been prominent in Canadian policy discourse since the 1970s. The Public Health Agency of Canada (PHAC) currently recognizes 12 such determinants: (i) income and social status; (ii) social support networks; (iii) education and literacy; (iv) employment/working conditions; (v) social environments; (vi) physical environments; (vii) personal health practices and coping skills; (viii) healthy child development; (ix) biology and genetic endowment; (x) health services; (xi) gender; and (xii) culture1. There are strong parallels between Canada's heath determinants and those of other developed nations. The WHO Commission on Social Determinants of Health (CSDH) recognizes a similar list, contextualized within a framework indicating interactions within and across determinants (Fig1). As such, intermediary determinants directly influence health, but are, in turn, shaped by broader factors representing socio-economic and political contexts2,3.
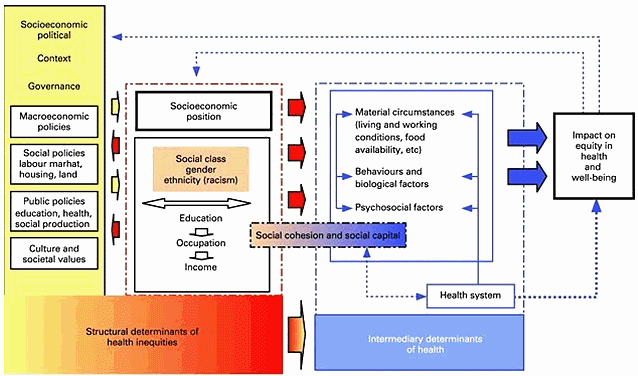 Figure 1: World Health Organization Commission on Social Determinants
of Health Framework (reproduced with permission of WHO)2
It remains unclear whether there are unique determinants underpinning rural health or whether a generic, more broadly applicable set of determinants is distributed differently in rural settings4. This uncertainty reflects the lack of rural health research, but may also result from the standard approach of comparing rural and urban populations where the many social/physical environmental differences make it difficult to pinpoint the most influential health determinants. Significant socio-demographic diversity and health status variation exists even within rural settings, suggesting that it is important to restrict the geographical unit so that internal diversity is unmasked and results can be translated into action4. An action lens has been present in health determinants discussions, with research aimed at practical, economically efficient solutions remaining a priority. As such, information on the relative importance of the determinants can be beneficial. However, most determinants research focuses on a subset of determinants, thus their relative importance is largely unknown5.
This study addresses these research problems by comparing physical health status and its determinants in two farming populations that live in the same location. This approach reduces the number of factors responsible for health differences by eliminating many shared contextual determinants common to both groups. By focusing on two rural populations, this study may also offer unique insights into the health determinants of rural communities. A comprehensive list of determinants is included in the analysis, so that their relative importance can be assessed and policy actions can be designed that focus on those having the greatest health impact.
An additional feature of this study is its focus on a unique rural population - the Old Order Mennonites (OOMs) of Waterloo, Ontario (Canada). OOMs are farmers and key features of their lifestyle include no smoking, low/no alcohol consumption, high religiosity (Christian), strong family and community support, high levels of social interaction, and minimal reliance on technology6. Health benefits have been linked to many features of their lifestyle. Moreover, the OOMs lifestyle has remained relatively stable and culturally isolated for generations. Studying isolated populations like OOMs is advantageous because distinct lifestyle practices may expose health benefits or risks (determinants) less easily identified in larger populations7,8. We hypothesize better physical health in OOMs compared to non-OOM farmers because of the health benefits of aspects of their lifestyle, such as high levels of religiosity, social capital, social support and sense of community.
OOM and rural health, social determinants of health links
The OOM community is closed with negligible in-migration, increasing the likelihood of population bottlenecks combined with genetic drift, inbreeding, and thus genetic diseases9. Genetic studies of the OOM Waterloo lineage have identified a number of physical health disorders that are relatively rare due to a surprisingly high genetic diversity9. Furthermore, Fretz10 found a broad-based discouragement of close marriages and no evidence of higher rates of mental illness in Waterloo OOMs than in the general population. The work, although dated and lacking statistical validity, is nonetheless consistent with broader genetic research on OOM mental health10.
Studies examining the health-lifestyle linkage have found that Waterloo OOM and Old Order Amish (OOA) children demonstrate higher physical fitness levels than non-OOM/OOA urban and rural children11-13. Most other (non-genetic) health information comes from US studies of OOA, and indicates differences largely in favour of Old Orders for death rate and life span14, women's mental and reproductive health15, risk of cardiovascular disease16, certain cancers17-19 and Type 2 diabetes20.
The two populations in this study live in the same region but occupy different social environments. The OOMs deliberately separate themselves from the larger society, yet within their community they are highly supportive, cohesive, trusting and spiritual10. These are features thought to contribute to better health. Beyond age, one of the most consistent findings is between poor health and low socio-economic status (SES), one that holds across many populations, diseases, and SES indicators21,22. While OOMs have comparatively low incomes, they cannot be considered low SES in the typical sense, since wealth is embedded in property and other agricultural assets. Nor does their non-participation in provincial health insurance limit access to health care services, since the OOM mutual aid program assists households unable to pay their medical bills.
Health behaviours such as smoking and physical inactivity are linked to poor health or intermediate outcomes (eg obesity), coping significantly impacts health, and life-course studies highlight the importance of healthy childhood development in fostering a lifelong advantage5,23-25. Little is known about coping in OOMs, and health behaviours appear mixed with no/low smoking and alcohol consumption offset by a potential lack of concern about diet and physical fitness (especially among OOM women). OOM families are known for being strong and stable10, providing a solid foundation for healthy childhood development.
Social support - a strong factor in OOM communities - is considered an important determinant of physical health, with studies finding higher mortality or morbidity rates among people with fewest social connections26-29. Evidence for societal-level social support is inconsistent, with some studies finding poorer health in areas of high social disadvantage30,31, and others finding better health and/or resource access32,33 . Social capital studies also explore the impact of social environments, with the main elements including social networks, participation, reciprocity and trust34. A systematic review found consistent evidence linking social capital with physical health, especially self-rated health35. Some studies suggest that societal-level social capital effects may be weak once individual-level factors are accounted for36-38.
Religiosity is one of the most prominent cultural features of OOM. Most studies focus on Jewish and Christian faiths39, with considerable evidence linking religion with physical health benefits40-42. However, reviews cite limitations including difficulties in measuring religiosity, small 'convenience' samples, treating correlation as causation, separating religious effects from non-sacred ones like social support, and inappropriate control groups43-45. Spirituality is also increasingly recognized as important in health research46. Evidence suggests that spirituality is more difficult to measure than religiosity because it is comparatively abstract and internal47. This means research examining spirituality should employ measures other than church attendance, and explore whether highly spiritual people (who may infrequently attend church) experience health benefits.
Rurality is a feature of both study groups. There have been a number of recent rural health studies within developed countries. The comprehensive review of Smith et al4. concluded that much variation exists in both urban-rural and intra-rural health differentials within and between countries. In Canada, life expectancy decreases as rurality increases, but is significant only in men48. This suggests higher mortality rates among rural Canadians, although studies on US, UK and Dutch populations report lower rates in rural residents33. Asthma and certain respiratory diseases are lower in rural Canada, yet certain cancers, cardiovascular disease and obesity are higher48. This variability is common to most developed countries4. Farming locations and areas with high pesticide exposure may be at increased risk for cancer49. However, CIHI48 and Smith et al4. conclude that rurality per se does not translate into health disadvantage, but instead is a proxy for geographically dispersed determinants including personal behaviour and socio-economic factors.
Research setting, design
Both groups involved in the study reside in the Wellesley, Woolwich and Wilmot Townships of Waterloo, Ontario (Fig2). The Waterloo Region ranks second in Ontario in agricultural production50, and the majority of the members in both groups are farmers. The two groups are compared with respect to physical health status, and the Social Determinants of Health (SDOH) for each group are compared in an effort to explain health differences. Since both groups are mainly farmers living in the same location, determinants such as occupation and physical environment are unlikely to explain health differences.
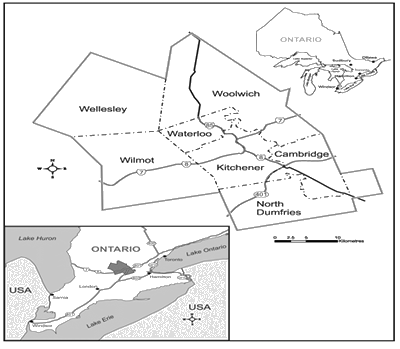 Figure 2: Study Location - Wellesley, Woolwich
and Wilmot Townships of Waterloo, Ontario, Canada
A cross-sectional survey captured data on physical health status and the SDOH. Early in the study design the challenges of accessing the closed OOM community had to be addressed. Consequently, the article's first author spent 1œ years meeting with OOMs or people knowledgeable about them, and regularly observing OOMs in everyday interactions such as shopping, working in local shops and farming. This built trust within the community and acceptance of the project's utility.
OOM study participants were recruited through the churches. The senior OOM Bishop prepared a support letter to accompany the survey package, and arranged for the deacons to hand deliver the survey packages to all adults after the spring 2010 church services. Anonymity was assured by providing OOMs with a self-addressed, postage-paid envelope for mailing back the completed survey. 1200 OOM surveys (60% response) were received, and 1171 were sufficiently completed for use in the analyses. The OOM sample was reduced to 850 in the following analyses, by eliminating those under the minimum age (28) of the non-OOMs. This was done in an effort to age-standardize the two groups.
Municipal tax rolls were used to identify non-OOM farmers. Directories of Mennonite and Amish groups were used to eliminate members of these groups from tax roll farmers, to avoid control group contamination. The survey package was mailed to all remaining tax roll farmers, with approximately 800 non-Mennonite (or non-Amish) households receiving the mailed survey. 344 completed surveys were received (43% response ) from non-OOMs.
The survey for both groups consisted of identical questions. It was piloted with a small number of OOM church leaders and community members, with feedback being incorporated into the final version.
Health measure
The physical component summary (PCS) score of the SF-12 health survey was used to measure physical health status because of its brevity and well-established psychometric properties51. The SF-12 measures six physical health functional domains: general health perceptions (GH), energy and vitality (VT), physical health impacts to social functioning (SF), physical functioning (PF), physical role limitations (RP), and bodily pain (BP). An algorithm scores the functional domains, standardizing them to a mean of 50 and standard deviation of 10. Higher PCS scores indicate better physical health.
The SF-12 has been shown to be reliable in measuring health in many populations and clinical groups52,53. Reliability/validity tests designed for the SF-1254-56 were conducted. For both groups, the instrument met the validity criteria, principal components analysis confirmed the two-factor structure, and known group tests confirmed expected relationships between demographic and health-related variables57.
Social determinants of health measures
There were practical restrictions on how determinants could be portrayed. Multiple measures were included in the survey for many SDOH because of their multidimensional nature and to provide alternate measures if significant non-responses were encountered. Various sources were consulted to guide selection of measures, question wording, and response options (Table 1).
Table 1: Determinant measures, sources and survey questions5,10,15,34,42,58-63,65
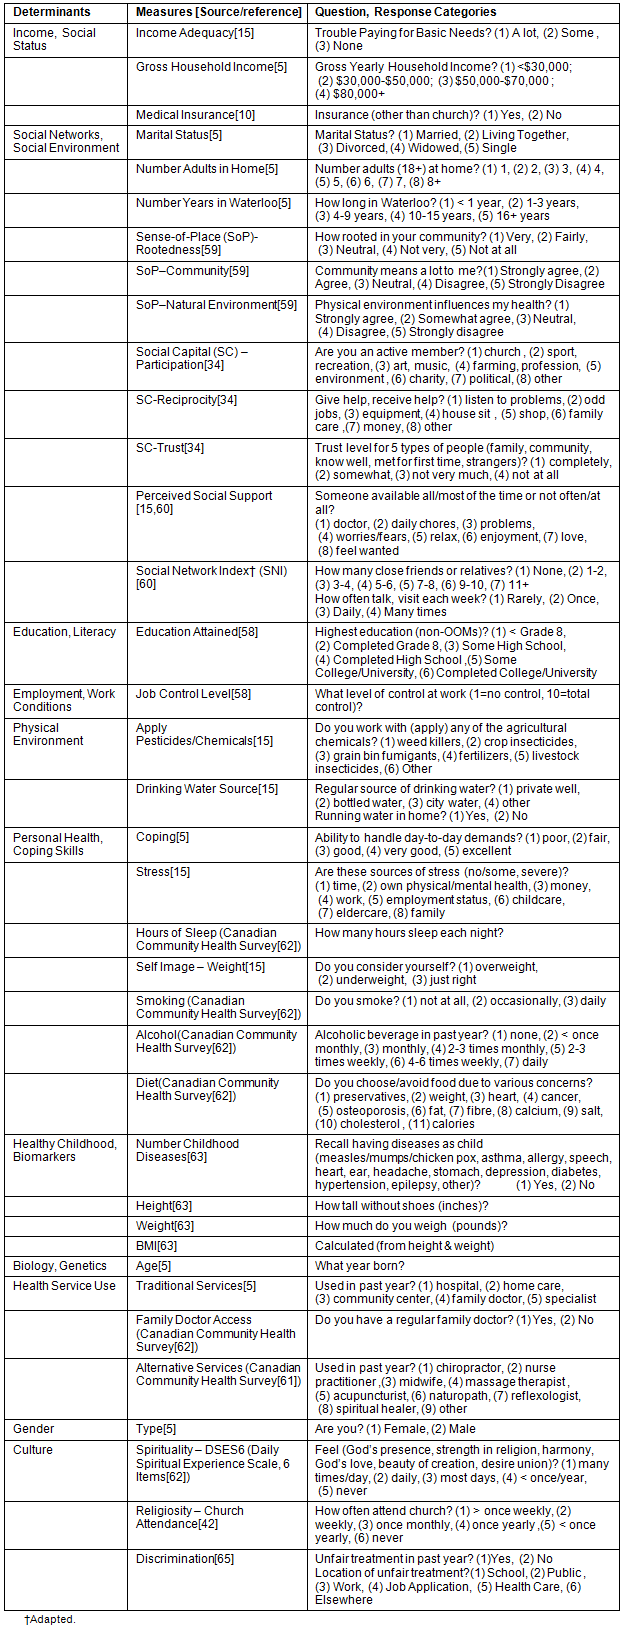
Some SDOH measures are scores created by adding up responses from one or more survey questions, with responses re-coded (if required) so higher scores represent higher levels of the underlying construct. For example, the three sense-of-place measures were re-coded so higher response codes represent higher sense-of-place levels (eg rootedness re-coded so 1=not at all rooted...5=very rooted). For trust, the trust level selected for each of the 5 types of people were re-coded so higher scores represent higher trust (eg 4=trust completely...1=do not trust at all) and a trust score was created by summing the re-coded responses for the 5 types of people. The perceived social support score was created by summing the tasks for which the respondent indicated that support existed most or all of the time. The participation score represents the sum of all organizations for which the respondent indicated 'active' membership. The social network index (SNI) is the sum of the respondent's number of close friends and relatives, with a number added for frequency of contact (1 if contact with friends/relatives was 'rarely', 2 for 'once a week', 3 for 'daily', 4 for 'many times a day'). Reciprocity was split into help received and help given, with the score for each representing the sum of the tasks for which help was given or received. The 6-Item Daily Spirituality Experience Scale (DSES6) was created using the developer's methodology65, and no re-coding was employed to ensure comparability with the broader literature where higher DSES6 scores represent lower spirituality levels.
Statistical analyses
The statistical software SAS v9.2 was used for all statistical analyses (http://www.sas.com). The PCS scores were calculated using the original (orthogonal) scoring algorithm and employing US population norms51,53,67. Hopman et al68,69 confirm the validity of US-based norms in scoring Canadian applications of the SF-36 (the larger survey upon which the SF-12 is based). The PCS and SDOH measure distributions for the two groups were compared. Multivariate analyses (ordinary least squares regression) were conducted for both groups, with PCS as the (continuous) dependent variable and the SDOH measures as independents. All regressions were restricted to working with the same SDOH measures to ensure comparability between the two groups (rather than maximizing explanatory power using a stepwise procedure to select the variables forming the optimal model). In this way, the degree to which SDOH measures were significant in shaping physical health could be determined, given the presence of the same co-measures.
Ethics approval
Ethics approval was obtained from McMaster University Research Ethics Board, #2009-187.
Social determinants of health measure distribution
Compared to non-OOMs, the full OOM sample (n=1,171) is younger (mean age 43.4 versus 57.7) and has more females (58% versus 51%) and singles (33% versus 5%). Sample differences reflect differences in the recruitment efforts for the two groups. For example, church recruitment for the OOMs captured many singles living on their parents' farm whereas municipal tax rolls for non-OOMs captured people owning their own farm. Sample differences also reflect natural population characteristics, since the OOM population is younger with more females compared to the Ontario population70.
Table 2 provides the distribution of the SDOH measures used in the regression analyses, and shows that the two groups differ significantly on most SDOH. Some SDOH were excluded from the regressions, such as Education and Literacy because educational attainment did not vary in OOMs, Physical Environment because of high colinearity with other measures or absence of a significant health relationship, and Health Service Use since virtually all respondents (both groups) reported having family doctor access. Also excluded from the regressions were traditional health behaviours such as smoking and alcohol consumption, because no OOMs reported either. Employment type was excluded because the majority of members of both groups were farmers. Regarding employment status, more non-OOMs were unemployed than OOMs (28.5% of non-OOMs versus 10.8% of OOMs). Since the majority of the unemployed (over 90%) in both groups indicated that retirement was the reason for unemployment, employment status was highly correlated with age and thus excluded from the regressions.
Table 2: Distribution of determinant measures Old Order Mennonites (OOMs)
and non-OOMs Data collected spring-summer 2010 (p-values for χ2 or t-test)
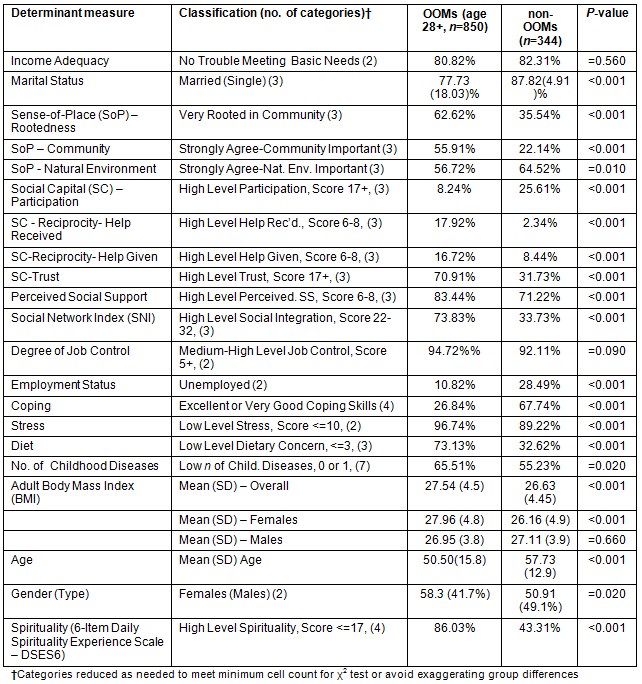
The groups did not differ on income adequacy or degree of job control, with most participants reporting no trouble meeting basic needs and high job control levels. Most members of both groups were married, with the OOMs having more singles. The OOMs assign more importance to the socially oriented sense-of-place measures - rootedness and community - and less to the physical environment. For social capital, the OOMs report lower levels of participation and higher levels of trust and reciprocity. OOMs rarely join formal organizations, yet regularly participate within their community, suggesting that social interaction may better capture participation levels. More social interaction in OOMs is evident in the higher SNI and perceived social support scores. OOMs report more difficulty coping but less stress, which seems counterintuitive, although the stress question may not have captured the full response range or asked about stressors most common in OOMs. OOMs report fewer dietary concerns and childhood diseases. OOMs are shorter (p<0.001 overall, each gender), with women`s weight being similar to non-OOM women and men`s being less than non-OOM men. Compared to non-OOMs, BMI is higher in OOM women (p<0.001) and similar in OOM men. OOMs also report significantly higher spirituality levels.
Health status
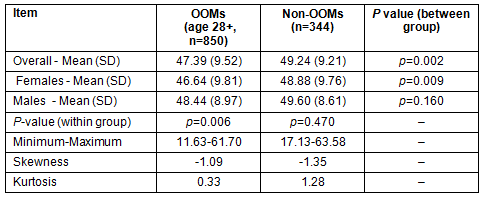
Mean PCS scores are higher (p<0.01) in non-OOMs than OOMs, indicating better physical health (Table 3). This is particularly influenced by differences in women, since physical health in non-OOM women is better than in OOM women (p<0.01) and the men's health is similar (p=0.16). There is no gender difference within non-OOMs (p=0.47), yet within OOMs women have lower PCS scores (p<0.01). All statistically significant (p=0.05) PCS score differences are also of potential clinical significance since they exceed one - the minimum (cut-off) for interpretation67,71. Potential clinical significance means the difference justifies further investigation, as it may reflect substantive differences in underlying causal mechanism(s). The difference in men's PCS scores, although not statistically significant, may be clinically significant given that it (slightly) exceeds one. PCS scores in both groups are negatively skewed, as in other SF-12 general population studies56. The kurtosis coefficient is a measure of how peaked a distribution is, with lower values indicating a flatter (more spread out) distribution. The OOM PCS distribution is flatter than for non-OOMs, indicating wider variation in physical health status within OOMs.
Table 3: SF-12 PCS Statistics Old Order Mennonites (OOMs)
and non-OOMs Data collected spring-summer 2010
Examining PCS scores by age and gender provides further insight into group differences and patterns. As expected, physical health declines with increasing age (Figs3,4). Since only 2.6% of non-OOMs (versus 18.6% of OOMs) are aged 34 years or younger, conclusions about physical health in the youngest age group cannot be made. However, in the other five groups, women show PCS differences exceeding one (clinical significance cut-off) for all but the 35-44 age group, all in favour of the non-OOMs (marked 's', Fig3). Men's PCS score differences exceed one for all five age groups (all in favour of the non-OOMs, Fig4), although differences in the middle-aged groups (the largest portion of the sample) are only slightly above the cut-off. Within both groups, men have better physical health than women for all but one age group (65-74 in OOMs, 55-64 in non-OOMs). Age and gender differences in this study are consistent with prior SF-12 research52.
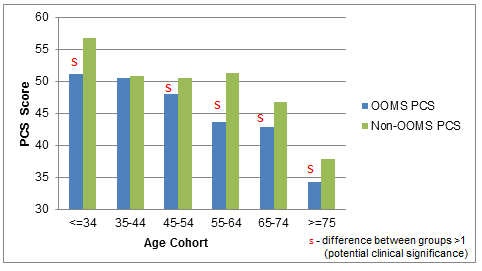 Figure 3: Female Physical Component Summary (PCS) scores by age cohort
Old Order Mennonites (OOMs) and non-OOMs Data collected spring-summer 2010
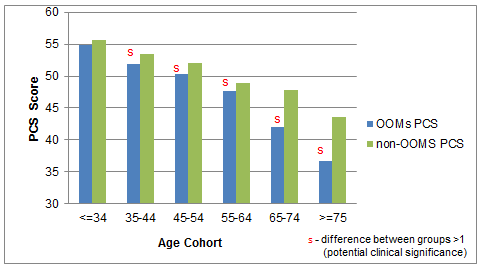 Figure 4: Male Physical Component Summary (PCS) scores by age cohort
Old Order Mennonites (OOMs) and non-OOMs Data collected spring-summer 2010
Key Social determinants of health shaping health
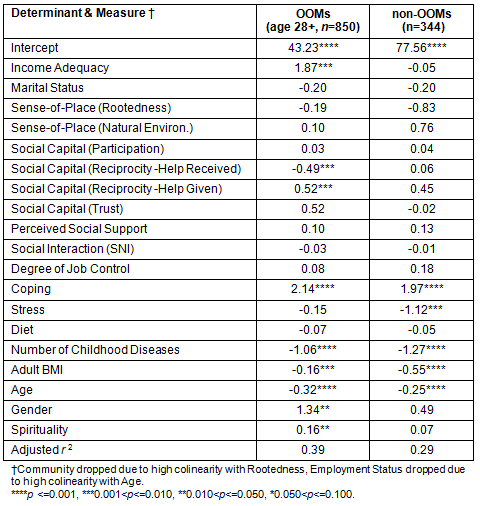
Table 4 presents the regression analysis results, with adjusted R-square values of 0.39 and 0.29 for the OOM and non-OOM models respectively. Four SDOH measures were highly significant (p≤0.01) in both regression models - coping, BMI, age and number of childhood disorders. Stronger coping skills were associated with better physical health, and higher BMI, increasing age and number of childhood diseases were associated with poorer physical health. The significance of age in both models reflects earlier findings in which PCS scores decreased with increasing age in both groups (Figs3,4).
Some SDOH were associated with only one group. Stress was significantly and negatively associated with health in non-OOMs. Within OOMs, increased physical health was associated with decreased spirituality, increased income adequacy and increased reciprocity (given). Decreased physical health in OOMs was associated with reciprocity (received) and being female.
Gender in the OOM model, and its absence in the non-OOM model, is consistent with earlier results showing a gender difference for OOMs only (Table 3).
Table 4: Regression Model Coefficients Old Order Mennonites (OOMs)
and non-OOMs Data collected spring-summer 20100
(****p<=0.001, ***0.001<p<=0.010, **0.010<p<=0.050, *0.050<p<=0.100)
Discussion
The purpose of this study was to determine whether physical health was better in OOMs, and to identify the key determinants shaping it. Physical health in OOMs was found to be lower than in non-OOMs. Since both groups live in the same location, the individual and cultural characteristics discussed below are among the main factors responsible for this difference.
Individual and cultural determinants of physical health
Physical health in both groups is shaped by age, coping, number of childhood disorders and BMI. Age is linked to declining physical health in all populations, and other studies have found that coping significantly influences physical and mental health5,24,72,73. OOMs report more difficulty coping, despite low stress levels and the high self-efficacy often seen in Old Orders74. Since the survey may have failed to identify common OOM stressors, chronic exposure to stressors may still underlie their coping difficulties, potentially resulting in increased blood cortisol levels and ultimately cardiovascular disease and other illness75,76. Many life-course studies support the association between number of childhood disorders and physical health77,78. Childhood illness can represent a lifelong threat, predisposing adults to related conditions or weakening their immune system and increasing general illness susceptibility. Psychosocial effects may also be present, since childhood illness shapes OOM mental health72. BMI is associated with poorer physical health, with studies linking BMI to diabetes, cardiovascular disease and premature mortality79-82. Exercise and weight management are critical for controlling BMI and reducing chronic illness risk79. BMI does not shape mental health in either group72, suggesting minimal psychosocial effects.
Some determinants shape physical health in only one group. Higher stress is linked to poorer health in non-OOMs, and they report higher stress (Table 2). Studies suggest that stress can negatively impact physical health, particularly when it is chronic and co-exists with a lack of control or low social interaction levels58. While non-OOM job control levels are high, they may feel a lack of control over broader conditions impacting farmers (eg economic or climate conditions) and they report less social interaction. As discussed above, psychosocial stressors can lead to elevated blood cortisol levels, potentially causing other health conditions.
Within OOMs, income adequacy, reciprocity (given and received), gender and spirituality are associated with physical health. Health improves with income adequacy, with strong support in the literature for this association22. Income may significantly shape OOM physical health because of lower incomes, high parity, refusal of government support or high self-reliance. Survey results indicate lower OOM household incomes and larger families. Also, OOMs refuse government assistance such as old age security. Despite a strong mutual aid system providing economic support for families, OOMs are taught self-reliance as a basic virtue10. Reluctance to utilize broader safety nets means some OOMs may lack the resources to meet family needs. Absence of a direct income-health effect in non-OOMs may reflect higher incomes, access to government support, or the existence of indirect effects83. Poetz et al24. and the OOM mental health results72 show an indirect income-health effect mediated by coping, but this could not be tested in non-OOMs because the sample is below 50084. Regarding the mechanism underlying the income-physical health relation in OOMs, material conditions are suspected and are, in part, socially produced. However, psychosocial mechanisms cannot be ruled out, since an indirect income-mental health link in OOMs was observed, and some researchers suggest that humans, as social animals, will always attach some psychosocial meaning to material resources85.
Reciprocity received and given are negatively and positively associated with physical health in OOMs. The associations may reflect psychosocial effects such as satisfaction from helping others and stress from receiving help due to feeling indebted, being a burden or losing independence86. However, neither form of reciprocity significantly impacts OOM mental health72, suggesting psychosocial effects are minimal. Reciprocity-physical health relations more likely reflect health status, where more help is given and received by people with better and worse health. Reciprocity in the OOM model is consistent with the high levels of help they give and receive (Table 2), and originates from 'a sense of community matched by none' (p186)10.
Gender appears in the OOM model, with men's physical health exceeding that of women. While many SF-12 studies find lower PCS scores among women, OOM women's scores are also below those of non-OOM women, suggesting they face unique risks. There is little evidence of psychosocial effects, since OOM women's mental health is significantly better than that of non-OOM women72. The gender-health effect remains after BMI is included in the model, suggesting risk factors beyond diet and weight management. Perhaps large families are an underlying risk to women: frequent pregnancies are physically demanding, leave less time for recovery, and tie women to the home with cooking, cleaning and caring for children. While Old Order women report lower reproductive-related stress15, frequent pregnancies may nevertheless carry a physical toll. Moreover, OOMs may limit or delay necessary reproductive-related health services. Therefore, the mechanism underlying the gender-physical health relation may be linked to reproduction, and rooted in broader societal norms that encourage large families and women to be 'keepers at home' (p109)87.
Spirituality appears in the OOM model, with less spiritual people having better physical health. While studies often report positive associations with physical health, most also pertain to religiosity (not spirituality) and have methodological limitations43. This study`s cross-sectional nature does not allow determination of directionality, thus health status may drive the spirituality-physical health relation. This interpretation is supported by studies showing that people turn to religion/spirituality to cope with poor health88. Interestingly, spirituality is positively associated with OOM mental health72. This dual role - protective for mental health and a resource for those with poor health - has been observed in clinical groups such as those with chronic pain88. While OOMs are not a clinical group, their lower physical health status might generate results similar to those of a clinical (or sub-clinical) group. This is speculation, however, with more research needed to clarify the costs and benefits of religion/spirituality in various populations.
Summarizing physical health and its determinants
In considering the study's overall results, one might ask: Why do social factors not shape physical health? Health in both groups is influenced more by traditional determinants such as age and income, which is particularly unexpected in OOMs given the strength of many social factors (Table 2). What might explain this? First, results are sensitive to the health measure used, as evidenced by the finding that self-rated health shows the most consistent linkages with social capital35. Manderbacka89 found that self-rated health reflects physical health, yet Huisman and Deeg90 suggest it may be mental or physical health depending on cognitive/filtering processes and assessment timing. Self-rated health is not equivalent to this study's measure of physical health (PCS), as it is one of the six functional domains used to derive it. Second, other studies have failed to demonstrate a relationship between physical health and either social capital91,92 or sense-of-place59. Third, many studies focus on a subset of determinants, which will produce different results from those including a more comprehensive list. Fourth, perhaps the rural or farming status of this study's populations affects the relevance of the social factors. An Australian study on rural populations found that social relations and community support had less impact on mental health in farmers than non-farmers, and the researchers suggest this may reflect higher self-reliance among farmers93.
Another question arises when comparing regression model intercepts: does the low intercept in the OOM model signal other risk factors not explicitly recognized? While the OOM model has a reasonable R-square (0.39) and includes a number of determinants, the intercept is well below the non-OOM's, significantly depressing OOM PCS scores. Why? The SF-12 instrument met the validity/reliability criteria57, and underlying psychosocial effects appear minimal since virtually all members report no discrimination, and OOM mental health compared to that of non-OOMs is equal for men and higher for women72. Employment status was excluded from the regressions (due to high colinearity with age), yet it can influence health. However, the models do not change significantly when employment status is included (results available from first author). Lower OOM PCS scores may reflect genetic disorders (not measured in this study) or aspects of the OOM lifestyle that are difficult to measure. For example, families are large, with OOM fertility rates more than double those of non-OOMs. Beyond the physical and economic burden of a large family, the need for offspring to acquire affordable farmland has resulted in one-third of the population leaving Waterloo over the past two decades. This has disrupted the family farm and reduced contact with family and friends, which may impact health directly or do so through coping (eg coping is similar in OOM men and women but better in non-OOMs for both genders). The overall impact of a large family is difficult to determine, however, as some results suggest a positive health impact; for example, when number of children is included in the regression, it significantly (p=0.03) and positively shapes health (OOMs only).
OOMs also differ in health service usage, although the health impacts are unclear. Virtually all OOMs report access to a family physician, so this often-used measure was not employed in this study. The challenge is in incorporating other health service information into a meaningful measure - for example OOMs report fewer visits to hospitals and doctors but more visits to community clinics, and significantly higher usage of alternative services. Local service providers indicate that OOMs often present with more advanced symptoms, attributing this to delays in seeking health services (pers. comm., Waterloo Public Health, 2011). This is also seen in the Amish74, unsurprising since both groups lack public health insurance.
Study limitations
Several study limitations should be acknowledged. First, responses rely on self-report and interpretation, and are cross-sectional only, although these same limitations are consistently found in most large population studies. Second, results may be limited by the ways in which various determinants were measured. Since all the determinants were being measured, there were restrictions on the number of measures that could be included in the survey. Third, the non-OOM sample size (344) is below the 500 recommended by the SF-12 developers (for consistency with SF-36 results), with the small sample size potentially contributing to the lack of significance among variables in the non-OOM regression. However, tests conducted for the non-OOMs indicate that the instrument shows acceptable internal consistency, distinguishes between socio-demographic classes of respondents in the expected manner, and exceeds the small convenience samples often used in SF-12 validity studies55. Finally, OLS multiple regressions assume normality, yet a few variables show evidence of non-normality. However, since these variables are negatively skewed, commonly employed data transformations will be ineffective in normalizing them94.
Despite the limitations, this study highlights important avenues for research and policy action. It indicates the complexity of determinants research, showing that the key determinants depend on populations, health outcomes, and measures included in the analysis. For example, the health outcome can influence directionality, with spirituality and age being negatively associated with physical health and positively associated with mental health. The measures used for determinants and the range of determinants included in the analysis also impact the results. For example, this study found that reciprocity as a single measure (help received and help given combined) was not significant in shaping health. However, when it was broken down into two measures, both were significant and their direction of association with health differed. This study also found that social capital and other social factors are less important than traditional determinants in shaping physical health, yet they appear to shape mental health72. This may be due to inherent differences between physical and mental health and/or unique characteristics of rural populations or farmers. Ultimately, the implication of these findings is that there needs to be increased awareness of the various health outcomes, determinants, and measures used to represent them. A targeted approach to research is then required that involves careful specification of the population, health outcome of interest and determinant measures to ensure that policy actions based on the study's findings are effective and achieve desired results.
This study also supports policy action on the determinants that significantly shape health in both groups: coping, number of childhood disorders, BMI and age. These determinants have been found to influence health in many urban populations and people whose life circumstances vary widely, suggesting they transcend the boundaries of OOMs, farmers and rural populations. As such, actions focused on these determinants may offer broad impact across many populations. Approaches could be designed that address the individual, structural and temporal underpinnings of these determinants. For example, psychosocial concerns could be addressed with services that help individuals cope and reduce stress, monitor/control their weight, and maintain their family's health. Structural concerns could be tackled by investing in community resources that promote healthy lifestyles and alleviate broader economic/social conditions challenging peoples' ability to cope or maintain health. Concerns about the perpetuation of disadvantage through the life-course could be addressed by ensuring that programs are integrated and sustainable over the life-course, emphasizing the entire age spectrum from children's health (eg immunization programs, reducing childhood obesity) to healthy aging and age-friendly built environment programs.
References
1. Public Health Agency of Canada (PHAC). What determines health? (Online) 2013. Available: http://www.phac-aspc.gc.ca/ph-sp/determinants/index-eng.php#determinants. (Accessed 18 March 2013).
2. WHO. A Conceptual Framework for Action on the Social Determinants of Health. Discussion Paper for the Commission on Social Determinants of Health DRAFT April 2007. (Online) 2011. Available: http://www.who.int.social_determinants/resources/csdh_framework_action _05_07.pdf (Accessed 9 November, 2011).
3. Krieger N. Theories for social epidemiology in the 21st century: an ecosocial perspective. International Journal of Epidemiology 2001; 30: 668-677.
4. Smith KB, Humphreys JS, Wilson MG. Addressing the health disadvantage of rural populations: how does epidemiological evidence inform rural health policies and research? Australian Journal of Rural Health 2008; 16: 56-66.
5. Wilson K, Eyles J, Elliott S, Keller-Olaman S. Health in Hamilton neighbourhoods: exploring the determinants of health at the local level. Health and Place 2009; 15: 374-382.
6. Loewen Reimer M. One Quilt Many Pieces: A Guide to Mennonite Groups in Canada. Waterloo, Ontario: Herald Press, 2008.
7. Maziak W. Point-counterpoint. The triumph of the null hypothesis: epidemiology in an age of change. International Journal of Epidemiology 2009; 38(2): 393-402.
8. Rudan I. Health effects of human population isolation and admixture. Croatian Medical Journal 2006; 47: 526-531.
9. Puffenberger EG. Genetic heritage of the Old Order Mennonites of Southeastern Pennsylvania. American Journal of Medical Genetics Part C. (Seminar in Medical Genetics) 2003; 121C: 18-31.
10. Fretz JW. The Waterloo Mennonites: A Community in Paradox. Waterloo, Ontario: Wilfred Laurier University Press for Conrad Grebel College, 1989.
11. Esliger DW, Tremblay MS, Copeland JL, Barnes JD, Huntington GE, Bassett DR Jr. Physical activity profile of Old Order Amish, Mennonite and contemporary children. Medicine & Science in Sports & Exercise 2010; 42(2): 296-308.
12. Bassett DR, Tremblay MS, Esliger DW, Copeland JL, Barnes JD, Huntington GE. Physical activity and body mass index of children in an Old Order Amish community. Medicine & Science in Sports & Exercise 2007; 39(3): 410-415.
13. Tremblay MS, Barnes JD, Copeland JL, Esliger DW. Conquering childhood inactivity: is the answer in the past? Medicine & Science in Sports & Exercise 2005; 37(7): 1187-1194.
14. Hewner S. Fertility, migration and mortality in an Old Order Amish community. American Journal of Human Biology 1998; 10: 619-628.
15. Miller K, Yost B, Flaherty S, Hillemeier MM, Chase GA, Weisman CS, Dyer A. Health status, health conditions, and health behaviours among Amish women: results from the Central Pennsylvania Women's Health Study (CePAWHS). Women's Health Issues 2007; 17(3): 162-171.
16. Glick M, Michel M, Dorn J, Horwitz M, Rosenthal T, Trevisan M. Dietary cardiovascular risk factors and serum cholesterol in an Old Order Mennonite community. American Journal of Public Health 1998; 88(8): 1202-1205.
17. Westman J, Ferketich AK, Kauffman RM, MacEachern SN, Wilkins III JR, Wilcox PP et al. Low cancer incidence rates in Ohio Amish. Cancer Causes & Control 2010; 21: 69-75.
18. Troyer H. Review of cancer among 4 religious sects: evidence that lifestyles are distinctive sets of risk factors. Social Science and Medicine 1988; 26(10): 1007-1017.
19. Hamman RF, Barancik JI, Lilienfeld AM. Patterns of mortality in the Old Order Amish. American Journal of Epidemiology 1981; 114(6): 845-861.
20. Hsueh W, Mitchell BD, Schneider JL, St Jean PL, Pollin TI, Ehm, JG et al. Genome-wide scan of obesity in the Old Order Amish. The Journal of Clinical Endocrinology & Metabolism 2001; 86(3): 1199-1205.
21. WHO. Closing the Gap in a Generation Report. Geneva, Switzerland: WHO Press. Prepared by the Commission on the Social Determinants of Health (CSDH), 2005.
22. Adler N, Ostrove J. Socioeconomic status and health: what we know and what we don't know. Annals New York Academy of Science 1999; 896: 3-15.
23. Stringhini S, Dugravot A, Shipley M, Goldberg M, Zins M, Kivimaki M et al. Health behaviours, socioeconomic status and mortality: further analyses of the British Whitehall II and the French GAZEL prospective cohorts. PLoS Medicine e1000419, 2011; 8(2): 1-12.
24. Poetz A, Eyles JD, Elliott S, Wilson K, Keller-Olaman S. Path analysis of income, coping and health at the local level in a Canadian context. Health and Social Care in the Community 2007; 15(6): 542-552.
25. Danaei G, Vander Hoorn S, Lopez AD, Murray CJL, Ezzati M and the Comparative Risk Assessment collaborating group (Cancers). Causes of cancer in the world: comparative risk assessment on nine behavioural and environmental risk factors. Lancet 2005; 366: 1784-1793.
26. Stansfeld S. Social Support and Social Cohesion. In: M Marmot, RG Wilkinson (Eds). Social Determinants of Health, 2nd edn. Great Britain: Oxford University Press, 2008: 148-171.
27. Kaplan GA, Wilson TW, Cohen RD, Kauhanen J, Wu M, Salonen JT. Social functioning an overall mortality: prospective evidence from the Kuopio ischemic heart disease risk factor study. Epidemiology 1994; 5: 495-500.
28. Welin L, Svardsudd K, Anderpeciva S, Tibblin G, Larsson B, Wilhelmen L. Prospective study of social influences on mortality: the study of men born in 1913 and 1923. Lancet 1985; 1: 915-918.
29. Berkman L, Syme S. Social networks, host resistance, and mortality: a nine-year follow-up study of Alameda County residents. American Journal of Epidemiology 1979; 109: 186-203.
30. Pampalon R, Hamel D, De Koninck M, Disant M. Perceptions of place and health: differences between neighbourhoods in the QueŽbec City region. Social Science and Medicine 2007; 65(1): 95-111.
31. Cummins S, Stafford M, Macintyre S, Marmot M, Ellaway A. Neighbourhood environment and its association with self rated health: evidence from Scotland and England. Journal of Epidemiology and Community Health 2005; 59: 207-213.
32. Pearce J, Witten K, Hiscock R, Blakely T. Are socially disadvantaged neighbourhoods deprived of health-related community resources? International Journal of Epidemiology 2007; 36(2): 348-355.
33. van Hoojidonk C, Droomers MI, van Loon JAM, van der Lucht F, Kunst AE. Exceptions to the rule: healthy deprived areas and unhealthy wealthy areas. Social Science and Medicine 2007; 64: 1326-1342.
34. Bhandari H, Yasunobuk K. What is social capital? A comprehensive review of the concept. Asian Journal of Social Science 2009; 37(3): 480-510.
35. Kim D, Subramanian SV, Kawachi I. Social capital and physical health. A systematic review of the literature. In: I Kawachi, SV Subramanian, D Kim (Eds). Social Capital and Health. New York: Springer Science/Business Media LLC, 2008; 139-190.
36. van Hooijdonk C, Droomers M, Deerenberg IM, Mackenbach JP, Kunst AE. The diversity in associations between community social capital and health per health outcome, population group and location studied. International Journal of Epidemiology 2008; 37: 1384-1392.
37. Ellaway A, Macintyre S. Is social participation associated with cardiovascular disease risk factors. Social Science and Medicine 2007; 64: 1384-1391.
38. Kamrul Islam M, Merlo J, Kawachi I, Lindstrom M, Burstrom K, Gerdtham U. Does it really matter where you live? A panel data multilevel analysis of Swedish municipality-level social capital on individual health-related quality of life. Health Economics, Policy & Law 2006; 1: 209-235.
39. Kier F, Davenport DS. Unaddressed problems in the study of spirituality and health. American Psychologist 2004; 59: 53-54.
40. Nicholson A, Rose R, Bobak M. Association between attendance at religious services and self-reported health in 22 European countries. Social Science and Medicine 2009; 69: 519-528.
41. Chida Y, Steptoe A, Powell, LH. Religiosity/spirituality and mortality. Psychotherapy and Psychosomatics 2009; 78: 81-90.
42. Koenig J, McCullough M, Larson D. Handbook of Religion and Health. New York: Oxford University Press, 2001.
43. Hwang K, Hammer JH, Gragun RT. Extending religion-health research to secular minorities: issues and concerns. Journal of Religion and Health 2011; 50: 608-622. doi: 10.1007/s10943-009-9296-0.
44. Gillum RF, King DE, Obisesan TO, Koenig HG. (2009). Frequency of attendance at religious services and mortality in a U.S. national cohort. Annals of Epidemiology 2009; 18(2): 124-129.
45. Powell L, Shahabi L, Thoresen CE. Religion and spirituality: linkages to physical health. American Psychologist 2003; 58(1): 36-52.
46. King M, Koenig H. Conceptualising spirituality for medical research and health service provision. BMC Health Services Research 2009; 9(116): 1-7.
47. Schlehofer MM, Omoto AM, Adelman JR. How do religion and spirituality differ? Lay definitions among older adults. Journal for the Scientific Study of Religion 2008; 47(3): 411-425.
48. CIHI (Canadian Institute for Health Information). How Healthy Are Rural Canadians? An Assessment of Their Health Status and Health Determinants. Ottawa, ON: Canadian Population Health Initiative (part of CIHI), Public Health Agency of Canada (PHAC) and the Centre for Rural and Northern Health Research (Laurentian University), 2006.
49. Clapp R, Howe G, Jacobs M. Environmental and occupational causes of cancer revisited. Journal of Public Health Policy 2006; 27(1): 61-76.
50. Foodlink Waterloo Region. Agriculture in Our Region: Find Healthy Local Food in Waterloo Region. (Online) 2011. Available: http://www.kwnow.ca/cdps/cditem.cfm?nid=16257. (Accessed 31 March 2011).
51. Ware JE, Kosinski M, Keller SD. A 12-Item short-form health survey: construction of scales and preliminary tests of reliability and validity. Medical Care 1996; 34(3): 220-226.
52. Fleishman J, Selim A, Kazis L. Deriving SF-12v2 physical and mental health summary scores: a comparison of different scoring algorithms. Quality of Life Research 2010; 19: 231-241.
53. Gandek B, Ware JE, Aaronson NK, Apolone G, Bjorner JB, Brazier JE et al. Cross-validation of item selection and scoring for the SF-12 Health Survey in nine countries: results from the IQOLA Project. International Quality of Life Assessment. Journal of Clinical Epidemiology 1998; 51: 1171-1178.
54. Gandek B, Ware JE, Aaronson NK, Alonso J, Apolone G, Bjorner J et al. Tests of data quality, scaling assumptions, and reliability of the SF-36 in eleven countries: results from the IQOLA Project. International Quality of Life Assessment. Journal of Clinical Epidemiology 1998; 51: 1149-1158.
55. Okonkwo O, Roth DL, Pulley LV, Howard G. Confirmatory factor analysis of the validity of the SF-12 for persons with and without a history of stroke. Quality of Life Research 2010; 19: 1323-1331.
56. Kontodimopoulos N, Pappa E, Niakas Dl, Tountas Y. Validity of SF-12 summary scores in a Greek general population. Health and Quality of Life Outcomes 2007; 5(55): 1-9.
57. Fisher KA, Newbold BK. Validity of the SF-12 in a Canadian Old Order Mennonite Community. Applied Research in Quality of Life 2013; (in press).
58. Marmot J, Siegrist J, Theorell T. Health and the psychosocial environment at work. In: M Marmot, RG Wilkinson (Eds). Social Determinants of Health, 2nd edn. Great Britain: Oxford University Press, 2008; 97-130.
59. Eyles J, Williams A. Sense of Place, Health and Quality of Life. Great Britain: MPG Books Limited, 2008.
60. Cohen S, Wills T. Stress, social support and the buffering hypothesis. Psychological Bulletin 1985; 98: 310-357.
61. Berkman, L. Social Networks and Health. Berkeley: University of Berkeley, 1977.
62. Statistics Canada. Canadian Community Health Survey (CCHS) Cycle 1.1. Available: http://www.statcan.gc.ca/concepts/health-sante/index-eng.htm. (Accessed 31 August 2011).
63. Smith JP. Reconstructing childhood health histories. Demography 2009; 46(2): 387-403.
64. Krieger N. Epidemiology and social sciences: towards a critical reengagement in the 21st century. Epidemiological Review 2000; 22: 155-163.
65. Underwood B. Daily spiritual experience scale (Online). Available: http://dsescale.org/ (Accessed 31 March 2011).
66. Krieger N. Embodying inequality: a review of concepts, measures and methods for studying health consequences of discrimination. International Journal of Health Services 1999; 29(2): 295-352.
67. Ware JE, Kosinski M, Keller M. How to score the SF-12 physical and mental health summary scales. Lincoln, RI: Quality Metric Incorporated, 1998.
68. Hopman WM, Berger C, Joseph L, Towheed T, Anastassiades T, Tenenhouse A et al. Is there regional variation in the SF-36 scores of Canadian adults? Canadian Journal of Public Health 2002; 93(3): 233-237.
69. Hopman WM, Towheed T, Anastassiades T, Tenenhouse A, Poliquin S, Berger C et al. Canadian normative data for the SF-36 health survey. Canadian Medical Association 2000; 163(3): 265-271.
70. Statistics Canada. 2006 Census tables. Available: http://www12.statcan.ca/census-recensement/2006/dp-pd/hlt/97-551/index.cfm?Lang=E (Accessed 15 November 2011).
71. Taft C, Karlsson J, Sullivan M. Editorial comment: reply to Drs War and Kosinski. Quality of Life Research 2001; 10: 415-420.
72. Fisher KA, Newbold KB, Eyles JD, Elliott SJ. Mental health in a Canadian Old Order Mennonite community. Health 2013; (in press).
73. Caron J, Liu A. Factors associated with psychological distress in the Canadian population: a comparison of low-income and non low-income sub-groups. Community Mental Health Journal 2011; 47: 318-330.
74. Sharpnack PA, Quinn Griffin MT, Fitzpatrick JJ. Self-transcendence and spiritual well-being in the Amish. Journal of Holistic Nursing 2011; 29(2): 91-97.
75. Shively CA, Mussleman DL, Willard SL. Stress, depression, and coronary artery disease: modeling comorbidity in female primates. Neurosciecne & Biobehavioural Reviews 2009; 33(2): 133-144.
76. Hemmingway H, Marmot M. Evidence based cardiology. Psychosocial factors in the aetiology and prognosis of coronary heart disease: systematic review of prospective cohort studies. British Medical Journal 1999; 318: 1460-1467.
77. Blane, D. The life course, the social gradient and health. In: M Marmot and RG Wilkinson (Eds). Social Determinants of Health, 2nd edn. Great Britain: Oxford University Press, 2008; 54-77.
78. Krieger N, Davey Smith G. Bodies count and body counts: social epidemiology and embodying inequality. Epidemiological Reviews 2004; 26: 92-103.
79. Green AJ, Fox KM, Grandy S. Impact of regular exercise and attempted weight loss on quality of life among adults with and without type 2 diabetes mellitus. Journal of Obesity 2011; 1-6.
80. Dudina A, Cooney T, De Bacquer D, De Backer G, Ducimetie P, Jousilahti P et al. Relationship between body mass index, cardiovascular mortality, and risk factors: a report from the SCORE investigators. European Journal of Cardiovascular Prevention & Rehabilitation 2011; 18(5): 731-742.
81. Faeh D, Braun J, Tarnutzer S, Bopp M. Obesity but not overweight is associated with increased mortality risk. European Journal Epidemiology 2011; 26: 647-655.
82. Mitchell JA, Bornstein DB, Sui X, Hooker SP, Church TS, Lee CD et al. The impact of combined health factors on cardiovascular disease mortality. Prevention and Rehabilitation 2010; 160(1): 102-108.
83. Lynch J, Smith GD, Harper S. Is income inequality a determinant of population health? Part 1. A systematic review. Milbank Quarterly 2004; 82(1): 5-99
84. Frazier P, Tix A. Testing moderator and mediator effects in counseling psychology research. Journal of Counseling Psychology 2004; 51(1): 115-134.
85. Kawachi I, Subramanian SV, Almeida-Filho N. A glossary for health inequalities. Journal of Epidemiology and Community Health 2002; 56: 647-652.
86. Abbott S, Freeth D. Social capital and health: starting to make sense of the role of generalized trust and reciprocity. Journal of Health Psychology 2008; 13(7): 874-883.
87. Horst IR. A Separate People: An Insider's View of Old Order Mennonite Customs and Traditions. Waterloo, Ontario, Canada: Herald Press, 2000.
88. Rippentrop AE, Altmaier E, Chen J, Found E, Keffala V. The relationship between religion/spirituality and physical health and mental health, and pain in a chronic pain population. Pain 2005; 116: 311-321.
89. Manderbacka K. Examining what self-rated health question is understood to mean by respondents. Scandinavian Journal Social Medicine 1998; 26: 145-153.
90. Huisman J, Deeg DJH. A commentary on Marja Jylhä 'What is self-rated health and why does it predict mortality? Towards a unified conceptual model.' Social Science and Medicine 2010; 69(3): 307-316.
91. Subramanian SV, Kim DJ, Kawachi I. Social trust and self-rated health in US communities: a multilevel analysis. Journal of Urban Health: Bulletin of the New York Academy of Medicine 2002; 79: S21-S34.
92. Veenstra G. Social capital, SES and health: an individual-level analysis. Social Science and Medicine. 2002; 50: 619-629.
93. Stain HJ, Kelly B, Lewin TJ, Higginbotham N, Beard JR, Hourihan F. Social networks and mental health among a farming population. Social Psychiatry Psychiatric Epidemiology 2008; 43: 843-849.
94. Sheskin DJ. Handbook of Parametric and Nonparametric Statistical Procedures, 4th edn. Boca Raton, Florida, USA: Chapman and Hall/CRC, Taylor and Francis Group, 2007.