Introduction
The prevalence of overweight among children in the USA has increased rapidly over the past several years1 to the point that it is now being termed a public health epidemic2. Recent data indicate that 10-25% of children under the age of 18 years are overweight or at risk for overweight3. Children who are overweight are likely to maintain their weight status and become adults who are obese4,5. However, even if they lose weight and become adults of normal weight status, these individuals are likely to have significant health concerns in adulthood secondary to their childhood overweight status including heart disease, lipid abnormalities, hypertension, diabetes mellitus, sleep apnea, infertility, gall bladder disease, and some cancers6,7. Data also indicate that overweight is a problem for children of all ages, from 4 years of age through adolescence, and is a significant problem for both males and females8.
Adult studies using large samples indicate that obesity is more common among rural samples than among urban samples9,10. However, there has been little direct research on differences in overweight among urban and rural children. Research designed to study other issues has led to some information on pediatric overweight among urban and rural children. For example, in a study designed to assess psychiatric disorders among rural youth, researchers found that overweight and at risk for overweight was 3-4 times more prevalent in their rural sample compared to national norms11. In a study of pediatric weight status and cardiovascular risk factors, researchers found that 43% of children in their rural sample were at risk for overweight and over 25% were overweight12. In a similar study researchers found that 29.5% of rural children in their sample were overweight13. In a study of New York City schoolchildren researchers found at risk for overweight or overweight prevalence rates of 25% in their large sample of urban children14. However, a study of body image perception among urban and rural children found no difference in body mass index (BMI) among the urban and rural children15. Therefore, the few data that are available on pediatric weight status among urban and rural children are inconclusive.
In the one previously mentioned study that does directly compare urban and rural children's rates of overweight, the authors found that overweight was more prevalent in rural children (29.5%) than in urban children (21.7%)13. However, the authors did not assess differences in health behaviors, which may explain these differences. Becoming aware of differences in health habits among urban and rural children is imperative for the development of empirically supported interventions to specifically target weight loss or weight management among these two different groups of children16.
The purpose of the current project was to assess health behaviors (eg eating habits and physical activity habits) and weight status among school-age children in urban and rural areas.
Method
Participants
All fifth-grade students in four public schools (N = 525; urban: n = 404, rural: n = 121) were invited to participate in the current project; two of the schools were in urban areas and two were in rural areas, as defined by the US Census Bureau 2000 criteria (http://www.census.gov/geo/www/ua/ua_2k.html)17. Schools were chosen based upon their location (rural versus urban) and the availability of a telemedicine connection.
Procedure
Recruitment flyers were sent home to the parents of all fifth-grade children in the four participating schools. One week following flyer disbursement, families who indicated interest in the study were called by research personnel to discuss questions and consent procedures. Consent forms were signed and sent back to the school nurse to collect and mail back to researchers. Simultaneously, school nurses were trained via telemedicine in data collection procedures, including how to take height and weight properly and how to administer all other measures. This study was approved by the University of Kansas Medical Center Institutional Review Board.
Once signed consent forms were received, the home-based measures were sent home with the children for parents and children to complete together. Approximately 2 weeks later, school nurses invited each child to their office during a non-academic class period to gather school-based measures. At the same time, nurses collected and reviewed the home-based measures brought in by the children for accuracy and completeness. If necessary, parents were called at this time to provide additional information. All measures were then mailed to researchers for data collection and storage. Scales and stadiometers were checked for accuracy on a monthly basis throughout the study and calibrated if necessary. Dietary data were analyzed using the Nutrition Data System for Research software v 2005 (University of Minnesota; Minneapolis, MN, USA), which yielded the amount of calorie intake, the percent of calories from fat, the vitamin and mineral composition of foods as well as the timing of meals and meal location. Families were paid $15 for their participation.
Because an initial analysis of the data revealed problems with skewness and kurtosis, Mann-Whitney U- tests were completed. To be thorough, all analyses were also run as t- tests. Where t- tests and Mann-Whitney U- tests differ, the more robust Mann-Whitney U is reported.
Measures: home-based
Demographic questionnaire: The demographic questionnaire (DEM) is a one page measure completed by parents that assesses parents' education levels and occupations, household income, number of members living in the household, and parent self-reported weight and height.
Three-day food record: Parents kept a three-day food record of the food and beverage items their child consumed for three consecutive days (two weekdays and one weekend day) on a booklet form provided by researchers. Parents were instructed in how to properly keep this record via an instructional handout, and were encouraged to complete missing information with the help of their child, especially for school lunches and other meals eaten away from the parent. Three-day food records have been shown to be representative of dietary intake over a seven-day period18,19.
The seven-day physical activity recall: The seven-day physical activity recall (PAR) was completed by parents and children together at home and is designed to assess total weekly energy expenditure via frequency, intensity, and duration of physical activity over the past week and has been found to be a valid and reliable measure of physical activity in previous research (for review, see 20).
Metabolic equivalent task: Information provided by families on the PAR allowed for calculation of metabolic equivalent tasks (METs) per day for each participant. A single MET is defined as 'the energy expenditure for sitting quietly'; therefore, 'a 2-MET activity requires two times the metabolic energy expenditure of sitting quietly'21. In this study, the frequency of each activity was multiplied by the corresponding MET value taken from an existing coding scheme for classifying physical activity rates of energy expenditure21. The MET values used in this study were based on adult norms because MET values specifically for children have not yet been established.
Sedentary activity (screen time): Information provided on the PAR allowed for calculation of the total number of hours per day children spent in sedentary activity, including playing video games, watching TV, and using a computer. The total number of screen time hours per week was summed across these activities to obtain a total weekly sedentary activity score in hours (see 20).
Measures: school-based
Twenty-four hour dietary recall: Children were interviewed by school nurses regarding their eating habits for the past 24 hours using the 24 hour dietary recall. Nurses were trained in proper administration of a 24 hour recall by an expert dietitian (DKS) prior to the start of the study, and standardized food models were provided to all schools for use during the 24 hour recall. This measure has been shown to be a valid and reliable representation of a child's overall diet in previous research22.
Physical activity interview: Nurses administered this interview of activity habits to children, after being trained by research staff. This measure has been shown to be a valid and reliable measure in previous research20.
Height: All schools were provided with a Nasco Mechanical Stadiometer, Model SB32644G (Nasco; Fort Atkinson, WI, USA), with built-in leveling bubble and locking headpiece to measure height throughout the study. Nurses were trained in proper use of a stadiometer prior to data collection, and all heights were taken in triplicate.
Weight: All schools were provided with a Nasco 400# capacity Digital Column Scale (Nasco; Fort Atkinson, WI, USA) to measure weight throughout the study. Nurses were trained in proper use of a digital scale prior to data collection, and all weights were taken in triplicate.
Body mass index: Based upon their height and weight, each child's BMI was calculated using the metric formula BMI = [Weight in kg/ Height in cm/ Height in cm] x 10 000. Each BMI was then plotted on an age/sex chart, allowing the computation of each child's BMI percentile. As is recommended by the Centers for Disease Control23, children over the 85th percentile were considered at risk for overweight and children over the 95th percentile were considered overweight. In addition to being recommended as the primary measure of child weight status by the CDC and the American Academy of Pediatrics, BMI percentile was chosen as our measure of child weight status as current research indicates it is the best variable for measuring adiposity change in growing children24.
Results
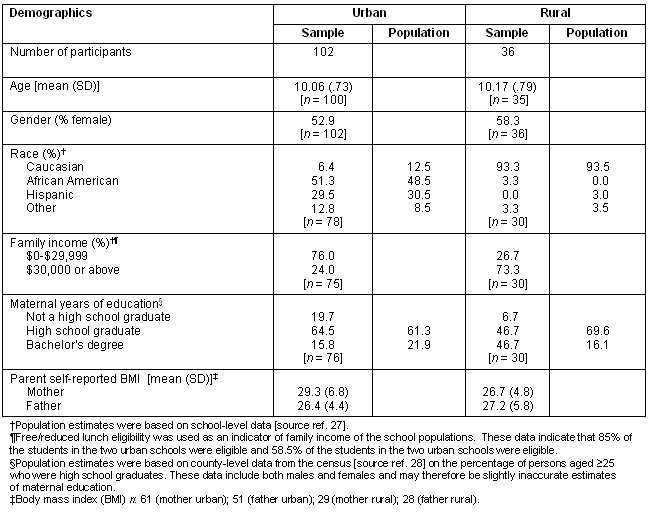
A total of 138 children chose to participate, 102 from the two urban schools and 36 from the two rural schools. The two urban schools were located in two large, metropolitan areas in Kansas; the two rural schools were located in towns of less than 20 000 in population in Western Kansas. These towns were often hours away from the nearest shopping or medical services and were largely sustained by farming and agriculture. The following demographics are based on the total sample of 138 children whenever possible. Because some participants did not complete all items of the demographic questionnaire some analyses contain less than 138 participants. The mean age of the children was 10.1 years (SD = .74; n = 135) and 54.3% were female (n = 138). The urban participants were more racially diverse (6.4% Caucasian, n = 78) than the rural participants (93.3% Caucasian, n = 30). The urban sample also had lower household income (76.0% below $30,000, n = 75) as compared with the rural sample (26.7% below $30,000, n = 30). Maternal years of education were greater among the rural sample (46.6% four years or more of college, n = 30) than among the urban sample (21.9 % four years or more of college, n = 76). Chi-square analyses found that these three differences between the urban and rural samples were statistically significant (p < .05). Parent self-reported BMI was significantly higher for urban mothers (mean = 29.3, SD = 6.8, n = 61) than for rural mothers (mean= 26.7, SD = 4.8, n = 29) (t(74.8) = 2.102, p = 039). However, parent self-reported BMI for fathers was approximately equivalent across urban and rural groups (mean = 26.4, SD = 4.4, n = 51; mean = 27.2, SD = 5.8, n = 28; t(77) = -.716, p = .476). Table 1 provides more detailed participant demographic information, and information regarding how our sample matched the population on key demographic variables.
Table 1: Participant demographics
Dietary intake
Because there were two measures of dietary intake, these measures were collapsed prior to data analysis, as done in previous nation-wide studies25. Each measure was analyzed for total energy in kilocalories and percent calories from fat and then these two data points were averaged for each participant to arrive at the two variables total energy per day and percentage of calories from fat per day for each participant.
The average energy (kilocalorie) intake for the entire sample was 1840.8 (SD = 429.7, n = 129). The average intake for children from urban schools was 1835.5 calories per day (SD = 447.5, n = 95) and for children from rural schools was 1855.7 (SD = 381.5, n = 34; t(127) = -.235, p = .815). Children from urban schools obtained an average of 33.6% of their daily calories from fat (SD = 5.8, n = 95) and children from rural schools obtained an average of 34.6% of their daily calories from fat (SD = 4.1, n = 34; t(127) = -.980, p = .609). Table 2 provides additional detail.
Table 2: Child physical, activity, and nutritional characteristics (mean, SD)
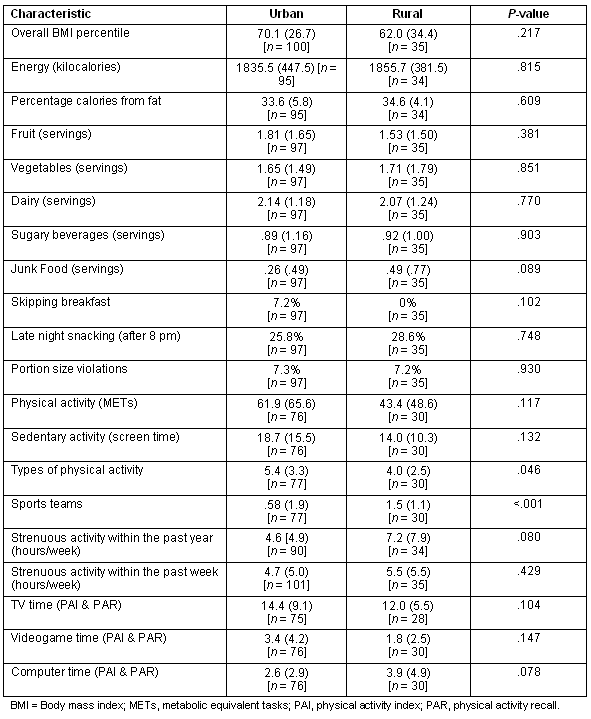
Differences between urban and rural children's dietary intake were further investigated through analyses of their daily servings of fruits, vegetables, dairy products (milk, cheese and yogurt), sugary beverages (soda and sweetened fruit drinks), and junk food (cakes, cookies, candy, and chips). Urban children consumed slightly more servings of fruit (mean = 1.81, SD = 1.65, n = 97) than rural children (mean = 1.53, SD = 1.50, n = 35; t(130) = .878, p = .381). However, rural children ate slightly more servings of vegetables (mean = 1.71, SD = 1.79, n = 35) than urban children (mean = 1.65, SD = 1.49, n = 97; t(130) = -.188, p = .851). When analyzed together, servings of fruit and vegetables were higher for urban children (mean = 3.45, SD = 2.27, n = 97) than rural children (mean = 3.26, SD = 2.36, n = 35; t(130) = .424, p = .672). The average number of dairy servings was 2.14 (SD = 1.18, n = 97) for urban children and 2.07 (SD = 1.24, n = 35) for rural children (t(130) = .293, p = .770). Rural children drank slightly more sugary beverages (mean = .92, SD = 1.00, n = 35) than urban children (mean = .89, SD = 1.16, n = 97; t(130) = -.121, p = .903). The differences between urban and rural children's consumption were minimal and did not reach statistical significance. However, the difference between urban and rural children's consumption of junk food did approach significance. Rural children ate more junk food (mean = .49, SD = .77, n = 35) than urban children (mean = .26, SD = .49, n = 97; U = 1423, p = .089).
Activity patterns
Both METs and sedentary activity were assessed across urban and rural participants. The average METs expenditure for the entire sample was 56.7 (SD = 61.6, n = 106). The average METs expenditure for children from urban schools was 61.9 per week (SD = 65.6, n = 76) and for children from rural schools was 43.4 (SD = 48.6, n = 30; t(71.5) = 1.586, p = .117). Table 2 provides more detail. Children from urban schools had slightly higher sedentary activity (mean = 18.7, SD = 15.5, n = 76) than children from rural schools (mean = 14.0, SD = 10.3, n = 30; t(104) = 1.520, p = .132). These differences in METs and sedentary activity did not reach statistical significance.
Differences between urban and rural children's physical activity patterns were further investigated through analyses of their participation in different types of physical activities, sports teams, and strenuous activity within the past year and within the past week. Urban children participated in a wider variety of physical activities (mean = 5.4, SD = 3.3, n = 77) than did the rural children (mean = 4.0, SD = 2.5, n = 30; t(105) = 2.020, p = .046). The most common physical activities for urban children were running/jogging, basketball, and walking. The most common physical activities for rural children were basketball, bicycling on streets, and dancing. However, children from rural schools played on more sports teams (mean = 1.5, SD = 1.1, n = 30) than children from urban schools (mean = .58, SD = 1.9, n = 77; t(50.0) = -4.463, p < .001). The most common sports teams were basketball, softball, and volleyball for rural children and basketball, baseball, and football for urban children. The above differences were statistically significant. Rural children also participated in higher levels of strenuous activity within the past year and within the past week. The average number of hours per week of strenuous activity within the past year was 7.2 (SD = 7.9, n = 34) for rural children and 4.6 (SD = 4.9, n = 90) for urban children (t(42.8) = -1.795, p = .080). The average number of hours per week of strenuous activity within the past week was 5.5 (SD = 5.5, n = 35) for rural children and 4.7 (SD = 5.0, n = 101) for urban children (t(134) = -.793, p = .429). The differences in strenuous activity did not reach statistical significance.
Sedentary activity was also assessed by collapsing the two measures of physical activity. Each measure was analyzed for hours per week of watching TV, playing videogames, and using the computer and then these three data points were averaged and summed for each participant to arrive at the four variables: TV time, videogame time, computer time, and total sedentary time. Total sedentary time was higher for children from urban schools (mean = 20.3, SD = 11.4, n = 75) than for children from rural schools (mean = 17.7, SD = 7.9, n = 28; t(69.5) = 1.327, p = .189). More specifically, the average number of hours per week spent watching TV was higher for urban children (mean = 14.4, SD = 9.1, n = 75) than rural children (mean = 12.0, SD = 5.5, n = 28; t(80.2) = 1.644, p = .104). Likewise, urban children also spent more time playing videogames (mean = 3.4, SD = 4.2, n = 76) than rural children (mean = 1.8, SD = 2.5, n = 30; U = 936, p = .147). The one exception to this general trend in sedentary activity is that rural children spent more time using the computer (mean = 3.9, SD = 4.9, n = 30) than urban children (mean = 2.6, SD = 2.9, n = 76; t(104) = -1.782, p = .078). The difference in TV time, videogame time, computer time, and total sedentary time did not reach statistical significance across the urban and rural participants.
Body composition
The overall BMI percentile for the entire sample was 68.0 (SD = 29.0, n = 135). The average BMI percentile for children from urban schools was 70.1 (SD = 26.7, n = 100) and for children from rural schools was 62.0 (SD = 34.4, n = 35; t(49.0) = 1.250, p = .217). Table 2 provides more detail. Of the urban children in this sample, 44.0% were classified as either overweight or at-risk for overweight (20.0% overweight; 24.0% at-risk for overweight) and the remaining 56.0% had a BMI below the 85th percentile. In the rural sample of children, 42.8% were considered either overweight or at-risk for overweight (25.7% and 17.1%, respectively) and the remaining 57.1% had a BMI below the 85th percentile. The differences between urban and rural samples in terms of the percentage of participants in each BMI category were not found to be statistically significant (χ2(2, N =135) = .949, p = .622).
Discussion
The current project describes the assessment of health behaviors and weight status among urban and rural children. This is an important contribution to the literature in that previous studies have not reported on the specific health behaviors that contribute to problems with weight status such as eating habits and exercise habits.
Nutrition analyses indicated that rural and urban children consumed equivalent calories and equivalent percentage of calories from fat. Also, urban children were more likely to consume fruits rather than vegetables, and rural children were just the opposite, more likely to consume vegetables rather than fruits. Both groups consumed approximately two servings of dairy per day which is below the United States Department of Agriculture recommendation for children of three servings per day. Rural children ate more junk food than urban children, and urban children were more likely to skip breakfast than rural children.
Physical activity analyses indicated METs were lower for participants in rural schools, suggesting children in the urban schools engaged in more physical activity than children in rural schools. Interestingly, though, the same measures also indicated that children from urban areas engaged in higher rates of sedentary activity than children from rural schools. Although these two pieces of data may seem to conflict, it is possible that children from rural areas were engaging in activities that are not covered by traditional physical activity assessments, such as caring for animals or doing other farm based activities. Therefore, the urban children would receive higher scores on the measures simply because the physical activity measures applied more to their activities, whereas the rural children would score lower because the measures did not capture how they were likely to spend their time. Urban children engaged in a higher number of physical activities, but rural children engaged in more strenuous activity and were more likely to play on a sports team. This was a somewhat surprising finding as we had predicted rural children would be less likely to play on sports teams due to the long travel times between school and home. Regarding sedentary activity, urban children engaged in more sedentary activity, particularly with TV and video games, and rural children tended to spend more time on the computer. This, again, was a surprising finding as we had anticipated rural settings would have more trouble procuring internet services, a major reason children spend time on the computer. Future research will need to further assess this relationship between sedentary activity habits and rural/urban status.
Regarding BMI, one interesting finding was that urban children who were over the 85th percentile were more likely to be in the at risk for overweight category, and rural children who were over the 85th percentile were more likely to be in the overweight category. This finding could have a number of explanations. It is possible that children in the rural sample simply reach the overweight category at a younger age, and that children in the urban sample who are on their way to being overweight are still falling into the at risk for overweight category. Alternatively, it could be that there is some environmental or behavioral variable that protects urban children from reaching the overweight category but rather maintains them in the at risk for overweight category. Future research is necessary to explore these hypotheses.
Implications for rural intervention
Our findings indicate that traditional weight loss interventions that have been primarily studied on children in urban areas may need to be altered for use with rural children. Interventions specifically targeting rural children who are overweight may need to focus on the heaviest children, as our data indicate children in rural areas over the 85th percentile were more likely to fall into the overweight category. Children in rural schools were quite active, but their variety of activities was somewhat limited, so increasing variety of activities may be important. Regarding eating habits, children from rural areas may need more information on decreasing junk food at snacks, decreasing late night snacking and portion size violations (particularly with cereal and milk) as our data indicate rural children were likely to engage in these unhealthy behaviors.
Limitations
There are several limitations to the current study. First, our urban and rural groups were not balanced on race or socio-economic status, and we were not able to control for these differences statistically due to lack of power. Recruiting balanced samples on race alone would have required extensive efforts, as population statistics indicate that 93.5% of rural school children are Caucasian, while only 12.5% of urban children are Caucasian. There are numerous data to indicate that health behaviors do significantly differ among individuals with different racial and ethnic backgrounds, so our results should be interpreted with caution given this limitation26-28. Second, our sample sizes were small and we could have been insufficiently powered to detect meaningful differences between groups. Small sample sizes were predominantly due to marginal participation rates. Participation rates were acceptable at three schools given that active parental consent was required, but were very low at a fourth school (one of our urban schools). We believe the participation rates were poor at this school because the nurse was unable to disperse all of the recruitment flyers as planned, and did not give parent reminders. Also, there were fewer rural children than urban children who participated. Although rates of participation were equal across the two groups, there are simply fewer children in rural schools. Finally, our measures of diet and physical activity were self-reported. Although these self-reported measures are commonly used in the literature and have demonstrated acceptable reliability and validity, they still have many limitations.
Future research
Although the current study is a valuable contribution to the early literature on differences in weight status and health behaviors among urban and rural children, much future research is needed. First, future researchers should increase sample sizes by partnering with rural researchers from other sites. Second, researchers would be wise to use the new objective measures of physical activity. Third, researchers should apply qualitative measurement techniques to the question of differences in weight status and health behaviors among urban and rural children by conducting focus groups or structured interviews to determine how weight loss barriers differ across these two groups of children. Addressing these issues will lead to important information that can in turn be used to modify existing obesity interventions to meet the needs of these two unique groups of children.
Acknowledgements
This research was funded in part by the Sunflower Foundation: Health Care for Kansans. The authors thank the Sunflower Foundation for this support, and all the participant families.
References
1. Strauss RS, Pollack HA. Epidemic increase in childhood overweight, 1986-1998. The Journal of the American Medical Association 2001; 286(22): 2845-2848.
2. Strauss RS. Childhood obesity. Pediatric Clinics of North America 2002; 49: 175-201.
3. Troiano RP, Flegal KM, Kucamarski RJ, Campbell SM, Johnson CL. Overweight prevalence and trends for children and adolescents: The National Health and Nutrition Examination Surveys 1963 to 1991. Archives of Pediatric and Adolescent Medicine 1995; 149: 1085-1091.
4. Stark O, Atkins E, Wolff OH, Douglas JWB. Longitudinal study of obesity in the National Survey of Health and Development. BMJ 1981; 337: 13-17.
5. Whitaker RC. Predicting obesity in young adulthood from childhood and parental obesity. The New England Journal of Medicine 1997; 337: 869-873.
6. Dietz W. Health consequences of obesity in youth: childhood predictors of adult disease. Pediatrics 1998; 101(Suppl): 518s-525s.
7. Must AS, Strauss RS. Risks and consequences of childhood and adolescent obesity. International Journal of Obesity and Related Metabolic Disorders 1999; 23(Suppl 2): S2-S11.
8. Ogden CL, Troiano RP, Briefel RR, Kuczmarski RJ, Flegal KM, Johnson CL. Prevalence of overweight among preschool children in the United States, 1971 through 1994. Pediatrics 1997; 99: e1.
9. Jackson JE, Doescher MP, Jerant AF, Hart LG. A national study of obesity prevalence and trends by type of rural county. The Journal of Rural Health 2005; 21: 140-148.
10. Patterson PD, Moore CG, Probst JC, Shinogle JA. Obesity and physical inactivity in rural America. The Journal of Rural Health 2004; 20: 151-159.
11. Mustillo S, Worthman C, Erkanli A, Keeler G, Angold A, Costello EJ. Obesity and psychiatric disorder: Developmental trajectories. Pediatrics 2003; 111: 851-859.
12. Muratova VN, Demerath EW, Spangler E, Ogershok P, Elliott E, Minor VE et al. The relation of obesity to cardiovascular risk factors among children: The CARDIAC Project. The West Virginia Medical Journal 2002; 98: 263-267.
13. McMurray RG, Harrell JS, Bangdiwala SI, Deng S. Cardiovascular disease risk factors and obesity of rural and urban elementary school children. The Journal of Rural Health 1999; 15: 365-374.
14. Thorpe LE, List DG, Marx T, May L, Helgerson SD, Frieden TR. Childhood obesity in New York City elementary school students. American Journal of Public Health 2004; 94: 1496-1500.
15. Welch C, Gross SM, Bronner Y, Dewberry-Moore N, Paige DM. Discrepancies in body image perception among fourth-grade public school children from urban, suburban, and rural Maryland. Journal of the American Dietetic Association 2004; 104: 1080-1085.
16. Jelalian E, Saelens BE. Empirically supported treatments in pediatric psychology: pediatric obesity. Journal of Pediatric Psychology 1999; 24: 223-248.
17. US Census Bureau. Census 2000: urban and rural classification. (Online) 2007. Available: http://www.census.gov/geo/www/ua/ua_2k.html (Accessed 13 December 2004).
18. Daniels LA. Collection of dietary data from children with cystic fibrosis: some problems and practicalities. Human Nutrition 1984; 38: 110-118.
19. St. Jeor ST, Guthrie HA, Jones MB. Variability in nutrient intake in a 28-day period. Journal of the American Dietary Association 1983; 83: 155-162.
20. Sallis JF, Condon SA, Goggin KJ, Roby JJ, Kolody B, Alcaraz JE. The development of self-administered physical activity surveys for 4th grade students. Research Quarterly for Exercise and Sport 1993; 64(1): 25-31.
21. Ainsworth BE, Haskell WL, Leon AS, Jacobs DR Jr, Montoye HJ, Sallis JF et al. Compendium of physical activities: classification of energy costs of human physical activities. Medicine and Science in Sports and Exercise 1993; 25(1): 71-80.
22. Frank GBG, Schiling P, Moore M. Adapting the 24-hr recall for epidemiologic studies of school children. Journal of the American Dietetic Association 1977; 71: 26-31.
23. Centers for Disease Control and Prevention. BMI - body mass index for children and teens. (Online) 2007. Available: http://www.cdc.gov/nccdphp/dnpa/bmi/childrens_BMI/about_childrens_BMI.htm (Accessed 9 April 2008).
24. Cole TJ, Faith MS, Pietrobelli A, Heo M. What is the best measure of adiposity change in growing children: BMI, BMI %, BMI z-score or BMI percentile? European Journal of Clinical Nutrition 2005; 59: 419-425.
25. Interagency Board for Nutrition Monitoring and Related Research. Nutrition Monitoring in the United States: The Directory of Federal and State Nutrition Monitoring Activities, DHHS publication po. (PHS) 92-1255-1. Public Health Service, MD: Interagency Board for Nutrition Monitoring and Related Research, 1992.
26. Affenito SG, Thompson DR, Franko DL. Longitudinal assessment of micronutrient intake among African-American and white girls: The National Heart, Lung, and Blood Institute Growth and Health Study. Journal of the American Dietetic Association 2007; 107: 1113-1123.
27. Deshmukh-Taskar P, Nicklas TA, Yang SJ, Berenson GS. Does food group consumption vary by differences in socioeconomic, demographic, and lifestyle factors in young adults? The Bogalusa Heart Study. Journal of the American Dietetic Association 2007; 107: 223-234.
28. Pate RR, Stevens J, Pratt C, Sallis JF, Schmitz KH, Webber LS et al. Objectively measured physical activity in sixth-grade girls. Archives of Pediatric and Adolescent Medicine 2006; 160: 1262-8.
Original Research
Health behaviors and weight status among urban and rural children
AUTHORS

Ann Davis1 PhD, Associate professor *

Richard Boles2 PhD, Postdoctoral fellow

Rochelle L James3 MA, Graduate student

Debra K Sullivan4 PhD, RD, Associate professor

Joseph E Donnelly5 PhD, Professor

Deborah L Swirczynski6 MA, Research associate

Jeannine Goetz7 MS, RD, Research associate
CORRESPONDENCE
* Ann Davis
AFFILIATIONS
1 University of Kansas Medical Center, Department of Pediatrics, Kansas City, Kansas, USA
2 Cincinnati Children's Hospital Medical Center, Department of Psychology, Cincinnati, Ohio, USA
3 University of Kansas, Clinical Child Psychology Program, Lawrence, Kansas, USA
4 University of Kansas Medical Center, Department of Dietetics & Nutrition, Kansas City, Kansas, USA
5 University of Kansas, Energy Balance Laboratory, Center for Physical Activity and Weight Management, Lawrence, Kansas, USA
6 University of Kansas Medical Center, Center for Telemedicine and Telehealth, Kansas City, Kansas, USA
7 University of Kansas Medical Center, Department of Dietetics and Nutrition, Kansas City, Kansas, USA
PUBLISHED
15 April 2008 Volume 8 Issue 2
HISTORY
RECEIVED: 26 June 2007
REVISED: 11 January 2008
ACCEPTED: 15 April 2008
CITATION
Davis A, Boles R, James RL, Sullivan DK, Donnelly JE, Swirczynski DL, Goetz J. Health behaviors and weight status among urban and rural children. Rural and Remote Health 2008; 8: 810. https://doi.org/10.22605/RRH810
AUTHOR CONTRIBUTIONS
© Ann Davis, Richard Boles, Rochelle L James, Debra K Sullivan, Joseph E Donnelly, Deborah L Swirczynski, Jeannine Goetz 2008 A licence to publish this material has been given to ARHEN, arhen.org.au
Abstract
Introduction: Pediatric overweight is currently reaching epidemic proportions but little information exists on differences in weight related behaviors between urban and rural children. Objective: To assess health behaviors and weight status among urban and rural school-age children.
Methods: Fifth-grade children at two urban and two rural schools were invited to participate in an assessment study of their health behaviors and weight status. A total of 138 children (mean age = 10 years; % female = 54.6) chose to participate.
Results: Children in rural and urban areas consumed equivalent calories per day and calories from fat, but rural children ate more junk food and urban children were more likely to skip breakfast. Urban children engaged in more metabolic equivalent tasks and had slightly higher total sedentary activity than rural children. The BMI percentile was equivalent across rural and urban children but rural children were more often overweight and urban children were more often at risk for overweight.
Conclusions: Although some variables were equivalent across urban and rural children, results indicate some key health behavior differences between groups. Results should be interpreted with caution as the sample size was small and there were demographic differences between urban and rural samples.
Key words: health behaviors, pediatric obesity.
You might also be interested in:
2010 - Parental attitudes towards childhood immunizations in Eastern Uganda