

full article:
Introduction
Economic growth and development have brought rural populations to urban cities1. In the early 1960s, the global rural population was twice the size of the urban population. In 2007, for the first time, more than half of the world’s population lived in urban areas. This increased to around 56% in 20192,3. This migration from rural to urban areas is known as urbanization, a dynamic process driven by the notion of a better quality of life and opportunities4.
Urbanization has widely impacted the lives of people in rural populations, leading to inequalities in several aspects, mostly health related5-7. It is estimated that 56% of rural residents worldwide have no official health coverage, compared to 22% of those in urban locations. Only 23% of the healthcare workers are allocated to rural areas, compromising health coverage of rural populations8.
Researchers usually neglect rural settings and, although some efforts have been made, studies about the rural–urban divide are scarce and fragmented9. Regarding physical activity (PA), the scenario is similar. Even though PA is among the main risk factors for non-communicable diseases10, little research has been conducted to compare this behavior between rural and urban settings, especially in low- and middle-income countries. The same pattern is observed for sedentary behavior, mainly because of the misleading notion that rural populations are less sedentary than urban ones, when in fact, rural individuals could be more likely to watch TV for more than 2 hours or to engage in other types of sedentary behavior11.
In a study compiling PA data from 47 low- and middle-income countries using the short form of the International Physical Activity Questionnaire, results showed that individuals living in urban areas were 27% more likely to be physically inactive than individuals living in rural areas12. Although this is an important finding when comparing rural and urban settings, it was limited to analyzing total PA levels12,13. A study in the USA found a pattern of more time spent in PA for both men and women living in rural areas than for non-rural populations14. A study in Canada found that rural participants presented an odds ratio for being very active that was 1.19 times higher than for non-rural participants15. It is important to highlight that these studies used a measure for the total level of PA and did not investigate domain-specific differences (occupational, domestic, commuting, leisure time, or TV viewing/sedentary behavior). Consequently, this total PA could reflect commuting and/or work-related activities and not leisure time.
In Brazil, one of the biggest low- and middle-income countries, studies comparing PA and sedentary behavior levels between urban and rural areas generally focus on specific regions or communities16-18, lacking comprehensive national estimates of PA and its domains. Thus, there is a need for national-based evidence on rural and urban differences for PA. The present study aimed to compare differences in PA indicators and TV viewing according to the location of residence and sociodemographic variables in Brazil.
Methods
Study design
A cross-sectional, population-based study using data from the Brazilian National Health Survey was conducted in 2013 in a partnership between the Brazilian Institute of Geography and Statistics and the Ministry of Health. The sample represents residents of permanent households located in urban or rural areas from the five geographic regions, 27 Federation Units, and capitals and municipalities. This survey aims to estimate the prevalence of major chronic diseases and risk factors, verify characteristics of the health care system, evaluate mothers’ and children’s health and identify determinants of social stratification19-21.
Sampling was defined by simple random selection in three stages: census tracts/clusters (first-stage units), households (second-stage units) and respondents (third-stage units). Sample size calculation considered the following parameters: estimates of proportions with a 95% confidence interval, design effect (as it is a cluster sampling in multiple stages), number of selected households by cluster and proportion of households with individuals in the age group of interest19-21. After adding 20% for losses and refusals, the total sample size needed was 63 900. To be included in the sample, the selected participant should be 18 years or older (adulthood in Brazil) and be a resident of the household.
Trained interviewers asked one randomly selected resident in each household about sociodemographic characteristics and health-related behaviors. Data collection was performed using hand computers (personal digital assistants). For all sampling units (sectors, households and residents), expansion factors or sample weights were defined. Further details on the sampling process or data collection can be found elsewhere20,21.
Physical activity indicators and TV viewing
Information about the practice of PA in leisure time, commuting, work and domestic activities, reflecting the four domains of PA, was collected by face-to-face interviews. The participants were asked the following questions:
- for leisure-time PA: In the past three months, have you practiced any physical activity or sport (not physiotherapy)?
- for commuting PA: When you commute to work, do you walk or bike in any part of the route? And in your daily routines (such as going or taking someone to school, club, etc.), how many days a week do you do any walking or biking activities?
- for work PA: At work, do you do heavy cleaning, carry heavy weights, or any other strenuous activity that requires intense physical effort?
- for domestic PA: In your domestic activities, do you do heavy cleaning, carry heavy weights, or do any other strenuous activity that requires intense physical effort?
Individuals answering positively to any of these questions were asked how many days they practiced and how long. A score resulting from time multiplied by frequency was generated. For TV viewing, the interviewees were asked, ‘On average, how many hours a day do you usually watch television?’ This was categorized as less than 3 hours, or 3 hours or more. The following indicators were generated22:
- leisure-time PA: proportion of individuals who practiced at least 150 minutes of light to moderate leisure-time PA or at least 75 minutes of vigorous leisure-time PA in a week
- commuting PA: proportion of individuals who spent at least 30 minutes in commuting PA. (The 30 minute-period was used assuming that commuting for work/school occurs at least 5 days a week, reaching 150 min/week.)
- work PA: proportion of individuals who spent at least 150 min/week of work-related moderate-to-vigorous PA
- domestic PA: proportion of individuals who spent at least 150 min/week in domestic moderate-to-vigorous PA
- total PA: proportion of participants reaching 150 min/week of PA considering leisure time, commuting, work and domestic activities
- TV viewing: proportion of participants who spent at least 3 hours/day watching TV.
The cut-off for physical activity variables was based on WHO23 recommendations, while the cut-off for TV viewing was based on previous research24-26 . The questionnaire used for PA and TV viewing is widely used in Brazilian surveys. In comparison with the Global Physical Activity Questionnaire, the instrument used in this research presented a kappa above 0.6 for total and leisure-time PA. At the same time, agreement was regular to moderate for the other domains27.
Stratifiers
Sex (male or female), age (18–24, 25–29, 30–39, 40–49, 50–59 or ≥60 completed years of age), wealth index (quintiles) and location of residence (urban or rural) were included as stratifying variables. The age categories were based on data distribution. Wealth index was built using principal component analysis, based on data about schooling level of the head of the family, number of rooms and bathrooms in the household, monthly maid/domestic employee, and assets (piped water, color television, refrigerator, DVD player, washing machine, landline, mobile phone, microwave oven, computer, motorcycle, internet access and number of cars)28. The location of residence was previously defined by the Brazilian Institute of Geography and Statistics as urban or rural29. The urban area includes cities (municipal headquarters) and villages (district headquarters) or isolated urban clusters. Rural areas are all locations other than those defined as urban.
Statistical analysis
First, the total sample was described and stratified by location (urban or rural). A comparison between PA indicators and TV viewing according to location of residence was carried out. Then, equiplots for intersectionalities of area and sex, wealth quintiles, age and geographic region were presented. The χ2 test and a 95% confidence interval were used to compare the proportions in each stratified category. Supplementary material includes tables with all estimates used in equiplots. All analyses were carried out in Stata v16 (StataCorp; http://www.stata.com), considering sample weights by using the svy command.
Ethics approval
The National Research Ethics Commission approved this project under protocol number 10853812.7.0000.0008. All participants signed an informed consent form.
Results
Of the 60 202 respondents, only 13.8% lived in rural areas. Participants living in rural areas were more likely to be male and belong to the poorest wealth quintile than individuals living in urban areas (Table 1).
Prevalence of total PA, domains of PA and TV viewing according to the location of residence are presented in Figure 1. Nearly 60% of adults living in urban areas were active, and this prevalence was slightly lower among those from rural areas (57.4%). Individuals from rural areas were less active during leisure time but were more active at work. No significant differences between rural and urban areas were observed in commuting and domestic PA (Figure 1 and Supplementary figure 1).
Differences in the prevalence of PA and TV viewing between rural and urban areas stratified by sex are presented in Figure 2 and Supplementary table 1. Leisure-time PA was more prevalent in males from both urban and rural areas. For both sexes, prevalence of leisure-time PA was about 10 percentage points higher in urban than rural areas. Commuting PA prevalence was very similar for both sexes and areas. Work PA was more frequent among males than females. While work PA prevalence among females was less than 10% in both areas, 20% of males from urban areas and 30% of males from rural areas were considered active. On the other hand, domestic PA was more frequent for females but with similar prevalence between areas, while TV viewing was higher in females from urban areas.
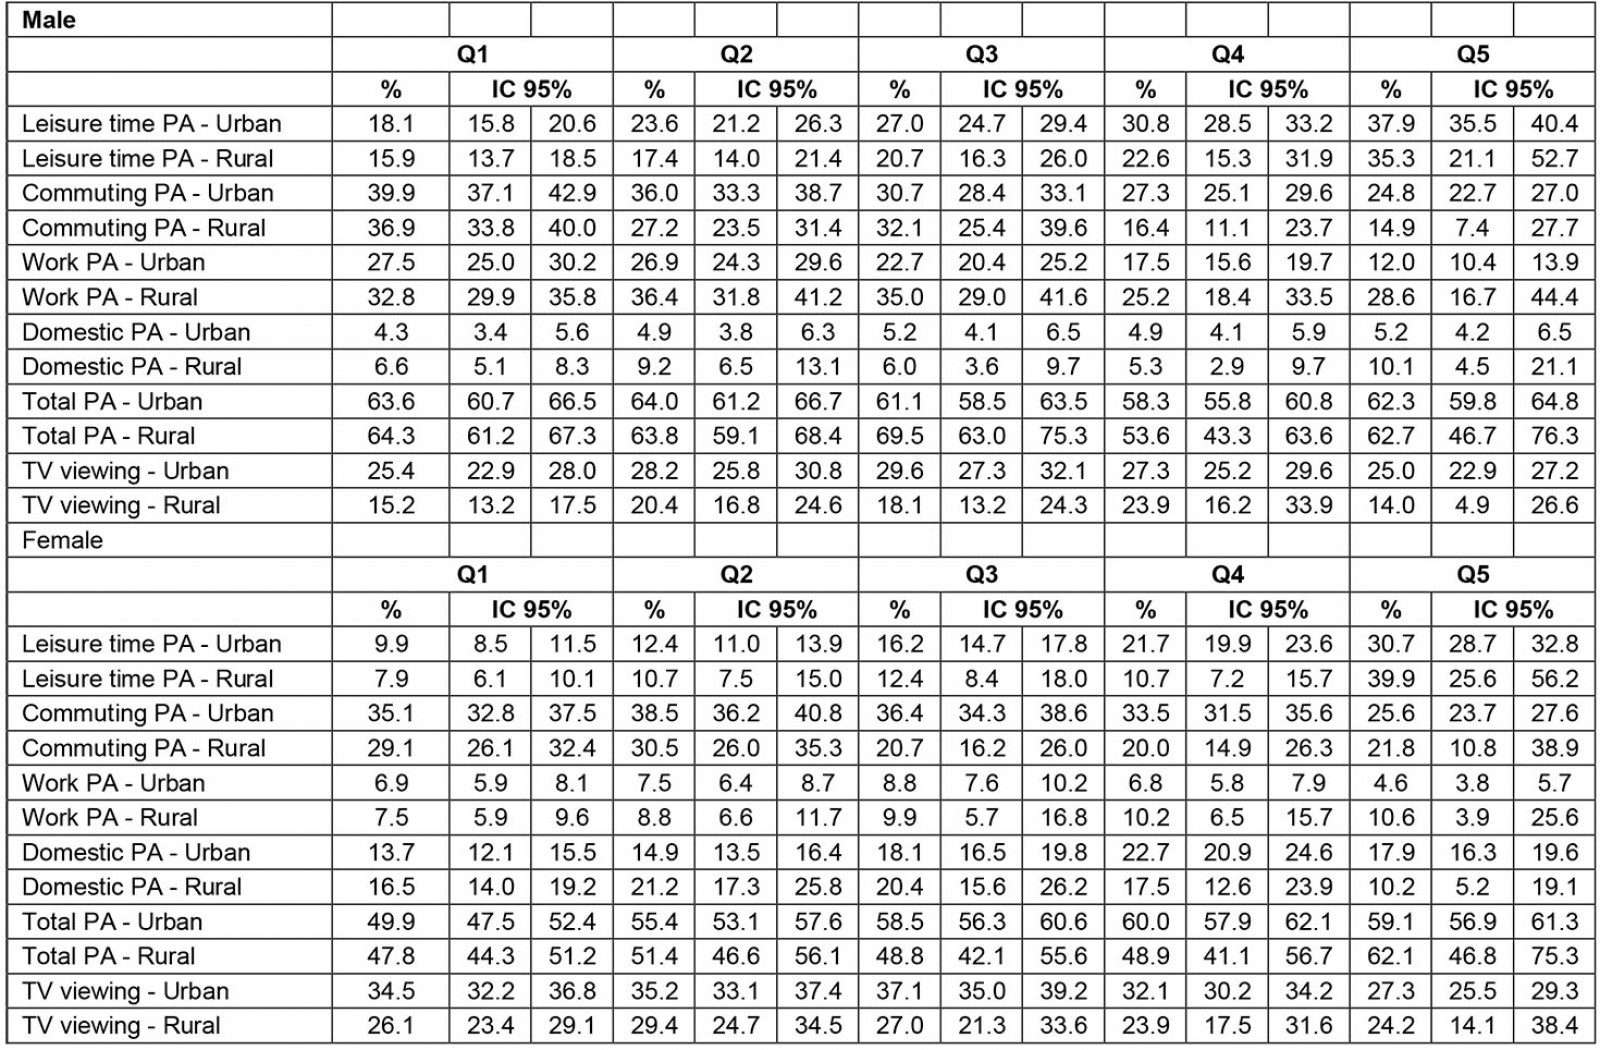
PA domains and TV viewing according to sex, wealth index and location of residence are shown in Figure 3 and Supplementary table 2. Differences in PA domains between quintiles of wealth index were larger in rural areas. Among males, leisure-time PA was directly associated with wealth index. Commuting PA increases as wealth index decreases. Males from lower quintiles of wealth index presented the highest work PA prevalence, with differences pronounced for urban areas. Among females, leisure-time PA prevalence was considerably higher in those from the richest wealth index quintile, particularly in rural areas (7.9% in the poorest versus 40% in the richest). In urban areas, females from the richest wealth quintile presented the lowest commuting PA prevalence.
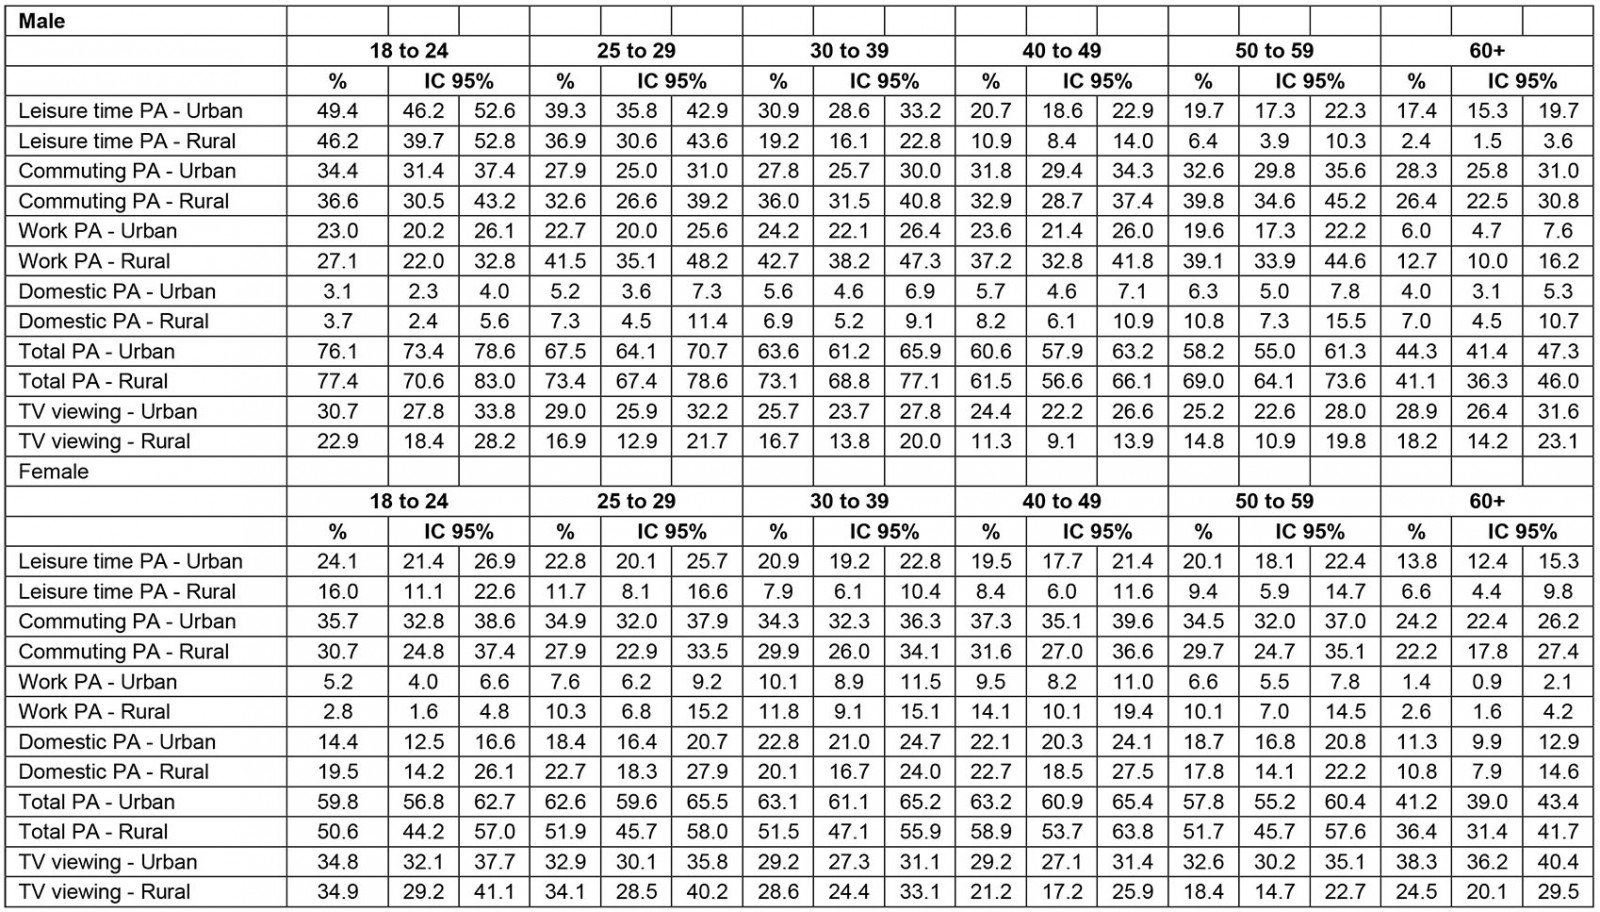
Age differences in PA indicators and TV viewing according to sex and location of residence are presented in Figure 4 and Supplementary table 3. Leisure-time PA, work-based PA and total PA were higher among younger individuals than older ones, regardless of sex and location of residence. Among males, the largest PA differences according to age were observed in rural areas for leisure time. There was a 43.8 percentage point difference in the prevalence of leisure-time PA between the youngest and oldest groups (46.2% among those aged 18–24 years and 2.4% among those aged ≥60 years). Work PA in males was twice as high among old individuals from rural areas than those from urban areas (12.8% and 6.0%, respectively). Age differences in PA among females presented a similar pattern observed in males, yet the magnitude of differences was less pronounced for females than males.
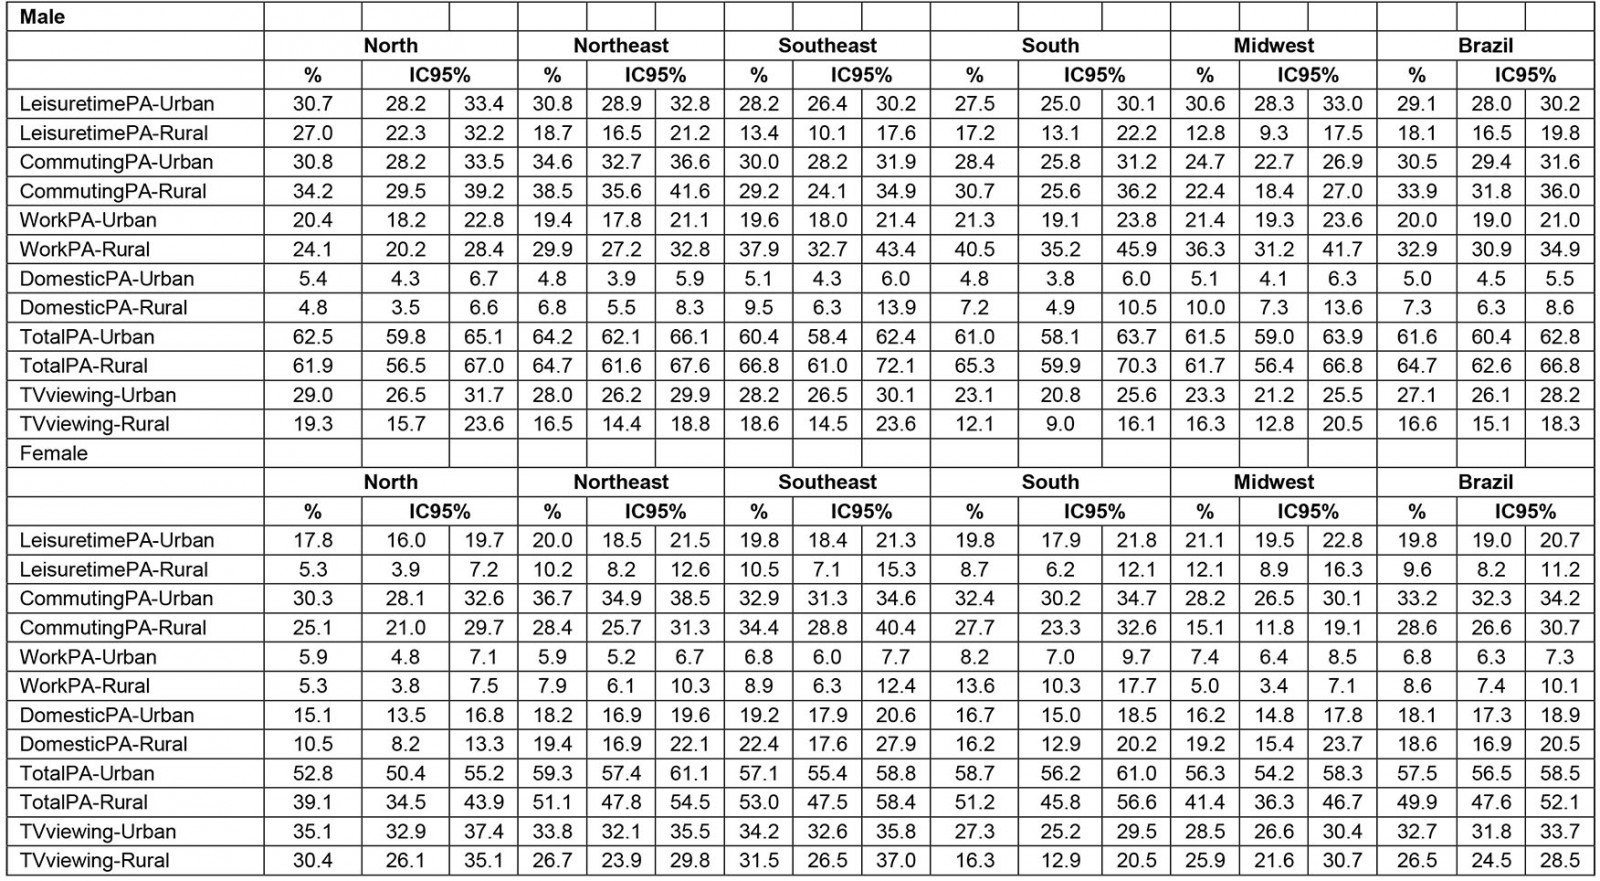
Supplementary figure 1 and Supplementary table 4 present PA indicators and TV viewing according to sex, residence area and location of residence. In males, differences in PA domains between locations of residence were less pronounced for the North region. In contrast, differences in total PA between areas of residence were more evident in the Southeast and South regions, with rural males presenting a higher percentage. Among females, higher differences in total PA between areas of residence were observed in the North and Midwest regions, where rural females showed a lower percentage.
Table 1: Sample distribution (n=60 202)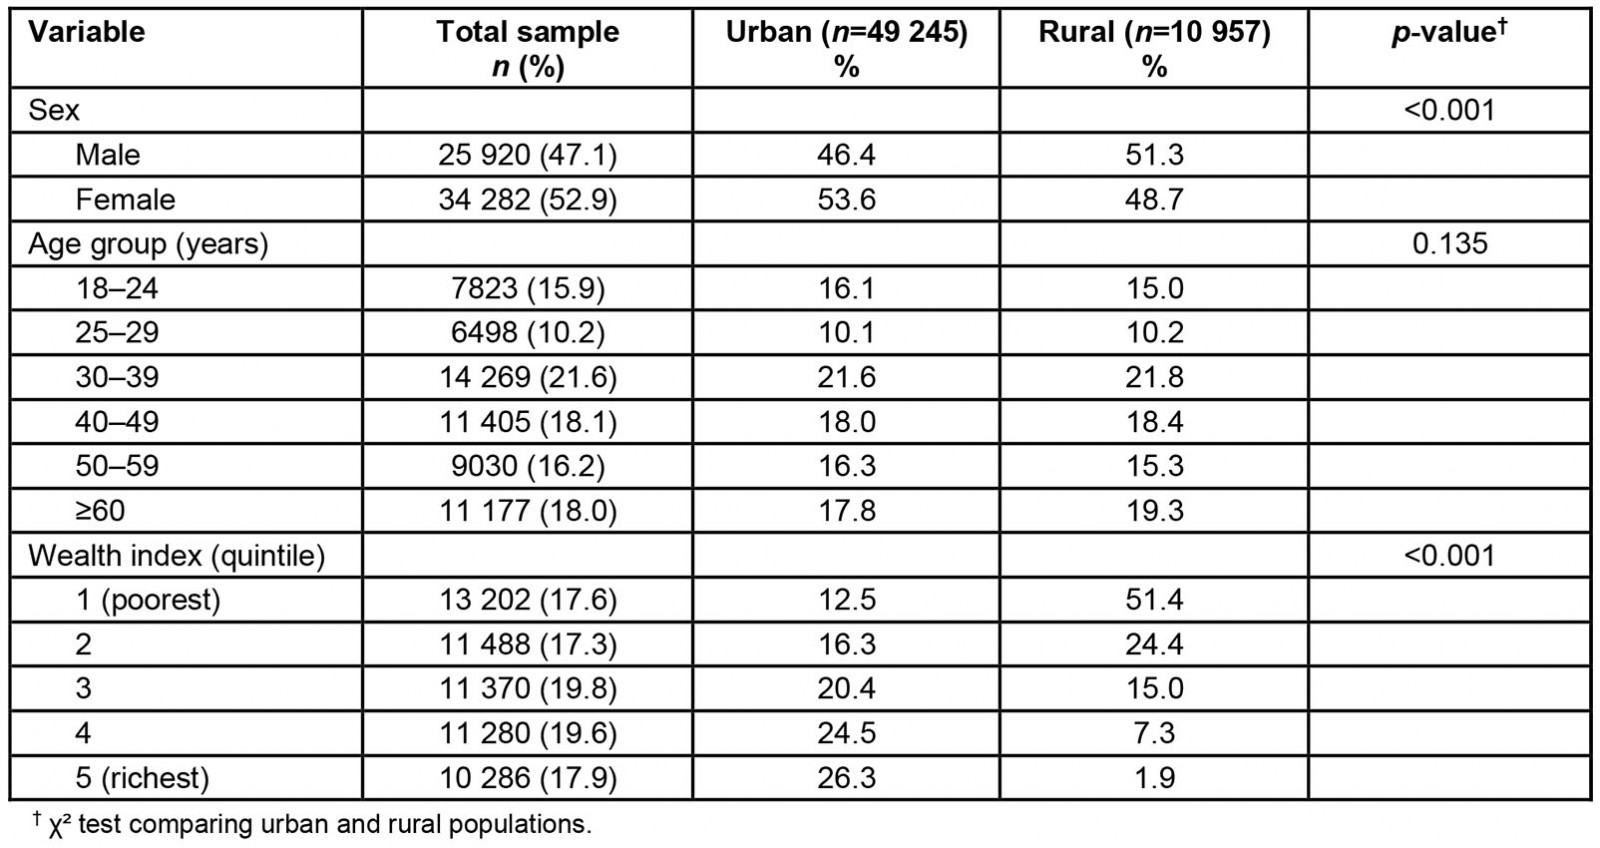
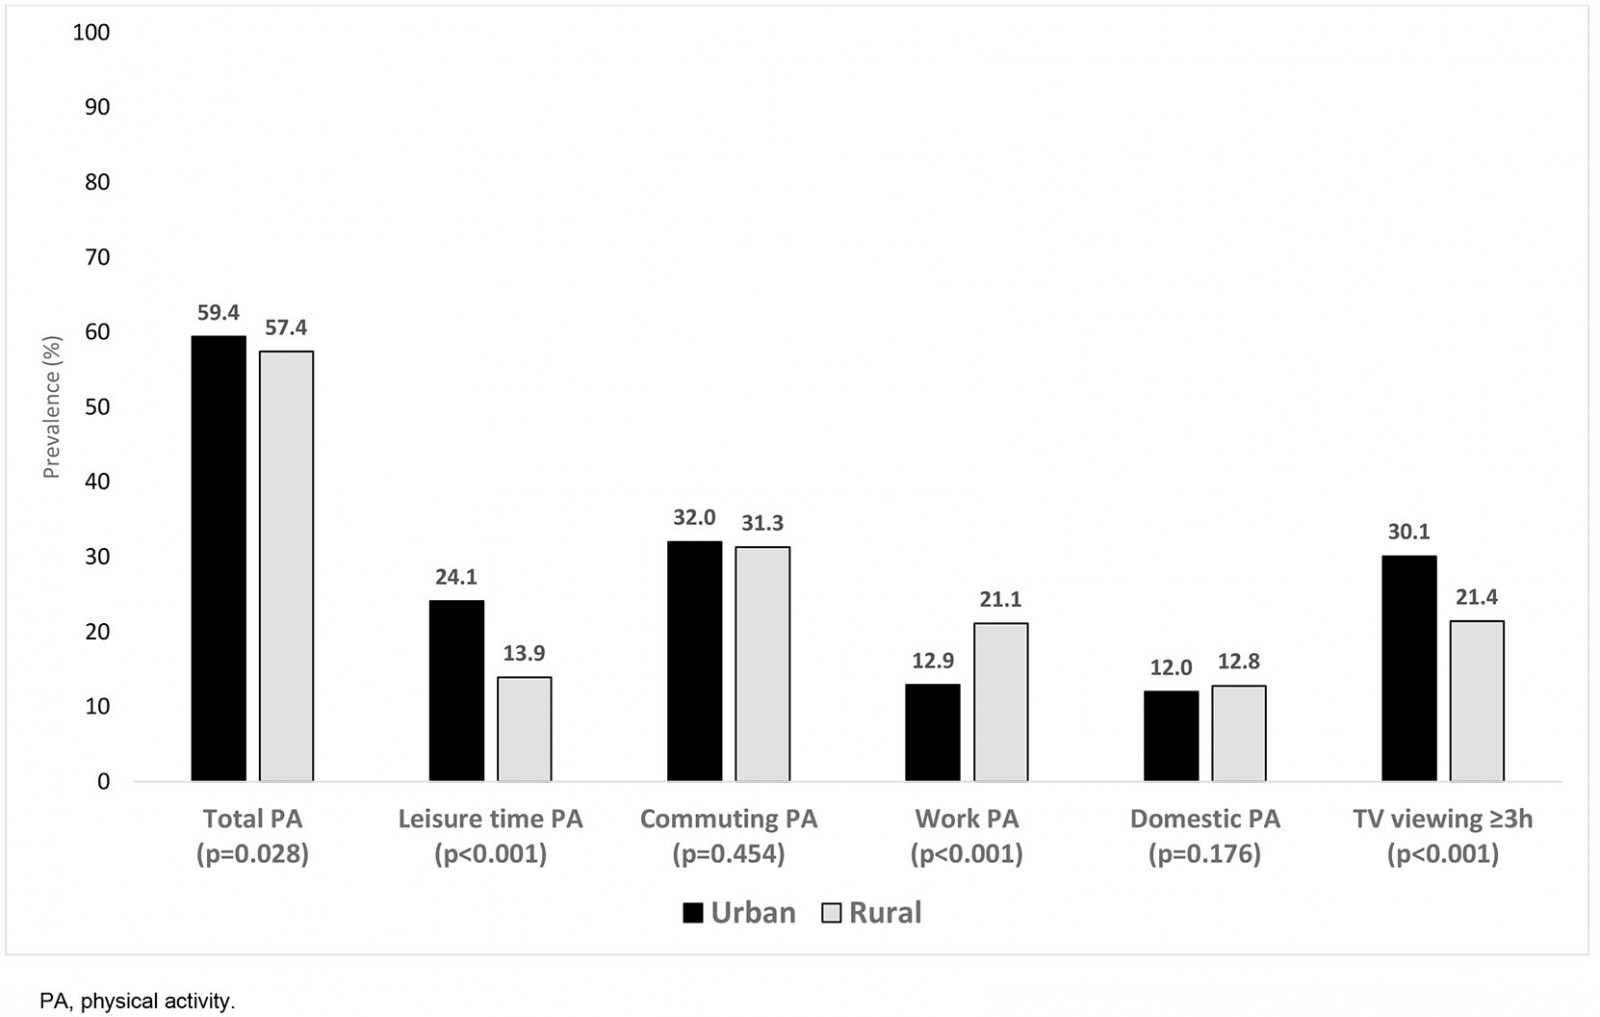 Figure 1: Physical activity indicators and TV viewing for total sample according to residence areas, Brazil, 2013.
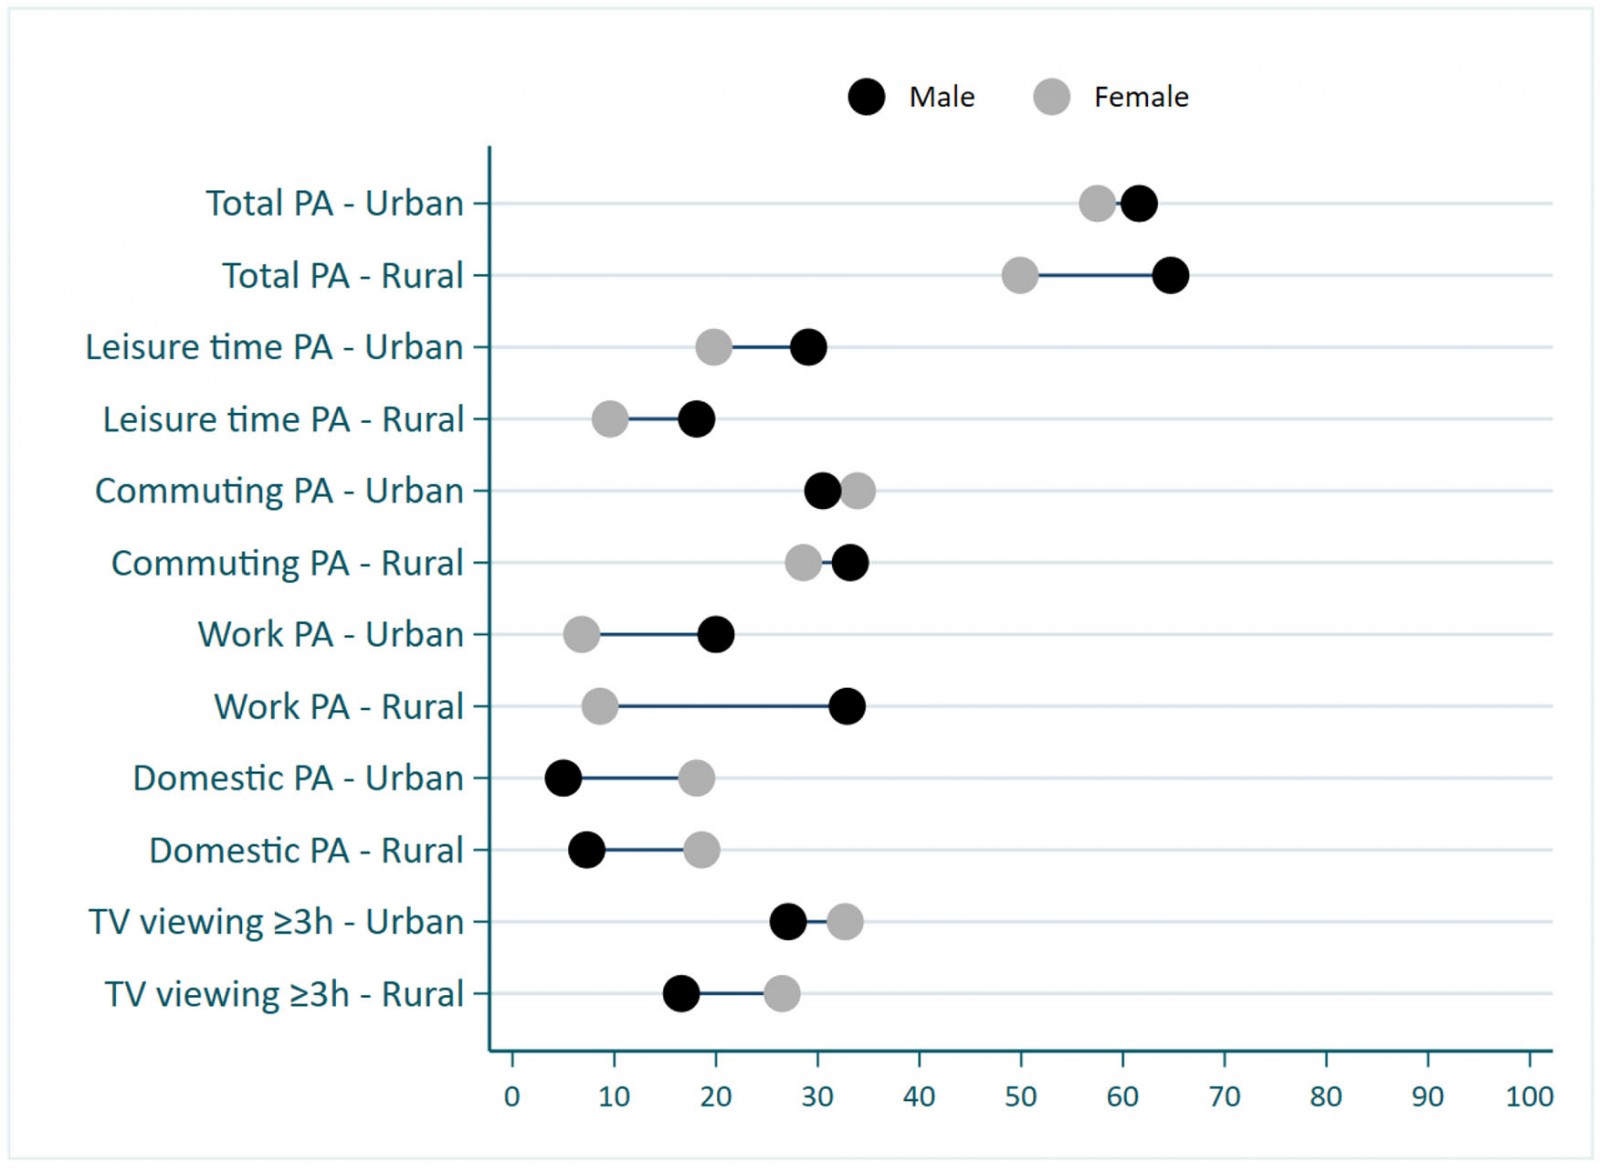 Figure 2: Physical activity indicators and TV viewing according to sex and residence area, Brazil, 2013.
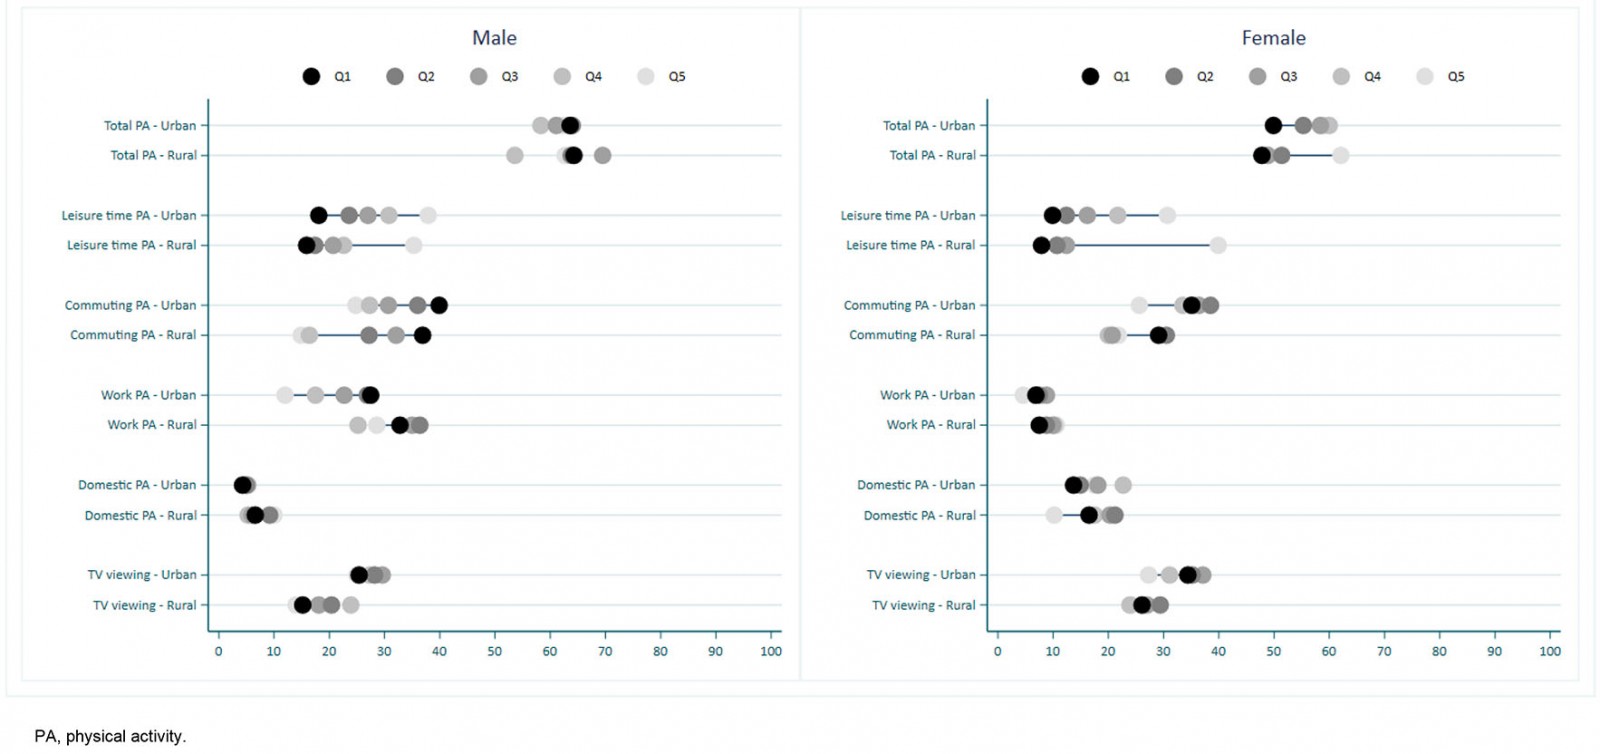 Figure 3: Physical activity indicators and TV viewing according to sex, wealth quintile and residence area, Brazil, 2013.
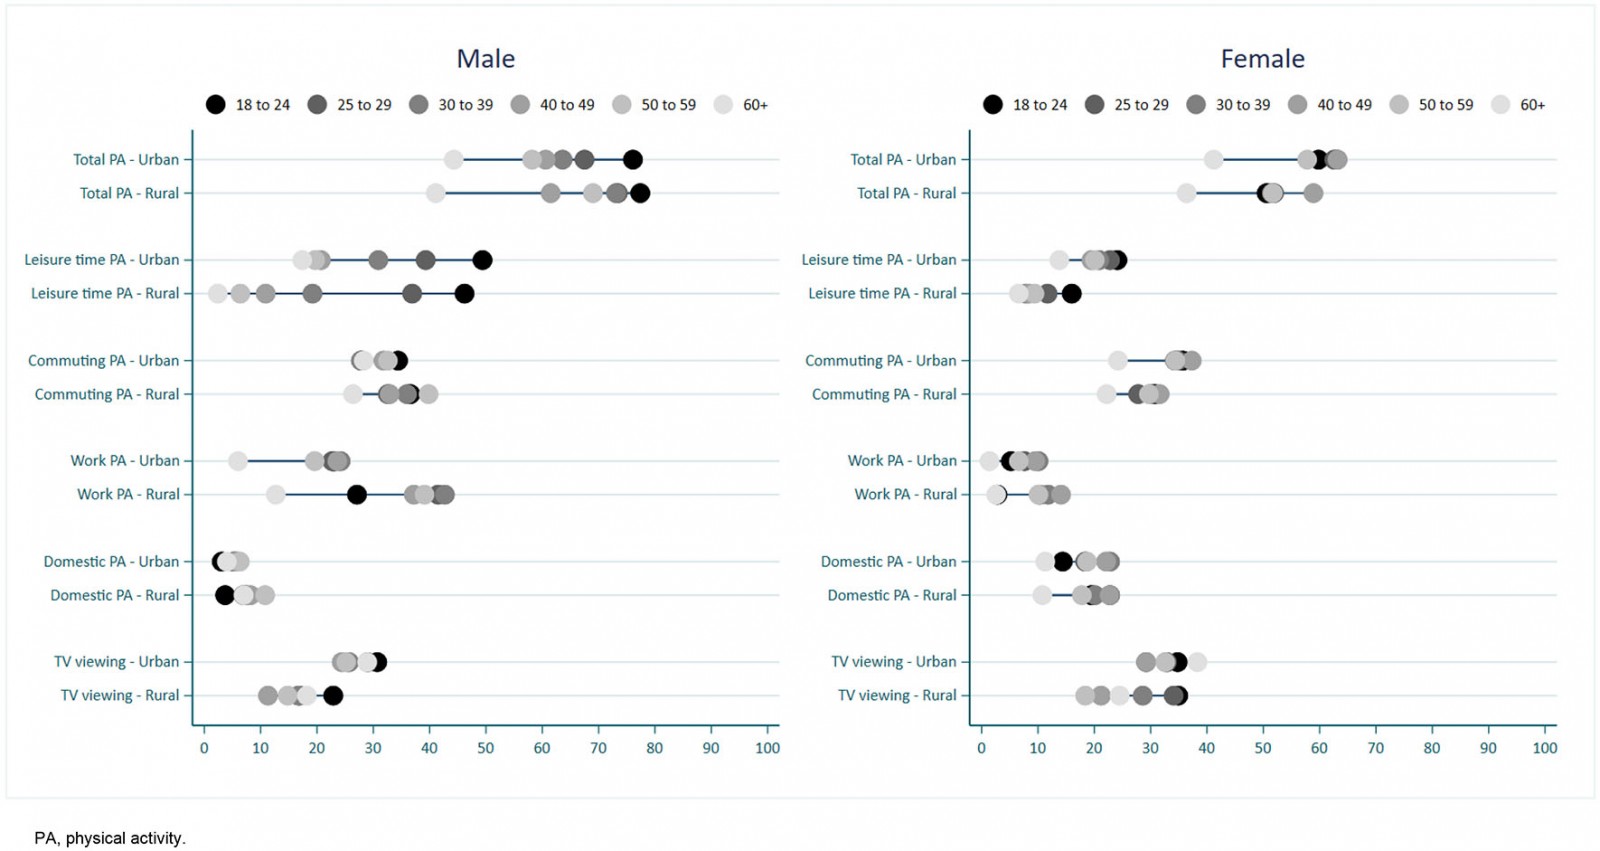 Figure 4: Physical activity indicators and TV viewing according to sex, age group and residence area, Brazil, 2013.
Discussion
This study described differences in PA between rural and urban areas. As demonstrated in previous studies, the findings of this work show that the magnitude and direction of differences in PA levels between rural and urban areas vary according to PA domains. Total, occupational, commuting and domestic PA prevalences were similar between rural and urban areas. However, leisure-time PA and TV viewing were markedly higher in urban areas, and work-based PA was higher in rural areas. The differences found in this study were enhanced by sex, age and wealth. This study also shows that males, the richest and the youngest groups spent more time in PA, but the magnitude of disparities was higher for leisure-time PA.
Total PA estimates were similar between urban and rural areas. Total PA is an indicator that may hide differences when comparisons within domains and sociodemographic variables are not carried out. A previous study with the Brazilian population showed that the prevalence of leisure-time PA is more common in males and wealthier groups30. However, these differences do not consider the intersectionality of locations of residence. A study in the rural area of a southern city in Brazil also showed a large prevalence difference among rural residents according to PA domains, with 84% in total PA, 75% in work PA, and 15% in leisure-time PA17. This difference highlights the need for exploratory analysis of PA domains according to different stratifiers.
The literature consistently demonstrates sex disparities in PA31. The present findings highlight that the PA gap between males and females varies by domain and location of residence. For most PA indicators, males were consistently more active than females, and the difference shows no variation between rural and urban areas. However, the largest difference between males and females was observed in the rural area for work-based PA. TV-viewing differences between males and females were also more pronounced in rural areas, with females presenting a higher prevalence. These differences may reflect the type of work in rural areas and the social roles expected in this context32. A report from the International Labour Organization showed that work patterns in rural areas present marked gender inequalities, with men more engaged in agricultural employment. At the same time, women spend more time with home activities and market production without payment32. These work patterns may result in more work PA for men and domestic PA for women in rural areas, as presented in this study.
Regarding age, PA is known to be less practiced by older individuals33,34, and it was not different in this sample. In addition, there was a disparity between the oldest and any other age group for both males and females. Considering leisure-time PA, the prevalence in each female age group was similar. However, younger females presented a higher prevalence than older ones in urban and rural areas, while males showed larger intervals between age categories. An important issue to highlight is that although older males work less than younger ones, the former group presents a higher prevalence than any other age group in urban areas. Further studies in the literature evidenced that work-related PA in rural areas shows significant prevalence, especially in males16,17.
Working characteristics have a close relationship with wealth. For both males and females, leisure-time PA prevalence was higher among richer individuals. In turn, commuting PA prevalence was higher among poorer individuals. These patterns were similar for both urban and rural areas. The findings of this work are in line with previous studies that focused on adolescents and older individuals from urban settings35,36 and adults from rural areas17. Apart from engaging in manual jobs, they support the idea that poorer individuals perform active transportation more frequently than richer ones. These individuals engage less frequently in leisure-time PA than individuals from the richest wealth quintile, because their work-related tasks already involve a high level of PA.
When comparing Brazil with other Latin American countries, the pattern for PA is very similar. Cardiovascular diseases are the leading cause of death in Latin American countries37. Despite the known benefits of exercise, compared with North American or European countries, Latin American countries show a high prevalence of insufficient PA (ie not meeting WHO guidelines)33. Characteristics such as high population density, the unregulated expansion of urban environments, air pollution, high crime rates, high-income inequality, high levels of poverty and population aging observed in these countries might inhibit PA, mainly at leisure time38,39. Similar to the results presented, a study performed with urban adults in four cities of Argentina, Chile and Uruguay showed that 64.8% met current PA recommendations with active transportation as the major contributor to total daily energy expenditure40. The authors also observed that more active transportation was correlated to lower socioeconomic positions40. Several policies, such as building public park facilities, cycling infrastructure, and closure of streets to private motor vehicles to create a safe place for people to cycle, walk, run, and participate in social health promotion and cultural events, have been adopted in Latin America41. However, these policies focus on urban areas only.
This work presents some limitations and strengths. Self-reported PA is always a challenge in terms of precision and instrument understanding. The literature shows that domestic and work-based PA, in general, are overestimated42. In addition, the measurement of specific domains such as leisure-time PA may be a challenge in rural areas, because it is an uncommon behavior with low prevalence17. However, this study may advance knowledge showing the difference between areas for different domains despite potential imprecisions. Regarding strengths, the large sample of a population-based study at a national level could be highlighted, as well as the exploration of intersectionalities of PA, mainly in rural areas where literature is less comprehensive.
Conclusion
Given the scenario presented in this work, which PA domain should be promoted in each location of residence? If the focus is only on total PA, both areas already present high PA levels. Looking at specific domains of PA, the variability for subgroups of the population can be observed, such as the poorest men spending too much time in physically demanding work in rural areas. At the same time, leisure-time PA is a privilege of the wealthiest males in urban areas. In this sense, exploring specific PA domains in each location of residence may help understand behaviors in different communities and guide future interventions.
references:
Supplementary material is available on the live site https://www.rrh.org.au/journal/article/6937/#supplementary
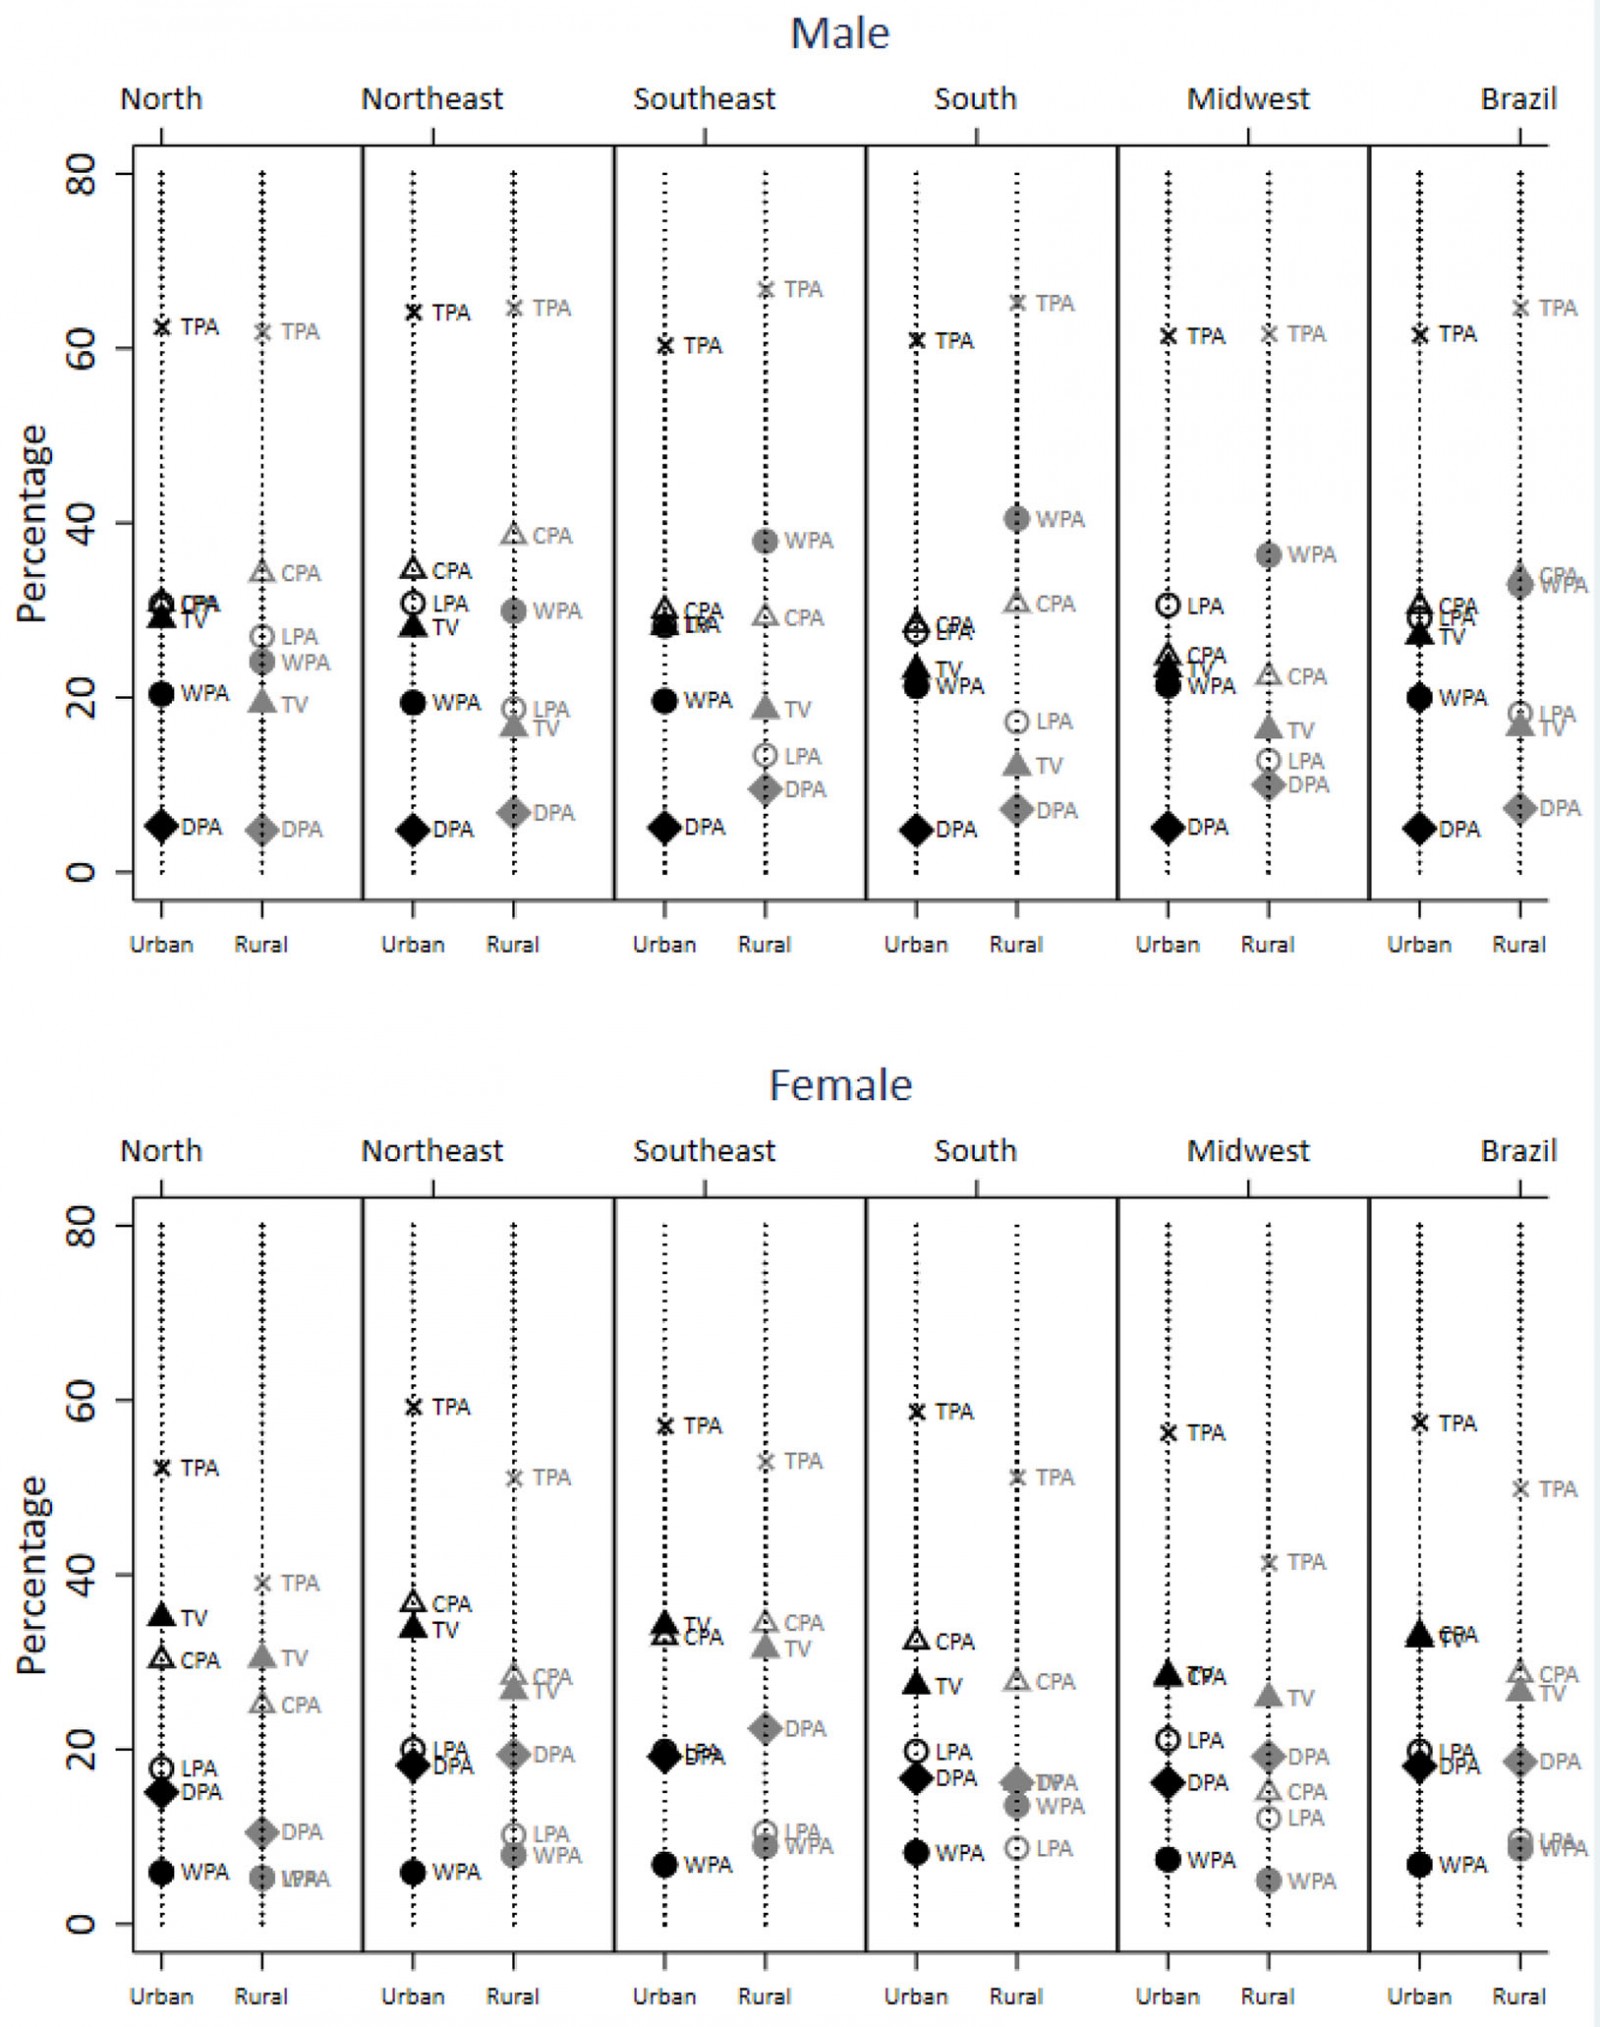 Supplementary Figure 1: Physical activity indicators and TV viewing according to sex, regions of the country and residence areas
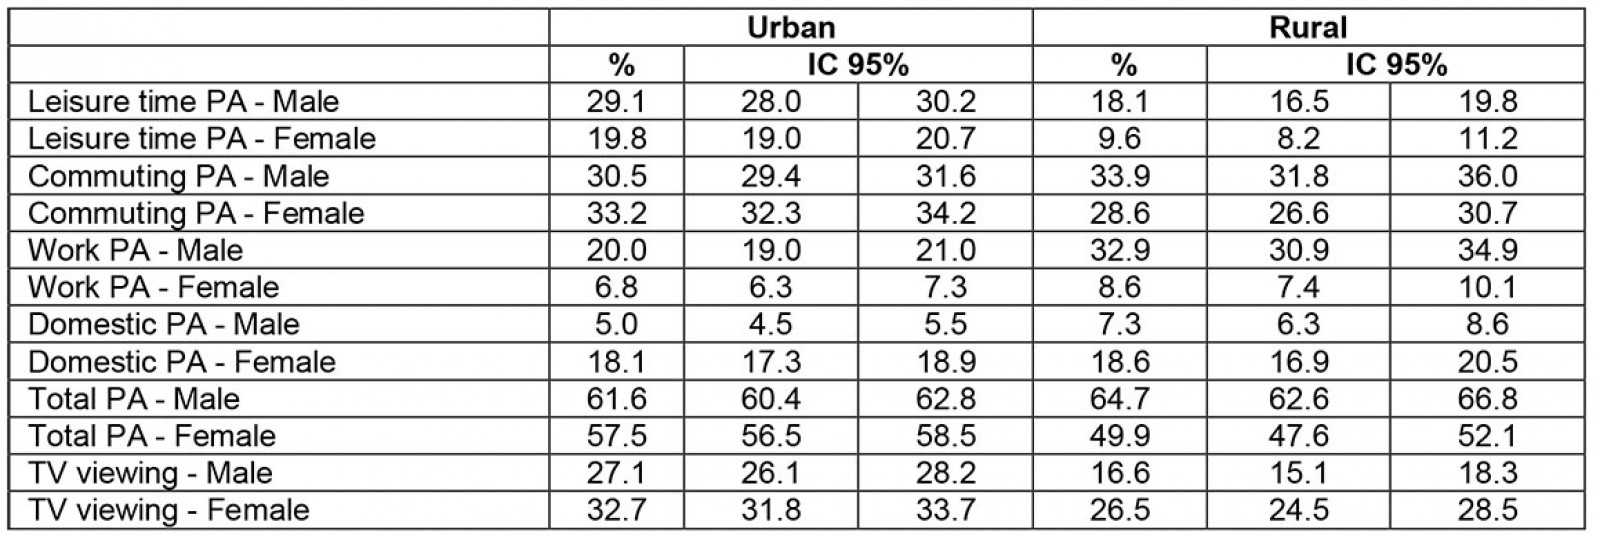
You might also be interested in:
2013 - District specific correlates for hypertension in Kaoma and Kasama rural districts of Zambia