


Introduction
Nearly 21,000 deaths and 7.6% of the Australian disease and injury burden are attributable to tobacco use each year, with harms disproportionately impacting groups experiencing disadvantage and marginalisation1. For example, smoking prevalence among First Nations Peoples remains high relative to other populations (estimated at 29% in 2022–23) and varies considerably between urban areas and regional and remote areas2,3. Many factors account for these inequities in smoking prevalence. These include the direct impacts of colonisation (eg tobacco supplied in lieu of wages and the commercial promotion and normalisation of tobacco use), trauma caused by the forced removal of family members, eviction from traditional lands, disruption of social and economic systems and destruction of sacred sites. Racism and unequal exposure to tobacco control activities and policies further compound these harms. Individually and collectively, these factors contribute to smoking prevalence among First Nations Peoples4-6. First Nations Peoples make up 26% of the population of the Northern Territory (NT) where this study is set, the largest proportion in Australia7. The NT also has the highest smoking prevalence in the country. The National Drug Strategy Household Survey 2022–2023 (NDSHS) estimated overall daily smoking prevalence among people aged 14 and over in Australia at 8.3%, but 13.3% in the NT8.
Setting
The NT is a large but sparsely populated area in Northern and Central Australia. The population (estimated at 253,600 people in December 2023) is spread across a vast geographic area of more than 1.4 million square kilometres (population density about 5.31 inhabitants per square kilometre)7. Most of the NT is classified as remote or very remote (remoteness classifications are described further below). The Australian Bureau of Statistics (ABS) uses five categories of remoteness, characterised by relative geographic access to services. Population is used as a proxy for service availability, which explains why Darwin is classed as outer regional while the capitals of other Australian states and territories are classified as major cities9. Approximately half of the population lives in the capital (Darwin) and the surrounding areas, and in larger towns such as Alice Springs, Katherine and Nhulunbuy. There are also 72 remote communities and about 600 smaller homelands with predominantly First Nations residents, with populations ranging from a few families to a few thousand people10.
Recent attention has turned to the impact of tobacco availability on smoking prevalence11. Tobacco retailers are disproportionately concentrated in areas with greater disadvantage, globally and in Australia12-20. High tobacco retailer density increases exposure to social and environmental cues to purchase tobacco, and is associated with higher smoking prevalence and lower smoking cessation success16,21-23. Although the Australian National Tobacco Strategy 2023–2030 identified restricting the availability of tobacco as a priority, no state or territory currently regulates tobacco retailer location or density24,25. Tobacco retailers in the NT must hold a tobacco retail licence, although anyone may apply for a licence by submitting a completed form, undergoing a police history check, and paying an annual fee of $28226. The NT has only one dedicated enforcement officer for tobacco licences, making monitoring compliance and enforcement challenging. This study extends existing work analysing retailer density in New South Wales16,27, Tasmania17, Western Australia14 and South Australia19. Our objectives were to map the locations of tobacco retail licences in the NT and investigate associations between tobacco retailers, area remoteness and area-level socioeconomic status.
Methods
Study design
We used a cross-sectional study design and linear regression analysis to examine associations between tobacco retail availability and area-level socioeconomic status and remoteness. We selected tobacco retailer density as our measure of tobacco retail availability in line with other work, both in Australia and internationally, as outlined above. This was calculated as the number of tobacco licences in an area per 1000 residents.
Data sources
We obtained the location of the 461 issued active tobacco retail licences from Licensing NT at the Department of Industry, Tourism and Trade (12 November 2023)28. We obtained population data from the ABS 2021 census and other ABS data as specified below29. In the NT, 91.3% of households completed the 2021 census either online or in paper form, compared to 96% nationally30. People living in remote areas had extra time and support to complete the census as per the ABS Remote Areas strategy, whereby field staff undertook specialist collection tasks such as conducting house visits and interviewing respondents. Data on participation rates in remote area were not available.
Geographic unit studied
We selected ABS Statistical Area Level 2 (SA2) as the geographic unit most suitable for our purposes. These are medium-sized general-purpose areas and represent a community that interacts socially and economically31. The populations of SA2s in the NT ranges from about 1300 to 10,000 people. SA2s represent large geographic areas in the NT; however, in these remote and very remote areas, typically retailers are located either along a highway, accessed by travellers and the local population, or in towns and communities where populations and other services are clustered. SA2 was also the unit of measurement used in similar work undertaken in South Australia and Tasmania17,19.
Other geographic units were also considered (eg SA1, SA3 and Indigenous Regions) but represented populations and geographic areas that were too large or too small to calculate meaningful retailer densities.
Outcome variable
Our outcome variable was retailer density, which was calculated as outlined above.
Explanatory variables
We assigned socio-economic status using 2021 Socio-Economic Indexes for Areas (SEIFA) Index for Relative Socio-economic Disadvantage (IRSD) within Australia with lower scores representing greater relative disadvantage32. We chose IRSD over IRSAD (Index for Relative Socio-economic Advantage and Disadvantage) to focus on disadvantage-related effects, and IRSD deciles over quartiles to capture any nuanced socioeconomic differences. We allocated remoteness areas to each SA2 using Australian Statistical Geography Standard Remoteness Structure (2021)33. All SA2 areas in the NT are either outer regional, remote or very remote, as there are no major urban or inner regional areas. We used population estimates and population density from the 2021 ABS census data. The percentage of First Nations residents in SA2s was not available in the dataset and was calculated using the population estimates from the 2021 ABS census data for First Nations residents and the total population.
Data cleaning procedure
We used Google Maps Geocoding API web service to convert street addresses for each tobacco retail licence to latitude and longitude coordinates. We removed duplicate (n=20) and mobile licence data (n=10) and updated all incomplete addresses (n=4) using Google Maps. One listed licence did not have an NT address and could not be linked to an NT business; thus, it was excluded from the dataset.
We used geographic information software QGIS v3.32.3 (Open-Source Geospatial Foundation; https://qgis.org/download) to geolocate tobacco retailers by SA2 using Australian Bureau of Statistics (ABS) digital boundary GeoPackage data (2021). We also obtained the total area (km2) for each NT SA2 polygon from ABS GeoPackage data34.
There are 68 SA2s in the NT. We removed SA2s without a corresponding IRSD from the dataset (n=6). These areas were identified as Darwin airport (n=3 tobacco licences), one industrial area (n=2 tobacco licences) and four other areas with small or no residential populations or non-response in the 2021 Census (zero tobacco licences), resulting in exclusion of five licences. Two areas had zero tobacco licences; those areas were retained and an offset included to enable transformation. The final dataset contained 62 unique SA2s and 425 tobacco licences. More than one digital remoteness area boundary was present in four SA2s, and so the remoteness structure covering the largest proportional area was allocated. This process resulted in all four of these SA2s being classified as very remote.
Data analysis
We analysed data using Stata v18.0 (StataCorp; https://www.stata.com/stata18/). Tobacco retailer density (retailers per 1000 population) was modelled as a continuous outcome to reflect population-standardised availability, consistent with previous Australian studies of tobacco retail environments17,19. While count-based models with a population offset represent an alternative analytical approach, modelling density allows for direct interpretation of exposure at the community level. As retailer density was right-skewed, a natural log transformation was applied, and linear regression models were used to estimate associations on the log scale. To accommodate zero values in retailer density, a small constant was added to the outcome before natural log transformation (ie ln(density + 0.1)), consistent with common approaches to handle zeros in natural log-transformed epidemiological data35. The constant was chosen to be small relative to the observed range of retailer density and therefore unlikely to substantially influence model estimates. Regression coefficients were exponentiated (exp(β)) to aid interpretation as multiplicative differences in retailer density associated with each predictor. Exponentiated coefficients represent the ratio of geometric mean retailer density between comparison groups, where values greater than 1 indicate a relative increase and values less than 1 indicate a relative decrease. For example, an exp(β) of 1.50 corresponds to a 50% higher retailer density relative to the reference group. Corresponding 95% confidence intervals were obtained by exponentiating both the estimated coefficients and their confidence limits from the natural log scale.
The explanatory variables were chosen based on the literature and our aim of investigating associations between tobacco retailers, area remoteness and area-level SES17,19 and were selected if associated with the outcome variable in our initial bivariate analyses (p<0.05; results of bivariate analyses are included in in Supplementary table 1 and Supplementary table 2). To account for potential confounding and collinearity, we then conducted multivariable regression analysis. Based on the findings from the bivariate analysis, we developed a multiple linear regression model to assess variance in tobacco retailer density as predicted by socioeconomic status (indicated by IRSD), population density, percentage of First Nations residents and remoteness.
We assessed influential points using residuals and inspection of box plots. A sensitivity analysis was conducted by refitting models after removal of identified influential observations to assess the robustness of the results. Collinearity was assessed by calculating the corresponding variance inflation factor (VIF). The proportion of First Nations residents variable (in %) was moderately collinear with remoteness (VIF>5) and was removed from the final model to maintain model stability and interpretability. Remoteness was retained due to its conceptual relevance and stronger explanatory power in the model. We also conducted a global F-test to evaluate the overall significance of the remoteness variable.
Ethics approval
This analysis involved routinely collected publicly available administrative data geocoded at a level that precluded identification of individual businesses in the published results. This study was approved by the Human Research Ethics Committee of Northern Territory Health and Menzies School of Health Research (HREC 2023-4720).
Results
Figure 1 shows the locations of licenced tobacco retailers by SA2 and remoteness. We found a mean of 1.81 tobacco retailers per 1000 residents in the NT (95% confidence interval (CI) 1.38–2.23 per 1000, standard deviation (SD) 1.67). Table 1 outlines the numbers of SA2s and tobacco licences and mean retailer density per 1000 residents by remoteness category. Retailer density by SA2 ranged from 0 to 8.40 per 1000 residents and increased with remoteness (Table 1).
In the bivariate analyses (Supplementary table 2) population density (p<0.05), percentage of First Nations residents (p<0.05), and remoteness (p<0.05) were all significantly positively associated with retailer density.
In the multivariate model, we observed a statistically significant positive association between tobacco retailer density and very remote location (F(4,57)=5.85, p<0.001, r2=0.29; Table 2), and the model accounted for 29% of the variance in retailer density. Very remote areas were associated with higher retailer density compared to outer regional areas (β=1.09, p=0.02), corresponding to approximately a threefold higher retailer density (exp(β)=2.97). The relationship between remoteness and tobacco retailer density did not follow a strict gradient, as remote areas did not show a significant increase relative to outer regional areas (Fig2). We did not observe a statistically significant linear relationship between retailer density and area disadvantage in either bivariate or multivariate analysis (p>0.05), and some SA2s with less area disadvantage had some of the highest retailer densities, while some more disadvantaged SA2s had some of the lowest densities (Fig3). Population density was statistically significant in the bivariate analysis but was not significant when included in the full model (p>0.05). Percentage of First Nations residents was excluded from the multivariate model as it was collinear with remoteness. This was unsurprising because many remote communities have a higher number of First Nations residents.
We also conducted a sensitivity analysis. After excluding three identified influential observations, remoteness remained a significant predictor compared to outer regional areas, population density became a significant predictor (p<0.05), and the model’s explanatory power increased (F(4,54)=8.07, p<0.001, r2=0.37; Table 3). The model accounted for 37% of the variance in retailer density.
Collinearity and the presence of influential points may have inflated standard errors in the full model, potentially obscuring associations with retailer density. However, we included these points in the final dataset and model given that they represent three real SA2s (in contrast to SA2s that were excluded from the dataset because they had small or no populations).
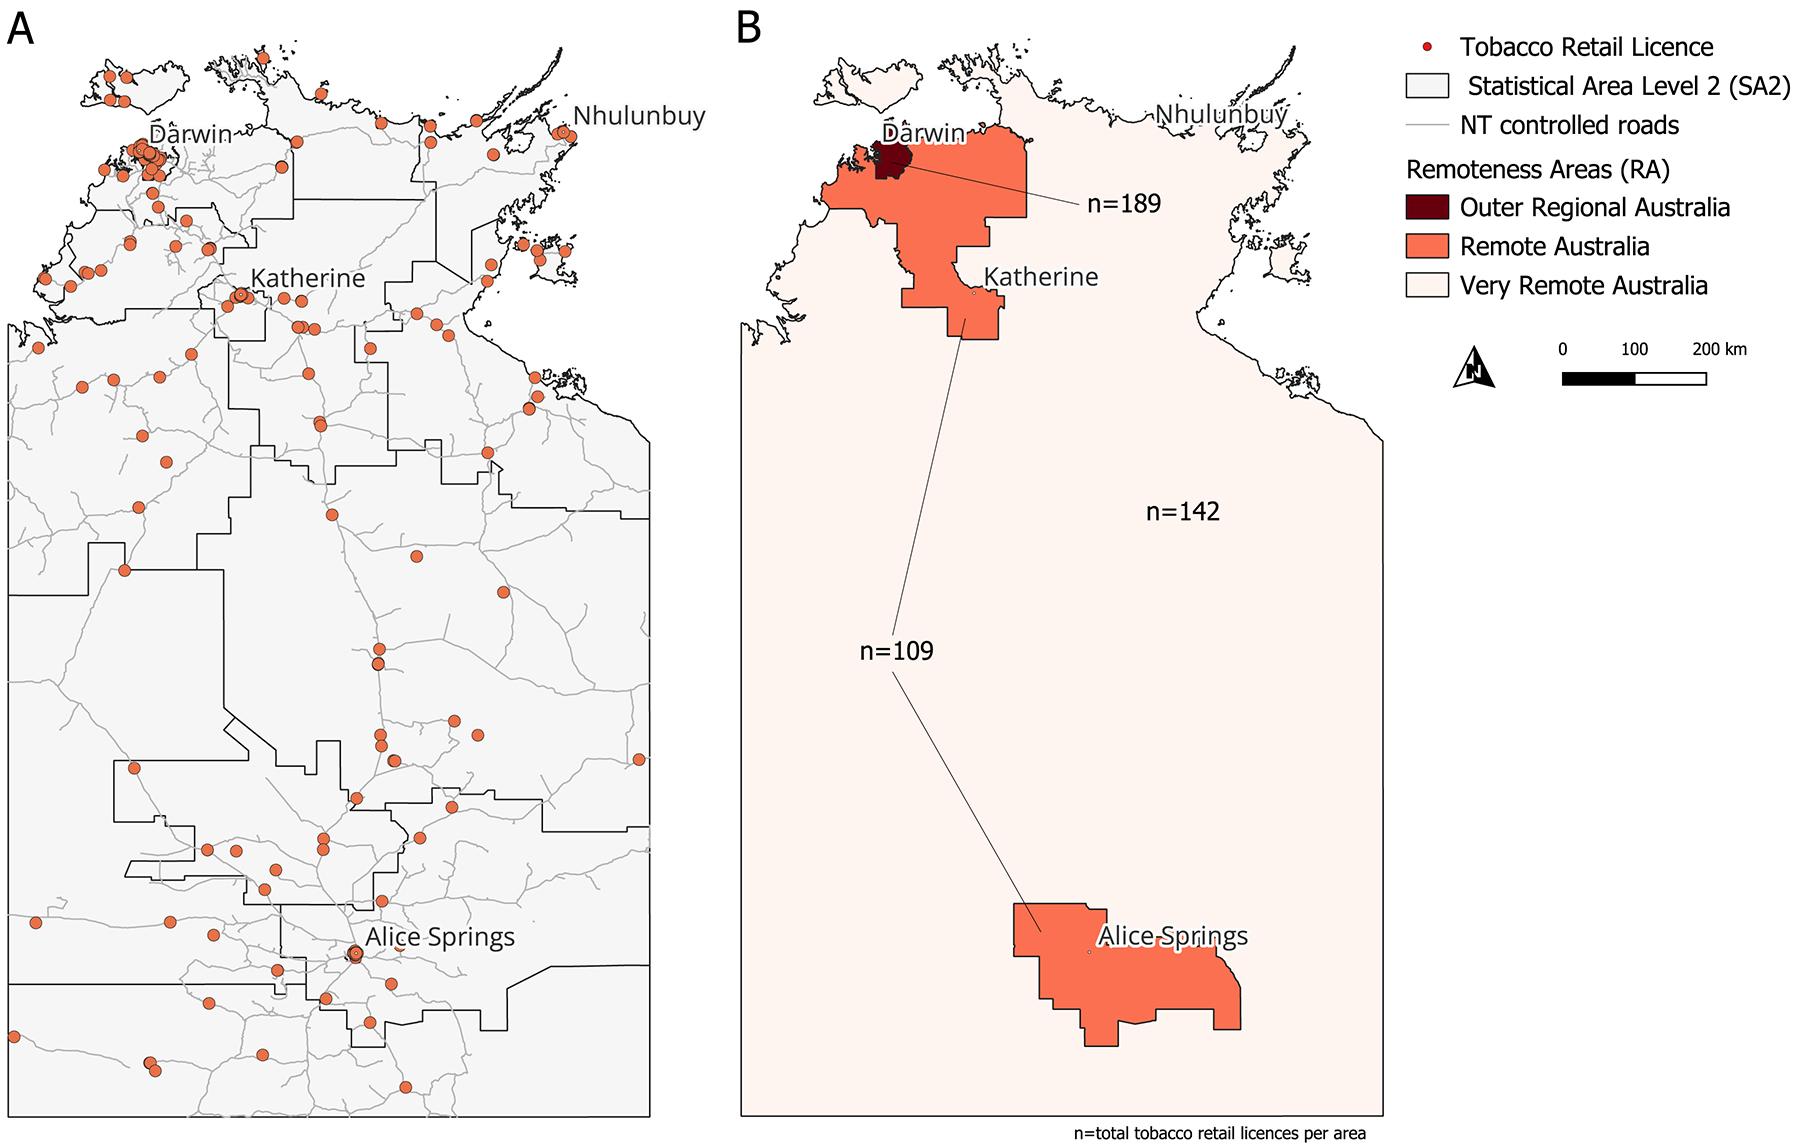 Figure 1: Maps of the Northern Territory. Map A shows Statistical Areas Level 2 and individual retailers. Map B shows areas of remoteness and total numbers of retailers in each area.
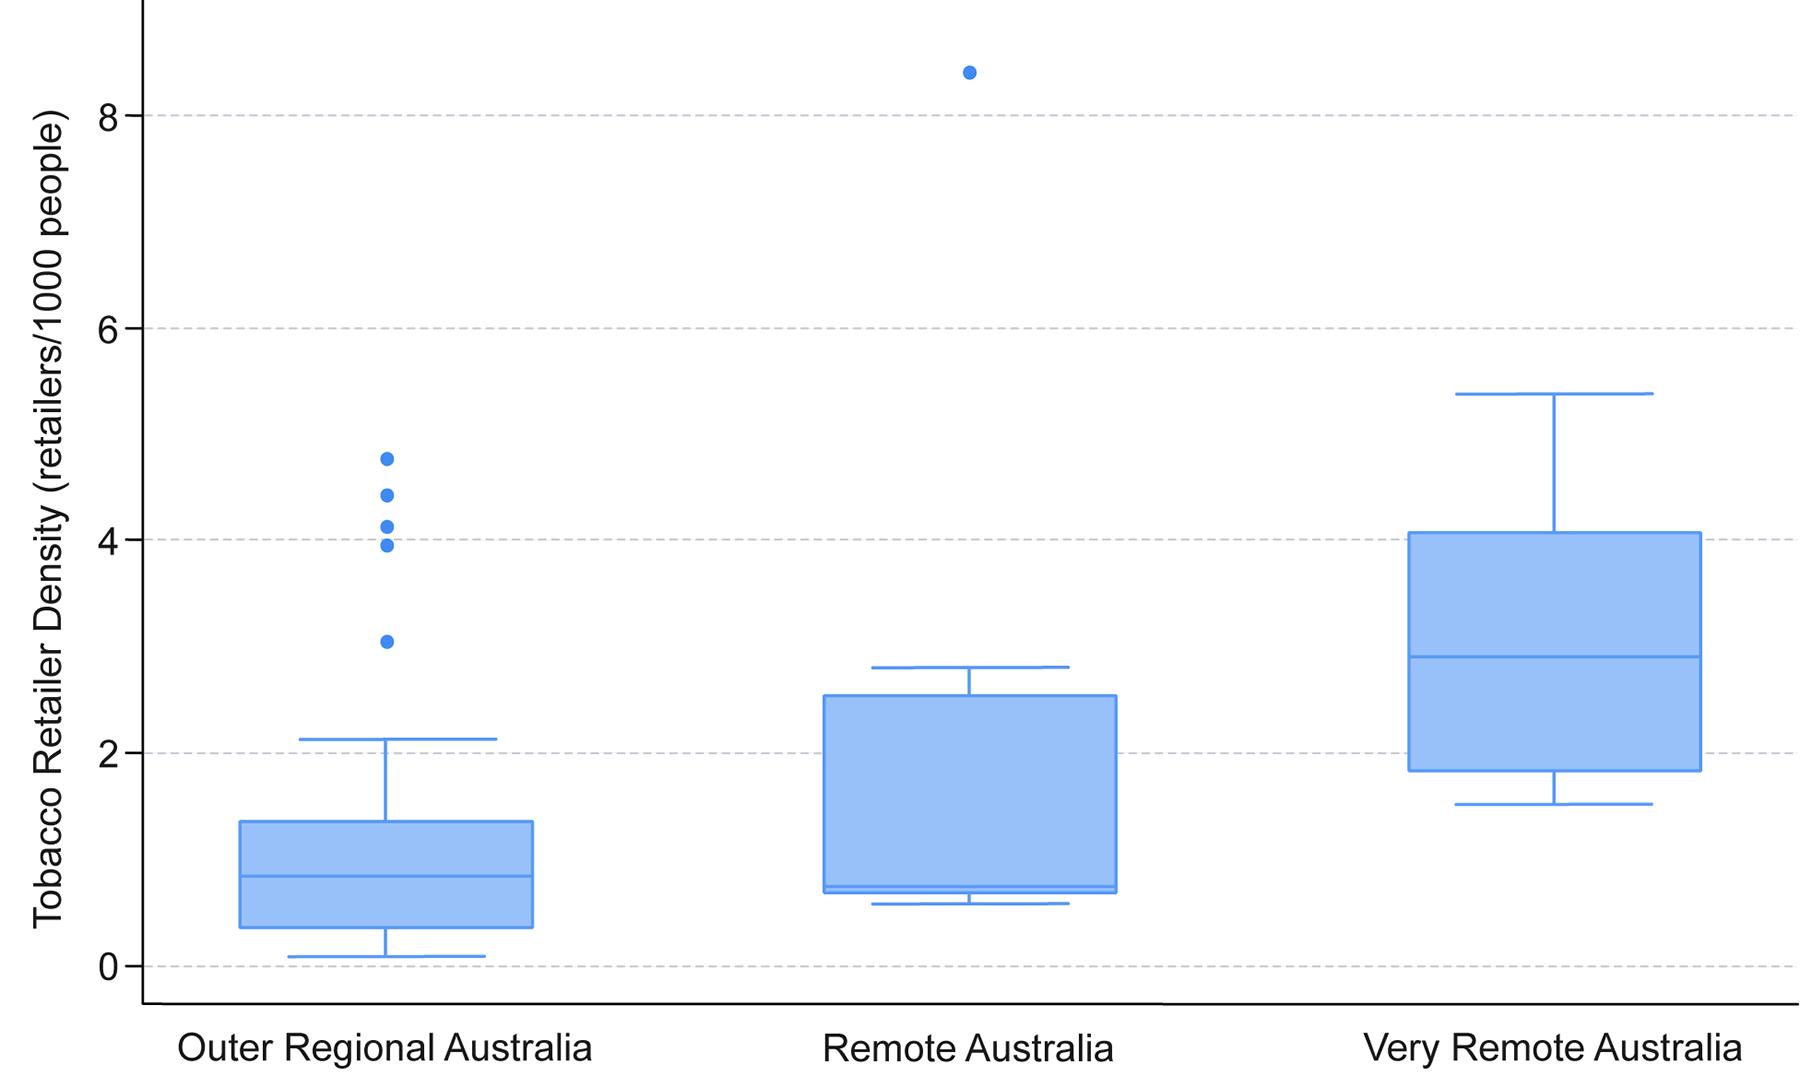 Figure 2: Tobacco retailer density (retailers per 1000 residents) by remoteness categories in the Northern Territory.
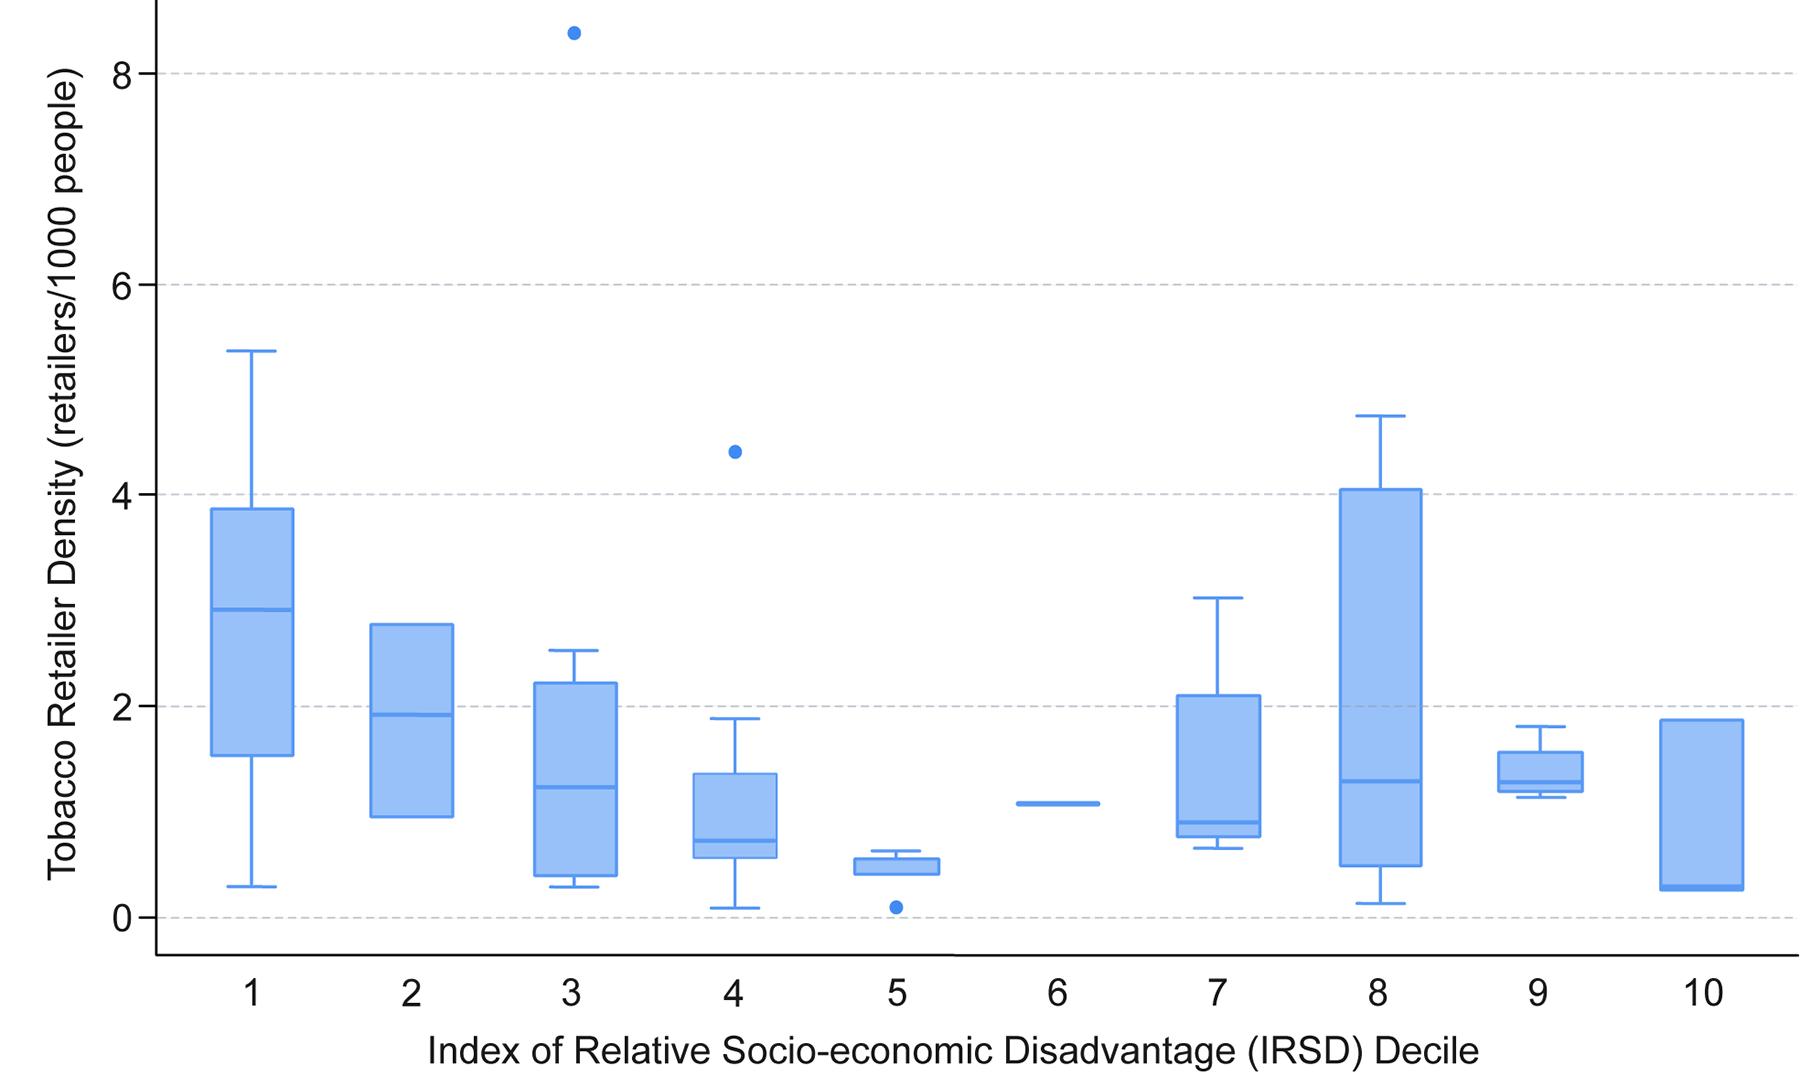 Figure 3: Tobacco retailer density (retailers per 1000 residents) by relative socioeconomic disadvantage decile.
Table 1: Summary of Statistical Areas Level 2, numbers of tobacco retailers and mean tobacco retailer density per 1000 residents by remoteness
| Remoteness |
Number of SA2s (n=62) (% of total) |
Number of retailers (n=425) (% of total) |
Mean retailer density per 1000 residents (95%CI) |
|---|---|---|---|
| Outer Regional Australia | 38 (61.3) | 183 (43.1) | 1.25 (0.85–1.66) |
| Remote Australia | 9 (14.5) | 94 (22.1) | 2.03 (0.35–3.73) |
| Very Remote Australia | 15 (24.1) | 148 (34.8) | 3.06 (2.37–3.75) |
| Total | 62 (100) | 425 (100) | 1.81 (1.38–2.23) |
CI, confidence interval. SA2, Statistical Area Level 2.
Table 2: Multiple regression model output looking at factors associated with tobacco retailer density in the Northern Territory
| Predictor | Subcategory | Coefficient β (95%CI) | exp(β) (95%CI) | p-value |
|---|---|---|---|---|
| IRSD decile | 0.32 (–0.07–0.13) | 1.38 (0.933–1.139) | 0.52 | |
| Population density | 0.00 (–0.00–0.00) | 1.00 (1.000–1.000) | 0.22 | |
| Remoteness (reference category) | Remote Australia | 0.27 (–0.58–1.11) | 1.31 (0.56–3.034) | 0.53 |
| Very Remote Australia |
1.09 (0.21–1.95) |
2.97 (0.283–2.099) | 0.02 |
CI, confidence interval. IRSD, Index for Relative Socio-economic Disadvantage.
Table 3: Regression output for sensitivity analysis looking at factors associated with tobacco retailer density in the Northern Territory
| Predictor | Subcategory | Coefficient β (95%CI) | exp(β) (95%CI) | p-value |
|---|---|---|---|---|
| IRSD decile | 0.04 (–0.04–0.12) | 1.041 (0.961–1.128) | 0.33 | |
| Population density | 0.00 (–0.0007– –0.00008) | 1.000 (0.9993–0.9999) | 0.015* | |
| Remoteness (reference category) | Remote Australia | –0.31 (–1.06–0.45) | 0.733 (0.347–1.571) | 0.42 |
| Very Remote Australia |
0.77 (0.01–1.53) |
2.159 (1.010–4.617) | 0.047* |
*p<0.05, **p<0.01, ***p<0.001.
CI, confidence interval. IRSD, Index for Relative Socio-economic Disadvantage.
Discussion
We aimed to map the locations of tobacco retail licences in the NT and to examine factors associated with tobacco retailer density in the NT using multiple linear regression.
We found that retailer density was higher in very remote areas. Although ostensibly counter-intuitive, these findings may reflect the small population size of very remote communities; that is, even if there is only one retailer in the community, the number of retailers per 1000 residents will be higher than in non-remote locations. Retailer density in the NT has not previously been examined; however, research in South Australia and Tasmania found a similar association17,19. Although South Australia has more densely populated urban areas than the NT, both regions have remote and very remote areas with high proportions of First Nations residents.
We did not find a significant association between area disadvantage and tobacco retailer density in either the bivariate analysis or the multivariate analysis. In fact, we found that some SA2s with less area disadvantage had some of the highest densities, while other more disadvantaged SA2s had some of the lowest densities. Although higher densities of tobacco retailers are generally associated with greater area disadvantage and remoteness, including in Australia17,19,20, a recent systemic review found that about 12% of included studies reported the opposite effect12. Explanations include the preponderance of wealthier residents in some business districts, such as New York City36, and greater densities of retail and entertainment businesses in some higher socioeconomic areas37. Conversely, Kong et al suggested that some areas are so disadvantaged that they have very few or no retailers12. Although other studies report on very different contexts from the NT, our findings support these explanations, as several higher socioeconomic areas with relatively more tobacco retailers were business or entertainment areas with several bars, shops and service stations; by contrast, several lower socioeconomic areas with fewer tobacco retailers also had fewer shops, and no bars and service stations.
Tobacco retail regulation is an underutilised policy measure, both in Australia and globally24. However, some jurisdictions in Australia and internationally have successfully seen retailer numbers decline by restricting their location, increasing licence fees or capping the number of licences issued. Examples are Hungary38, South Australia39 and some US cities36,40-42. A recent meta-analysis estimated a 2.5% reduction in tobacco use from reductions in exposure to tobacco retailer density and proximity43. Tobacco retail outlets decreased by 85% in Hungary, leading to short-term reductions in smoking prevalence among young people44. Although these studies report on very different settings from the NT, they provide several lessons for jurisdictions considering reducing tobacco availability. For example, findings from several cities in the US show the importance of considering the equity impact of retail reduction measures, and that these are likely to be unique to each context36,41,42. In Hungary, the study authors noted that sustainable reductions required ongoing monitoring and comprehensive complementary tobacco control strategies. In Australia, improving compliance and enforcement has also been identified as a key element of addressing the growing illicit market45.
Associations between remoteness and tobacco availability may contribute to inequities in smoking prevalence between First Nations Peoples and non-Indigenous people in Australia, given that most remote NT communities have higher numbers of First Nations residents3,8. While many potential tobacco control retail policies have a pro-equity impact, some may increase inequities46. Strategies that specifically address the supply of tobacco in remote and very remote areas could thus help reduce inequities. However, there are limited opportunities to reduce density in the NT other than removing tobacco retailers from some communities, given that people have no choice but to shop at a tobacco retailer in communities that have only one store. Density or proximity restrictions may reduce access to tobacco in larger towns and cities, but implementing similar restrictions in smaller communities could create hardship for people who are addicted to nicotine. Furthermore, in larger communities with more than one store, restricting sales to only one store could be considered unfair by retailers. Policies focusing on remote communities could also be considered discriminatory, feeding industry arguments that consumers should be able to purchase tobacco, and potentially increasing stigma and community isolation47-51. These concerns may be less persuasive when the rights of communities to be free from addiction are considered, along with the history of tobacco companies targeting marginalised groups, and the lethality of tobacco products compared to other consumer products, given they kill up to two-thirds of users when used as directed by the manufacturer52,53. Furthermore, ensuring equitable access to smoking cessation support for people in small and more geographically isolated communities should be paired with policies to reduce tobacco supply54,55.
A number of other unintended consequences of policies aimed at reducing supply of tobacco in the NT also require consideration. For example, research in New Zealand found that some participants thought the smoke-free generation policy would be less effective for Māori because social supply to minors would continue56. Increased occurrences of social supply were also identified in Hungary44. Exploratory data (unpublished) from our team from parts of the NT suggest that social supply already takes place in some communities. Use of pituri (a traditional nicotine-containing stimulant from Duboisia hopwoodii, used for ceremonial, social, and medicinal purposes, chewed by the user), and native tobacco plants among women in Central Australia is widespread, with reports of use starting in girls as young as five57,58. Reducing the supply of commercial tobacco could lead to increased used of native tobacco sources.
It is easy to focus on the difficulties in addressing tobacco retailer availability in a jurisdiction as vast and challenging as the NT, and a one-size-fits-all approach may not be the most appropriate or effective course of action. However, some community stores have built in key performance indicators monitoring tobacco sales, providing opportunities and local will to address the supply of tobacco59,60. Communities have also led initiatives to improve the health and wellbeing of their residents; for example, many NT communities have introduced sugar reduction policies60,61 and low aromatic unleaded fuel to reduce petrol sniffing62. The NT also has a long and complex history of legislated and unlegislated policy restricting access to alcohol, including examples of externally imposed policy and some community led63. Finally, in the criminal justice sector, there are other examples of community generated solutions64-66. Together these examples illustrate the potential for approaches addressing tobacco supply that are tailored to community circumstances. They also provide an entry point to begin the conversation on dismantling the current paradigm of a destructive product that is widely available. Research with communities and stakeholders such as health services would be essential to ensure that people who smoke are properly supported through such a transition, as well as funding and resources for cessation support services.
Limitations
Our study has some limitations. Smoking prevalence data for the NT by SA2 were not available, so we could not examine associations between retailer density and prevalence. Although other measures could have yielded different associations, as outlined earlier, we chose the number of retailers per 1000 residents and SA2 as the most suitable outcome variable. Measures of retailer density based on area would not be suitable given the large sparsely populated areas of the NT. We have used a single spatial scale, although we expect that the remoteness variable captures that individuals living in small towns and communities are less likely to move outside of their ascribed SA2 on a daily basis than are individuals living in an SA2 that covers a single suburb in a larger town, individuals may be exposed to multiple contexts that are not accounted for in the analysis43. For example, our analysis does not account for seasonal mobility of people. Our measurement of remoteness is a geographic measure characterised relative to ‘colonial settlement patterns’67. We also acknowledge that we have used a single measure of inequity that reflects the values and priorities of the mainstream population, which are not necessarily those of First Nations Peoples. Finally, this analysis represents a snapshot in space and time. Both media and anecdotal reports suggest that there has been a recent increase in retail outlets primarily selling illegal, untaxed, cheap, tobacco, which would not be captured in official licensing figures.
Conclusion
Although tobacco retailer density increased with remoteness, we did not find a significant relationship between retailer density and area disadvantage. In a jurisdiction as large and sparsely populated as the NT, policy options could include a cap on tobacco licences, thus preventing new tobacco retailers from being established in the NT, while also planning measures that will actively reduce numbers of retailers. This work will require engagement with retailers and remote communities, given potential impacts on them and transition support that may be required. In small and geographically isolated communities where compliance and enforcement are more difficult, it is important to ensure that strategies are generated with the support of the community and consider the potential for them to be undermined by factors such as illicit sales and social supply.
Funding
RC is supported by an Australian Government Research Training Program stipend and a National Health and Medical Research Council Ideas grant (Grant No. 2029002). CG receives funding from NHMRC grants (GNT1198301, GNT2019252) and is supported by an ARC Future Fellowship (FT220100186). MH receives funding from NHMRC grants (1198301, 2029002) and is supported by a Heart Foundation Australia Future Leader Fellowship (110860-2025).
Conflicts of interest
RC and MH work in partnership with remote community-owned stores in the NT to develop strategies to reduce supply of tobacco in remote communities.
AI disclosure statement
During the preparation of this work, the authors used ChatGPT to improve the readability of some sentences in the Methods, Results and Discussion sections. After using this tool, the authors reviewed and edited the content as needed and take full responsibility for the content of the published article.
References
Supplementary material is available on the live site https://www.rrh.org.au/journal/article/10095/#supplementary