





 download PDF

Introduction
Open defecation is the practice of defecating outside in the open (eg in fields, bushes, canals, rather than into a toilet). This practice is common in areas where sanitation infrastructure remains a critical public health challenge in Sub-Saharan Africa, with Nigeria accounting for 48 million people who practice open defecation, the second-highest global burden1,2. Despite national commitments to achieve open defecation-free status by 2030, progress remains slow, particularly in rural areas where sanitation coverage lags significantly behind water access improvements2. Community-led total sanitation (CLTS), a participatory behavioural change approach, has demonstrated success in several countries3,4. However, implementation challenges persist in contexts characterized by extreme poverty, difficult environmental conditions, and complex socioeconomic barriers5,6.
The environmental health implications of open defecation extend beyond effects on individuals practising open defecation. Human faecal matter contains high concentrations of pathogens, including bacteria, viruses, and parasitic worms7. Faecal contamination creates transmission pathways for diarrheal diseases, helminthic infections, and environmental enteropathy, contributing to approximately 432,000 annual deaths globally8. In tropical environments, deposited faecal matter contaminates soil, water sources, and agricultural produce9,10. Geochemical analysis of groundwater near defecation sites shows elevated faecal indicator bacteria, alongside chemical signatures including dissolved oxygen and chloride, creating complex exposure pathways that affect entire communities11. Children under 5 years bear a disproportionate disease burden, with inadequate sanitation perpetuating cycles of malnutrition, stunting, and impaired cognitive development12.
Critical gaps remain in understanding the disconnect between sanitation awareness and actual behaviour change. While many communities demonstrate knowledge of sanitation-related health risks, this knowledge often fails to translate into latrine adoption or consistent use13,14. Additionally, CLTS programs have historically neglected child faeces management15. Economic constraints in non-subsidized CLTS contexts further complicate adoption, as households facing extreme poverty must prioritize immediate survival needs over sanitation investment despite evidence that children's faeces contribute substantially to environmental pathogens16,17.
This cross-sectional study explicitly examines the knowledge–practice gap in hygiene and defecation behaviours, household economic decision-making regarding sanitation investments, child faeces management practices, and environmental factors affecting latrine feasibility.
Methods
Study design and setting
Osun is a state in South-West Nigeria with a projected population of 5.8 million in 2026 (up from 3.4 million in the 2006 national census)3,18. This cross-sectional study was conducted in four highly vegetated rural villages across two local government areas (LGAs) between March and May 2023 (Fig1). Villages were selected based on high open defecation prevalence (>70% preliminary assessment), presence of improved water sources, no recent sanitation interventions, accessible community leadership willing to participate, and varied soil and topographic conditions to assess environmental feasibility factors. The villages (represented by the codes AY, BA, BE, IT) comprised 861 total households with populations ranging from 164 to 278 households per village.
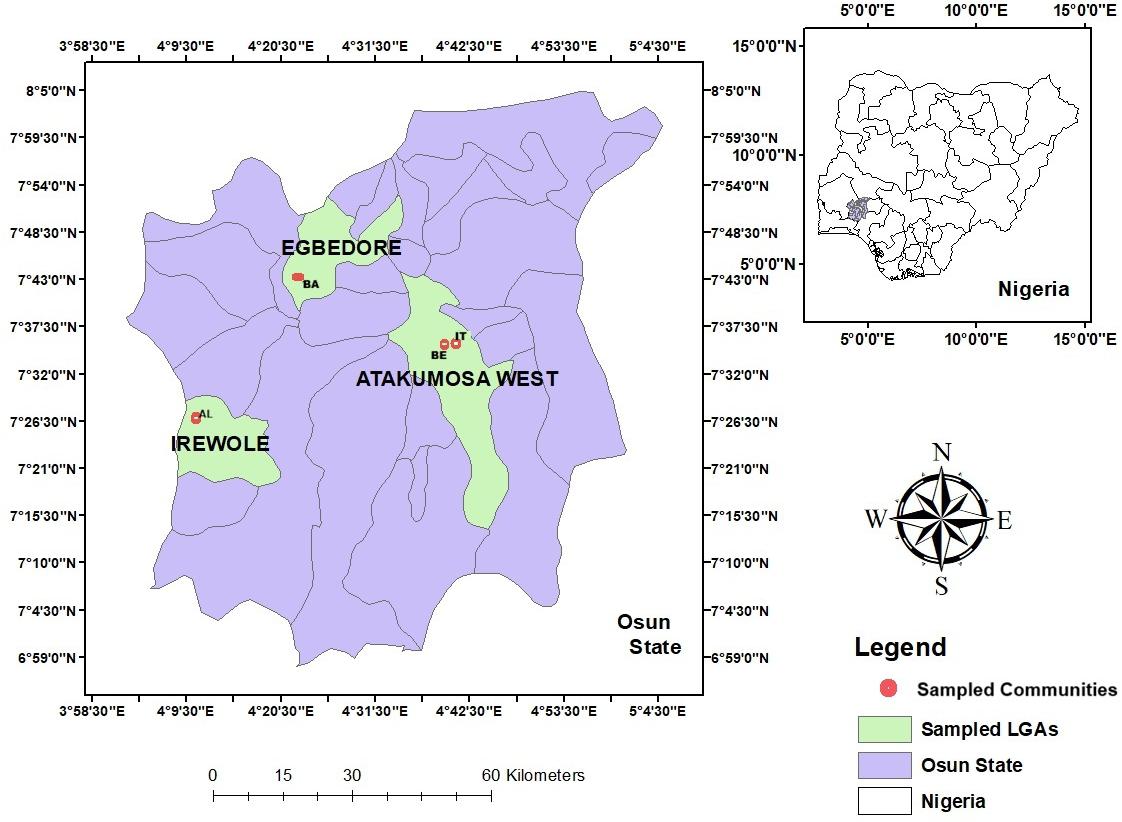 Figure 1: Map of communities accessed in Osun State, South West Nigeria. LGA, local government area.
Sample size and sampling
Target population
All households in the four selected villages were eligible for inclusion. Households were defined as groups of people who eat from the same pot and sleep under the same roof for at least 6 months of the year.
Inclusion criteria
Inclusion criteria were as follows: permanent residents of the village (≥6 months residence); heads of household or adult household representatives (≥18 years) available and willing to participate; households with or without children (to capture child faeces management practices and assess differential behaviours).
Exclusion criteria
Exclusion criteria were as follows: temporary residents, seasonal migrants, or visitors; households where no adult respondent was available after three visit attempts; households explicitly refusing participation.
Sample size calculation
For cross-sectional survey designs estimating proportions:
n = [Z² × p(1 – p)] ÷ d²
where:
- Z = 1.96 (95% confidence level)
- p (expected prevalence of open defecation) = 0.75 (based on preliminary data and Nigeria Demographic and Health Survey estimates)
- d (desired precision) = 0.05 (±5%)
- n = [1.96² × 0.75(0.25)] ÷ 0.05² = 288.12 ≈ 290 households.
Adjusting for non-response (10%): 290 × 1.10 = 319 households.
Due to logistical and resource constraints, a total of 200 households were surveyed, representing 23.2% of total village households (200/861), a coverage proportion that compares favourably with similar rural WASH baseline surveys in Nigeria and Ghana, which typically sample 10–20% of target households19,20.
Power analysis
Power level of 80% was used to detect differences in proportions: 15% between groups (α=0.05).
Precision
Achieved precision was ±6.7% at 95% confidence level for prevalence estimates.
Sampling strategy
A stratified random sampling approach was employed.
Stratification by village
Households were proportionally allocated to villages based on population size:
- AY: 200 × (187 ÷ 861) = 43 households
- BA: 200 × (232 ÷ 861) = 54 households
- BE: 200 × (164 ÷ 861) = 38 households
- IT: 200 × (278 ÷ 861) = 65 households
Random selection within villages
Village household lists (enumeration) were obtained from village heads. Every kth household was selected (k = total households ÷ sample size).
If a selected household refused or was unavailable, the next household on the list was approached. A maximum of three visits were attempted before replacement.
Data collection
A semi-structured questionnaire adapted from WHO/UNICEF Joint Monitoring Programme WASH tools21 and Nigeria Demographic and Health Survey modules22 assessed household demographics, water access and practices, sanitation facilities and defecation behaviours, child faeces management, hygiene practices, household economic priorities, and environmental observations. The questionnaire was translated to Yoruba, pilot-tested with 20 households, and validated for content (expert review) and internal consistency (Cronbach's α=0.78).
Six trained enumerators (three male, three female) administered the questionnaires with household heads or adult representatives (age ≥18 years) in local language. Data were entered directly into digital tablets using KoBoToolbox (Harvard Humanitarian Initiative) with real-time validation. Field supervisors conducted daily debriefings and randomly verified 10% of households for quality assurance. Environmental assessments documented soil type, topography, flood risk, visible faecal contamination, and proximity to water sources through physical observation.
Data analysis
Data were analysed using R software v4.3.0 (R Foundation for Statistical Computing). Descriptive statistics summarized demographic characteristics, sanitation infrastructure, and behavioural practices using frequencies, percentages, means, and standard deviations. Chi-squared tests were used to examine associations between categorical variables (education and toilet quality, handwashing and faecal disposal, income and economic priorities, soil type and flooding risk). One-way ANOVA compared water collection time across villages. Multiple linear regression identified predictors of household water storage expenses. Statistical significance was set at p<0.05. Missing data (<3% for all variables) were handled through listwise deletion.
Ethics approval
Written informed consent was obtained from all participants after explanation in their preferred language. Participation was voluntary with no incentives provided. Confidentiality was maintained through anonymized data collection, and village identities were protected using pseudonyms. Ethics approval was granted by the State Department of Environmental Health (ACS/417-2023).
Results
Household characteristics
Among 200 participating households, respondents were predominantly aged 41–50 years (29%), married (73%), with secondary school education (31%) or primary education (29%) as the most common attainment levels. Twenty-two percent had no formal education. Religious affiliation was balanced between Christianity (43%) and Islam (41%), with 16% practising traditional religions. Gender distribution was relatively even (54% male, 46% female) (Table 1).
Table 1: Demographic characteristics of study participants (N=200)
| Variable | Values | n (%) |
|---|---|---|
| Age (years) | <20 | 23 (12) |
| 21–30 |
15 (8) |
|
| 31–40 |
57 (28) |
|
| 41–50 |
59 (29) |
|
| ≥51 |
46 (23) |
|
| Sex/gender | Male | 107 (54) |
| Female |
93 (46) |
|
| Level of education | No formal education | 43 (22) |
| Higher education/university |
7 (3) |
|
| Primary education |
58 (29) |
|
| Technical/vocational |
31 (15) |
|
| Secondary school leaving certificate |
61 (31) |
|
| Marital status | Single | 29 (15) |
| Married |
147 (73) |
|
| Divorced |
4 (2) |
|
| Widowed |
20 (10) |
|
| Religion | Islam | 82 (41) |
| Christianity |
86 (43) |
|
| Traditional worshipper |
32 (16) |
Water access and sanitation infrastructure
The vast majority of respondents relied on hand-pump boreholes as their primary drinking water source (89.5%), while the remaining population utilized rainwater collection (10.0%) and public taps (0.5%).
It was observed that, despite water accessibility, sanitation coverage was critically low: 91.5% practised open defecation (bush/field/shallow burial), 5.5% had flush/pour-flush pit latrines, and only 3.0% used pit latrines with covers. Among facilities, 74.0% of respondents used public open spaces/yards/bushes for defecation, 17.5% practised burial, and 8.5% had private toilets (Table 2).
Table 2: Water sources and sanitation facilities used by respondents
| Question | Response categories | n (%) |
|---|---|---|
| What is the main source of drinking water for members of your household? | Rainwater collection | 20 (10.0) |
| Hand-pump borehole |
179 (89.5) |
|
| Public tap/standpipe |
1 (0.5) |
|
| What kind of toilet does your household use? | Flush/pour flush to pit | 11 (5.5) |
| Pit latrine with cover |
6 (3.0) |
|
| Open air/bush/field/bury |
183 (91.5) |
|
| Is the toilet private (one household), shared (more than one household) or public? | Private | 17 (8.5) |
| Public open space/yard/bush |
148 (74.0) |
|
| Burying |
35 (17.5) |
|
| What kind of maintenance is needed for the household’s toilet daily? | Digging new hole (when pit is full) | 11 (5.5) |
| Cleaning |
7 (3.5) |
|
| Removing bushes when necessary and or burying |
182(91.0) |
Economic priorities and sanitation investment
Chi-squared analysis revealed a significant association between household income and preference for purchasing mobile phones over building latrines (χ²=19.34, df=6, p=0.04). Among the lowest-income group (<₦50,000/A$52.50 monthly, representing 71% of respondents), 35.5% agreed and 35% strongly agreed they would prioritize phone purchases over latrine construction. This pattern persisted across income categories, suggesting economic constraints fundamentally shape sanitation decision-making (Table 3).
Table 3: Chi-squared analysis of household income and preference for purchasing mobile phones over building latrines†
| Income level |
Preference for purchasing mobile phones over building latrines n (%) |
||
|---|---|---|---|
|
Agree |
Strongly agree | Neither agree nor disagree | |
|
<₦50,000 (<A$52.50) |
71 (35.5) | 70 (35.0) | 1 (0.5) |
| ₦51,000–100,000 (A$52.50–105.00) | 12 (6.0) | 9 (4.5) | 0 (0.0) |
| ₦100,000–200,000 (A$105.00–210.00) | 2 (1.0) | 24 (12.0) | 0 (0.0) |
| >₦200,000 (>A$210.00) | 7 (3.5) | 4 (2.0) | 0 (0.0) |
† χ2(6)=19.34 (p=0.04)
Education and toilet quality perceptions
A strong statistically significant relationship existed between respondents' education levels and perceptions of toilet quality (χ²=41.36, df=4, p<0.01). Respondents with secondary education (29.5%) most frequently reported that available toilets ‘looked bad most times’, while those with tertiary education showed lower concern about toilet appearance, suggesting education influences both sanitation standards and quality expectations (Table 4).
Table 4: Cross-tabulation and χ2 table of education level and quality of toilet sanitation†
| Level of education |
Toilet quality perception n (%) |
|||
|---|---|---|---|---|
| Low perception (no concern about toilet look) | Fair perception (toilet looks bad most times) | |||
| None | 0 (0.0) | 43 (21.5) | ||
| Higher education/university | 3 (1.5) | 4 (2.0) | ||
| Primary education | 0 (0.0) | 58 (29.0) | ||
| Technical/vocational | 1 (0.5) | 30 (15.0) | ||
| Secondary school leaving certificate | 2 (1.0) | 59 (29.5) | ||
† χ2(4)=41.36 (p<0.01)
Hygiene practices and faecal disposal disconnect
A critical knowledge-practice gap was observed among respondents who washed hands before eating, 51.5% still disposed of faeces outside in bushes, 3% flushed into toilets, and 3.5% threw waste in yards. Among those washing hands after eating, none reported flushing faeces into toilets, while 3.5% disposed outside and 2.5% in yards. Chi-squared analysis confirmed a significant association between handwashing timing and faecal disposal methods (χ²=36.4, df=8, p<0.01), indicating that hygiene knowledge does not necessarily translate to proper sanitation practices (Table 5).
Table 5: Cross-tabulation and χ2 result for handwashing and faecal disposal†
| Faecal disposal method |
Handwashing practice n (%) |
||
|---|---|---|---|
| Before eating | After eating | Before and after eating | |
| Dropped into toilet | 0 (0.0) | 0 (0.0) | 6 (3) |
| Disposed outside premises/bush | 40 (20) | 7 (3.5) | 103 (51.5) |
| Disposed in the yard | 0 (0.0) | 5 (2.5) | 19 (9.5) |
| Buried | 3 (1.5) | 0 (0.0) | 0 (0.0) |
| Nothing done / left there | 0 (0.0) | 0 (0.0) | 17 (8.5) |
† χ2(8)=36.4 (p<0.01)
Water discharge methods and toilet facilities
A cross-tabulation of the used water disposal patterns varied significantly by toilet facility type (χ²=94.35, df=12, p<0.01). Among the households, 40% discharged used water outside premises/bushes, 29.5% into yards/gardens, 0.5% through open channels, and only 3.0% used sanitation facilities. This demonstrates that even respondents and their households with water access lack integrated wastewater management systems, potentially creating additional contamination pathways (Table 6).
Table 6: Cross-tabulation and χ2 result for discharge of used water and type of toilet†
| Discharge of used water |
Toilet type n (%) |
|||
|---|---|---|---|---|
| Sanitation facility | Open channel | Space outside premises/bush | Premises yard or garden | |
| Used sanitation facility | 6 (3.0) | 0 (0.0) | 0 (0.0) | 0 (0.0) |
| Used potty inside house | 0 (0.0) | 0 (0.0) | 3 (1.5) | 4 (2.0) |
| Went into yard | 1 (0.5) | 0 (0.0) | 27 (13.5) | 0 (0.0) |
| Went outside premises | 10 (5.0) | 1 (0.5) | 80 (40.0) | 59 (29.5) |
| Not applicable | 0 (0.0) | 0 (0.0) | 2 (1.0) | 7 (3.5) |
† χ2(12)=94.35 (p<0.01)
Environmental factors: soil type and flooding risk
Soil characteristics significantly influenced flooding vulnerability (χ²=8.51, df=1, p=0.004). Communities with loamy soil (52.5%) and sandy soil (36.5%) reported no flooding experience, while 10% in loamy soil areas and 1% in sandy/rocky areas reported moderate flooding risk. Loamy soils, predominant in non-flooded areas, offer advantages for latrine siting and construction, while rocky or flood-prone areas present structural challenges for pit latrine feasibility (Table 7).
Table 7: Cross-tabulation and χ2 result of risk of village flooding and soil condition†
| Village flooding risk | Sandy/hard rocky soil | Loamy soil |
|---|---|---|
| Not subject to flooding | 73 (36.5) | 105 (52.5) |
| Somewhat at risk of flooding | 2 (1.0) | 20 (10.0) |
† χ2(1)=8.51 (p=0.004)
Time interval used for accessing water across villages
One-way ANOVA revealed significant differences in water collection time across villages (F=significant, p=0.01). Communities BA and IT, as well as BE and AY, demonstrated similar water access times (<10 minutes round trip), indicating relatively equitable water infrastructure distribution across study sites. The European Union-funded boreholes provided accessible water within walking distance for most households in all villages (Table 8).
Table 8: Analysis of variance: how long does it take to get water and return?
| Analysis | Degrees of freedom | Sum of squares | Mean square | F statistic | p-value |
|---|---|---|---|---|---|
| Between-group | 3 | 393.756 | 131.252 | 15.147 | <0.01 |
| Within-group | 196 | 1698.399 | 8.665 |
Predictors of water storage expenses
Multiple regression analysis identified significant predictors of household expenses for drinking water storage containers (F(6,193)=7.44, p<0.001, R²=0.188). The model explained 18.8% of variance in storage expenses. Significant predictors included gender (β=340.89, p=0.015), number of adults (β=–139.73, p=0.008), number of infants (β=297.40, p=0.007), preference for phone over latrine (β=570.70, p<0.001), perceived importance of handwashing for children (β=77.80, p=0.001), and child defecation location (β=–191.31, p=0.005). These findings suggest that household members, hygiene perceptions, and economic priorities collectively influence sanitation-related investments (Appendix I).
Discussion
This baseline assessment reveals a stark paradox in the rural state of Osun: near-universal water access (89.5%) coexists with near-universal open defecation (91.5%), highlighting that infrastructure provision alone is insufficient to achieve sanitation goals. The findings illuminate three critical barriers to sanitation adoption that have profound implications for Nigeria's 2030 open defecation-free target and broader CLTS implementation in resource-constrained settings.
The knowledge–practice gap in sanitation behaviour
The study revealed a disconnect between hygiene knowledge and actual sanitation practice, challenging fundamental CLTS assumptions that awareness automatically translates to behaviour change. Over half of respondents (51.5%) who practised handwashing before meals – indicating sanitation awareness – still disposed of faeces in open spaces. This paradox suggests that cognitive recognition of health risks is necessary but insufficient for behavioural transformation.
Previous studies in Ghana20 and India15 similarly documented high sanitation awareness alongside persistent open defecation, attributing this gap to structural barriers including poverty, land scarcity, and social norms. The present study extends available literature by quantifying the specific magnitude of this disconnect and demonstrating its persistence even among educated respondents. Notably, no respondents who washed hands after eating reported proper faeces disposal (toilet flushing), suggesting that even sequential hygiene behaviours remain disconnected from sanitation infrastructure use.
The child faeces management gap further illustrates this paradox. Despite widespread awareness of diarrheal disease risks to children, caregivers routinely disposed of child faeces inappropriately, consistent with findings from Bangladesh23 and Odisha, India15. The perception that child faeces are ‘less dangerous’ than adult faeces – though microbiologically inaccurate – persists across cultures and undermines comprehensive CLTS effectiveness.
Economic constraints and household decision-making
The data demonstrate an entrenched mindset regarding economic prioritization, showing that there is a choice across all income levels – and most acutely within the lowest-earning group (71% of the sampled population) – to allocate limited financial resources to non-sanitation expenses, significantly prioritized mobile phone purchases over latrine construction (p=0.04). This pattern, rather than reflecting ‘irrationality’, reveals the invisible nature of sanitation benefits compared to the immediate, tangible advantages of mobile phones (communication, economic opportunities, emergency access, social capital).
Economic theory explains this through temporal discounting and opportunity costs. Latrine construction requires substantial upfront capital (₦50,000–100,000 (A$52.50–105.00) for basic facilities) with benefits that are preventive and diffuse (reduced illness frequency, dignity, environmental protection). In contrast, mobile phones provide immediate returns. For respondents earning less than ₦50,000 (<A$52.50) monthly, allocating 2 or 3 months' income to sanitation while facing daily food insecurity represents an economically untenable choice.
This finding challenges CLTS's core ‘no subsidy’ principle, which assumes communities can mobilize resources through cost reduction (local materials, communal labour) and collective action.While this approach succeeds in middle-income contexts, the present study data reveal it may be inappropriate for extreme poverty settings. Similar critiques have emerged from evaluations in Ethiopia24 and Kenya25, where non-subsidized CLTS achieved limited sustained coverage among the poorest households.
Environmental constraints to latrine feasibility
The significant association between soil type and flooding risk (p=0.004) highlights often-overlooked environmental determinants of sanitation success. While 52.5% of respondents occupied areas with favourable loamy soils, communities in flood-prone or rocky terrain face structural barriers to conventional pit latrine construction. During rainy seasons (April–October in southern Nigeria), pit latrines in clayey or low-lying areas rapidly fill with water, collapse, or overflow, creating health hazards and financial losses that discourage reconstruction.
The loamy soils prevalent in the study areas (52.5%), while structurally favourable for pit latrine construction, may facilitate bacterial transport to depths of 1 metre within weeks of faecal deposition, through preferential flow pathways26. Furthermore, under tropical conditions, high nitrification rates can result in elevated nitrate relative to ammonium, depending on soil properties, thereby creating groundwater contamination pathways that undermine improved water infrastructure27. Consequently, appropriate siting and design standards become critical in such environments. To mitigate groundwater pollution risks, the base of pit latrines should be positioned at least 2–15 m above the groundwater table and maintain a minimum horizontal distance of 30 m from any water source to limit microbial exposure9,28.
Climate change intensifies these challenges. Increasingly erratic rainfall patterns in West Africa29 produce both extended droughts (affecting water availability for flush latrines) and intense flooding events (destroying pit latrines). CLTS programs rarely incorporate climate adaptation strategies or alternative sanitation technologies (raised latrines, composting toilets, biodigesters) suitable for difficult environments.
Gender and sociocultural determinants of sanitation behaviour
The study highlights a critical need to investigate gender dimensions within local sanitation efforts. Women and girls (46% in this study) bear the brunt of open defecation risks, facing unique menstrual hygiene, safety, and water collection challenges.
Previous studies reveal how inadequate sanitation facilities force women to defecate during darkness for privacy, increasing exposure to violence and snakebites30,31. The present data also indicated that younger household members bear 83% of water collection and cleaning responsibilities, highlighting a critical vulnerability: exposure of children and adolescents to acute occupational health risks through direct faecal contact in the absence of protective equipment in the environment.
The observed high prevalence of open defecation (91.5%) and poor handwashing–sanitation integration (51.5% practising handwashing yet disposing faces openly) cannot be attributed solely to gender dynamics or infrastructure deficits. The study reveals underlying attitudinal and sociocultural factors that fundamentally shape sanitation behaviours; specifically, when the majority of a community engages in open defecation, the practice becomes culturally normalized and ceases to be viewed as deviant or shameful.
This explains why knowledge alone (handwashing awareness) fails to translate to behaviour change – social norms override individual cognition25. Also, a perceived convenience and free open spaces (remarks observed during discussion sessions) revealed that some community members explicitly preferred open defecation, citing the freedom of open spaces, natural privacy of bushes, and avoidance of confined, potentially malodorous latrine structures. This preference, particularly among older adults socialized into these practices from childhood, represents an attitudinal barrier distinct from resource constraints. The perception that ‘our ancestors lived this way and were healthy’ reflects resistance rooted in tradition rather than ignorance26.
Contribution to knowledge and alignment with the Sustainable Development Goals
This study advances CLTS and environmental health studies by providing empirical evidence that challenges key assumptions underlying sanitation behaviour change in rural Nigeria, while directly engaging with Sustainable Development Goal (SDG) 6.2 (equitable access to sanitation) and SDG 3.9 (reduction of disease from environmental pollution). Notably, the findings demonstrate a pronounced knowledge–practice gap: over half of respondents who reported regular handwashing still practised open defecation. This quantitatively documented disconnect, rarely captured in West African CLTS literature, indicates that awareness alone is insufficient to drive sustained sanitation behaviour change and underscores the need for redesigned, context-sensitive CLTS approaches.
The study further reframes poor sanitation not as a function of ignorance but as economically rational decision-making under severe poverty. Households overwhelmingly prioritized essential communication tools over sanitation infrastructure, reflecting constrained livelihood realities rather than behavioural negligence. In addition, integrating environmental feasibility factors, such as soil conditions and flooding risk, with behavioural data revealed that a subset of communities faces structural barriers to conventional pit latrine construction. This methodological contribution strengthens CLTS diagnostics by demonstrating the necessity of aligning sanitation technologies with local ecological conditions, while the documentation of widespread child faeces mismanagement highlights a critical but under-addressed pathway of environmental contamination.
From an SDG perspective, the findings reveals that Nigeria’s ambition of achieving nationwide open defecation–free status by 2030 is unlikely under prevailing non-subsidized CLTS models. To eliminate open defecation by 2030, rural sanitation strategies must combine direct financial subsidies for vulnerable households with diverse technological choices (a range of affordable, adaptable toilet designs) and long-term behavioural change initiatives.. By providing baseline data relevant to SDG 6.2.1, documenting environmental health risks linked to SDG 3.9, and revealing equity and environmental justice gaps, this study contributes actionable evidence for more realistic, inclusive, and sustainable sanitation planning in Nigeria and similar settings.
Conclusion
This study demonstrates a major gap between sanitation awareness, water access, and actual hygiene practices in rural Nigeria, showing that awareness campaigns alone cannot overcome financial insufficiency and environmental limitations. Achieving Nigeria's 2030 open defecation-free target, and broader SDG 6 commitments, requires moving beyond awareness campaigns toward comprehensive interventions addressing economic barriers, environmental feasibility, and long-term sustainability.
CLTS remains a valuable participatory mobilization tool, but its non-subsidized approach appears insufficient for contexts where households earn below poverty thresholds.
The authors recommend adaptive CLTS models incorporating:
- targeted subsidies for the poorest households
- environmental pre-assessments guiding appropriate sanitation technologies
- integration with livelihood programs to address opportunity costs
- routine water quality monitoring for chemical and microbial indicators to quantify contamination and guide water source protection
- strengthened government accountability for infrastructure investment.
Without these policy reforms, rural communities will continue to face impossible choices between immediate survival needs and long-term sanitation investments – perpetuating the environmental health crisis documented in this study.
Funding
This research received no specific grant from any funding agency in the public, commercial, or not-for-profit sectors.
Conflicts of interest
The authors declare that they have no competing interests.
AI disclosure statement
We used artificial intelligence (Claude.ai) to enhance understanding of our own keywords and writing in order to clarify meaning for readers. All content has been thoroughly reviewed, fact-checked, and edited by human authors to ensure accuracy and quality.
References
appendix I:
Appendix
Appendix I: Model statistics for cost of water storageTable A1: Analysis of variance estimate of regression model for cost of water storage
| Model | Degrees of freedom | Sum of squares | Mean square | F statistic | p-value |
|---|---|---|---|---|---|
| Regression | 6 | 36754510.625 | 6125751.771 | 7.439 | <0.001 |
| Residual | 193 | 158932439.375 | 823484.142 |
Table A2: Regression coefficient for fitting a predictive model for cost of water storage
| Variable | Coefficient | Standard error | t statistic | p-value |
|---|---|---|---|---|
| Intercept | –1368.998 | 701.627 | –1.951 | 0.052 |
| Gender | 340.886 | 139.038 | 2.452 | 0.015 |
| Number of adults | –139.734 | 52.175 | –2.678 | 0.008 |
| Number of infants | 297.403 | 108.241 | 2.748 | 0.007 |
| Phone preference | 570.697 | 135.886 | 4.200 | 0.000 |
| Handwashing for children | 77.795 | 22.153 | 3.512 | 0.001 |
| Child defecation location | –191.306 | 67.139 | –2.849 | 0.005 |
Table A3: Model summary statistics for fitting predictive model for cost of water storage
| Model statistic | Estimate |
|---|---|
| R | 0.433 |
| R2 | 0.188 |
| Adjusted R2 | 0.163 |
| Standard error of the estimate | 907.460 |
You might also be interested in:
2013 - Student perception on external clinical teaching visits in a rural medical program
2009 - The changing nature of nursing work in rural and small community hospitals