full article:
Australia remains one of the most sparsely populated nations in the world, with on average only two people per km2, and most of its 21 million people (87%) concentrated in capital cities and urban areas (defined as cities with populations of 250 000 or more). Australia has one of the healthiest populations in the world, but significant inequalities in health still exist, with access to services being a key issue. This is exemplified in dentistry, with oral health services being fundamentally privatised on a patient-payment model. Almost 86% of dentists work in the private sector1 where approximately 80% of all dental care is provided, with only 19% of adults receiving dental care from public dental services annually2.
Australia, like many countries, has a significant shortage of dental practitioners3. This shortage is more acute in rural and remote areas, and among population sub-groups who cannot access private care (mostly those who are economically disadvantaged)1. On the macro-scale the uneven distribution of dental practices between capital cities and rural areas is a significant feature of the Australian dental labour force, with practising rates for capital cities averaging 55.4 dentists per 100 000 population, compared with 28.6 for rural and remote areas4.
Western Australia (WA), Australia's largest state, consists of approximately one-third of the country's landmass and has a population of approximately 2 million people. However, over 85% of this population live in a handful of urban centres with the majority (1.6 million) living in the state capital, Perth. Although the macro-scale difference in dental practice distribution across Australia is known, very little detailed analysis of distribution has been undertaken, particularly in a state with such a large geographic area. The purpose of the study was to examine the distribution of private dental practices in WA, using modern Geographic Information System (GIS) tools.
All data were collected from open access sources which included the Yellow Pages business telephone directory, the Government Gazette and Google Maps.
Dental practice locations
The address for each dental practice in WA was obtained from the Government Gazette and crossed checked against the Yellow Pages as at June 2009. All addresses were entered into a database and the longitude and latitude of each practice address was obtained using a free access geo-coding website (http://batchgeo.com). A randomly selected sample of 10% of all geo-coded practices was tested against personal knowledge and phone calls to test the integrity of the data (the confirmatory sample was found to be 100% concordant with the data collected from electronic sources).
Population statistics
All population data were obtained from the 2006 Australian Census5. Population data were divided by census district (CD) from the Australian Bureau of Statistics website (http://www.abs.gov.au).
Socio economic status
The Index of Relative Socio-Economic Disadvantage (IRSD) aggregated to CD level formed the basis of the measure of socio-economic disadvantage. The IRSD is a composite measure derived from multiple weighted socio-economic variables which include income, educational attainment, employment and possession of motor vehicles collected in the 2001 Australian Bureau of Statistics Census. This index includes all variables that either reflect or measure disadvantage. The IRSD values were ranked into deciles ranging from one to 10.
Post office
Western Australia's primary post office (GPO) based in Perth at 3-7 Forrest Place (lat 31.951143, long 115.859156), was used as a central datum point. The longitude and latitude of the GPO was obtained from Google Maps, used worldwide for mapping and accurate up to 6 decimal points of latitude and longitude.
Geo-coding
Geographic boundary data for each CD was obtained from the Australian Bureau of Statistics, and the population and socio-economic data were geo-coded using ArcGIS v9 (ESRI; Redlands, CA, USA). Analysis of geographic measures was completed using the ArcGIS software.
Graticule calculations
A sequence of maps at different magnifications was produced and overlayed with graticules (the familiar map grid of latitude and longitude lines). For high magnification maps the square graticules were 0.025 decimal degrees areas, while for medium magnification they were 0.25 decimal degrees, and for the lowest state-wide maps they were 2.5 decimal degrees. These graticule squares equate to areas of approximately 7.7, 7700 and 77 000 km 2 (Fig1). These are only approximate decimal degree conversions to linear distances as the conversion is slightly affected by differences in latitudes due to the curvature of the earth's surface.
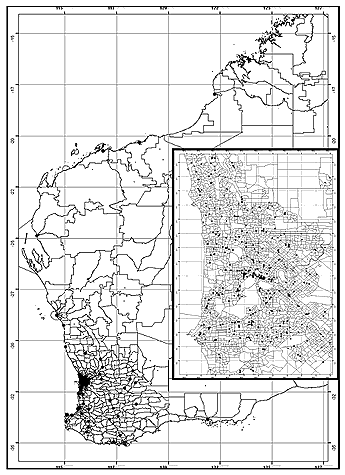
Figure 1: Graticule squares of differing sizes were overlayed on the Western Australia state map and the number of dental practices in each square analysed. Higher resolution graticules were applied to the city and metropolitan area.
A total of 602 private dental practices were geo-coded in WA.
Distance from GPO
A series of concentric distance rings at exponentially growing distances were drawn around the GPO. The total number of practices in each ring was calculated (Fig2); more than 75% of all practices were within 32 km of the GPO and almost 95% were within 256 km .
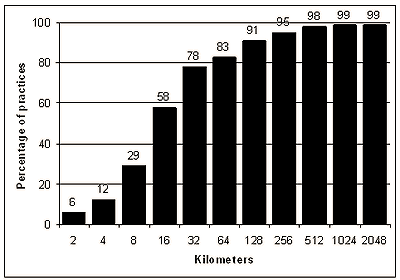
Figure 2: The cumulative proportion of private dental practices at various distances from the Perth central post office.
Population proximity calculations
The total population of WA distributed by CD (n=4370) was overlayed on the dental practice distribution. Two kilometre boundaries were applied to each of the private dental practices and the CDs that were within or overlapping each 2 km buffer were determined (Fig3). The number of people outside these 2 km buffers was 345 000 from 1092 CDs, out of a total WA population of 1.95 million. Fewer dental practices were found in regions with a high proportion of disadvantaged residents.
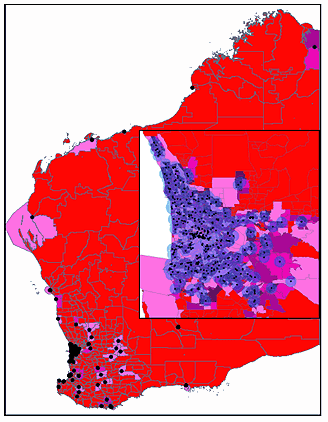
Figure 3: A map of Western Australia with each private dental practice (black dot) highlighted. Each census district outside a 2 km zone (transparent blue) around each practice is highlighted in red, while census districts within (or touching) the 2 km zones are shaded in different levels of pink dependent on residents' socioeconomic status. The darker the pink, the more disadvantaged the residents. The insert is a magnified view of the metropolitan area of state capital Perth.
Graticule calculations
The total number of dental practices in each graticule square was calculated (Fig1) and frequency plots made for Perth city, metropolitan Perth, the wider Perth region, the southwest corner of WA, and state-wide WA (Fig4). This systematic approach to looking at distribution of dental practices independent of underlying factors gives a clear measure of the 'clumping' of service delivery. In disciplines where access to services is important, especially for emergency care, an even distribution would be expected. The current data does not support that for dental services in WA. The frequency plots for each of the 5 regions were completed excluding the regions that were contained within it but that had been previous calculated. For example, the southwest frequency plot includes all dental practices in the southwest, but does not include those already counted in the Perth city and Perth metropolitan frequency plots. In the inner city the number of practices per graticule square ranged from 0 to 8 with 95% of all squares containing one or more practices and 30% containing more than 5 practices (Fig4a). However, at the state-wide level over 75% of graticule squares had no dental practices at all (Fig4e; the latter graticule squares are 1000 times the area of those used at the inner city level).
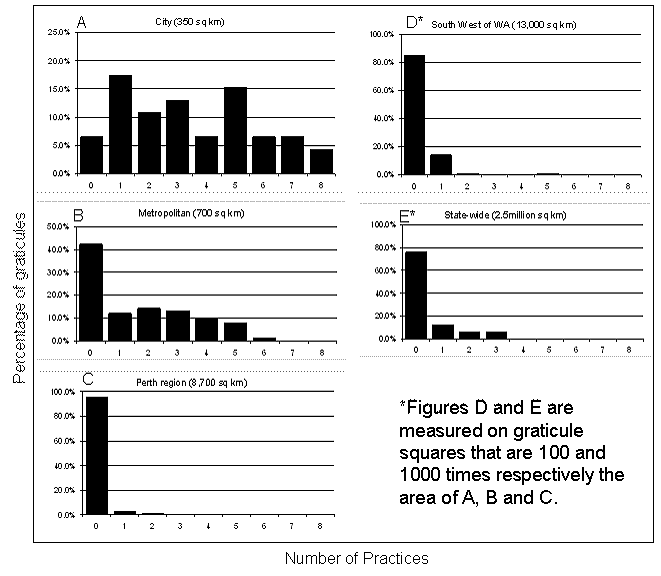
Figure 4: The number of private dental practices per graticule square for: (A) Perth city centre; (B) metropolitan Perth; (C) wider Perth region; (D) southwest region; (E) and state-wide.
Discussion
Australia is geographically one of the world's largest countries but it has a very small population whose distribution is highly uneven. The provision of health care under these circumstances is a complex task, particularly when the disease burden is unevenly distributed through the population, and in a distribution that does not match population distribution. Oral health is an outstanding example of this problem. The distribution of the primary disease, dental caries, is highly associated with socioeconomic status6,7, with a gradient effect from wealth to poor. In addition, sub-sets of the community are known to be at high risk (particularly Aboriginal and Torres Strait Islander people who are known to suffer significantly more dental caries)8-10. The distribution of these population groups is almost inverse to the total population distribution, with most living in rural and remote areas.
In Australia the majority of adult oral health care is provided through private dental practice, and in the vast majority of cases by direct payment to the practitioner (with approximately 50% of the population having health insurance which covers a proportion of the cost)11. A small amount of 'safety net' government-subsidised care is provided to less affluent members of the Australian community12. It is under these circumstances that the distribution of private dental practices is a critical measure of service supply. However, it is recognised that the actual workforce operating in these practices is also important.
The key finding of this study is that practices are highly concentrated in the most populous area of WA and the number of practices outside this region is very small. Even when examining practice distribution within the metropolitan region, fewer dental practices are located in areas of lower socioeconomic status than in their wealthier counterparts. This is not unexpected because practice operation is fundamentally on a user-pays basis. However, it is quite opposite to the distribution of dental disease within the community where there is an increase in dental disease burden in populations of lower socioeconomic status13-16.
This is the first high acuity examination of private oral health service locations in Australia. Historically, dentist to population ratios and low resolution data have always relied on for planning purposes. The simple application of high resolution Geographic Information Systems (GIS) systems to health service planning has been used in many other disciplines. Some examples include assessment of accessibility of GPs in South Australia17, comparison of location and accessibility of Australian chronic heart failure management programs, and general practice distribution18, but there is little similar research in dentistry in other world regions. However, a few studies in the USA have looked at analysing location-based accessibility to dental services and also the distribution and demographics of dentists19,20.
In summary, this high acuity examination of private dental practices location has found that the inverse care law still exists and practice locations are determined by factors other than disease21-23. A thorough analysis of this distribution can also contribute to the knowledge of referral patterns for specialist care.
Overcoming this issue poses a challenge. First, are public dental clinics in these rural and remote areas able to provide adequate dental care where private practices are non-existent? A recent Australian study suggests that in respect to the accessibility of public dental services, Western Australians appear to be in a poor position compared with those living in the states of Victoria and Queensland24 . Strategies to motivate dentists to work in rural and remote areas must be developed.
As the University of WA (UWA) is the only dental school in the State, one strategy may be to increase the number of rural students admitted into dentistry, assuming that they are more likely to choose a practice location in their home communities. The Rural Student Recruitment program may provide a second strategy. This program provides increased awareness and information about medicine or dentistry as a career, and the support programs available for prospective students from rural and remote areas. In addition, a short-stay rural and remote placement model for the fifth year dental students to experience working in rural and remote areas has been adopted at UWA.
However, after all these strategies it is likely that a shortage will remain. Hence there is a need for collaboration among dental professionals, governments and communities to develop better strategies to recruit and retain dentists in WA's rural and remote areas. This may be achieved by the vertical integration of service, education and research, and also with a strong clinical governance framework and support network25,26.
Those who live outside WA's metropolitan areas, especially in rural and remote areas, are at great disadvantage in accessing private oral health services. The use of high acuity GIS mapping can assist in planning health services to address this concerning issue.
Acknowledgement
The authors acknowledge the contribution of Dr Pricella Lam in the development of this project.
References
1. Marshall RI, Spencer AJ. Accessing oral health care in Australia. Medical Journal of Australia 2006; 185(2): 59-60.
2. Australian Institute of Health and Welfare, Dental Statistics and Research Unit. Oral health and access to dental care-1994-96 and 1999. Research report. Adelaide: AIHW Dental Statistics and Research Unit, Adelaide University, 2001.
3. Tuesner DN, Spencer AJ. Projections of the Australian dental labour force. AIHW cat no POH1. Canberra, ACT: Australian Institute of Health and Welfare, 2005.
4. Australian Bureau of Statistics. Australia's health work force: selected health occupations. Canberra, ACT: ABS, 2006.
5. Australian Bureau of Statistics. Census Dictionary Australia. Cat no. 2901.0.2006. Canberra, ACT: ABS, 2006.
6. Reisine ST, Psoter W. Socioeconomic status and selected behavioral determinants as risk factors for dental caries. Journal of Dental Education 2001; 65(10): 1009-1016.
7. Australian Institute of Health and Welfare, Dental Statistics and Research Unit. Oral Health of Public Dental Patients in Rural Areas. Adelaide, SA: AIHW, 2002.
8. Australian Institute of Health and Welfare, Dental Statistics and Research Unit. Oral Health of Aboriginal and Torres Strait Islander Persons. Cat no DEN 108. Adelaide, SA: AIHW, 2003.
9. Endean C, Roberts-Thomson K, Wooley S. Anangu oral health: The status of the Indigenous population of the Anangu Pitjantjatjara lands. Australian Journal of Rural Health 2004; 12: 99-103.
10. Smith K, Kruger E, Dyson K, Tennant M. Oral health in rural and remote Western Australian indigenous communities: a two-year retrospective analysis of 999 people. International Dental Journal 2007; 57(2): 93-99.
11. Brennan D, Spencer A, Szuster F. Insurance status and provision of dental services in Australian private general practice. Community Dentistry and Oral Epidemiology1997; 25(6): 423-428.
12. Schwarz E. Access to oral health care - an Australian perspective. Community Dentistry and Oral Epidemiology 2006; 34(3): 225-231.
13. Patrick DL, Yin Lee RS, Nucci M, Grembowski D, Jolles CZ, Milgrom P. Reducing oral health disparities: a focus on social and cultural determinants. BMC Oral Health 2006; 6(Suppl1): S4.
14. Sisson KL. Theoretical explanations for social inequalities in oral health. Community Dentistry and Oral Epidemiology 2007; 35: 81-88.
15. Healthy Mouths, Healthy Lives. Australia's National Oral Health Plan 2004-2013. Adelaide, SA: National Advisory Committee on Oral Health, 2004. Available: http://www.ada.org.au/app_cmslib/media/lib/0610/m29653_v1_nacoh%20oral%20health%20care.pdf
16. Watt R. From victim blaming to upstream action: tackling the social determinants of oral health inequalities. Community Dentistry & Oral Epidemiology 2007; 35(1): 1-11.
17. Bamford EJ, Dune L, Hugo GJ, Taylor DS, Symon BG, Wilkinson D. Accessibility to general practitioners in rural South Australia. Medical Journal of Australia 1999; 171(11-12): 614-616.
18. Clark RA, Driscoll A, Nottage J, McLennan S, Coombe DM, Bamford EJ et al. Inequitable provision of optimal services for patients with chronic heart failure: a national geo-mapping study. Medical Journal of Australia 2007; 186(4): 169-173.
19. Horner M, Mascarenhas A. Analyzing Location-Based Accessibility to Dental Services: An Ohio Case Study. Journal of Public Health Dentistry 2007; 67(2): 113-118.
20. Krause D, Frate DA, May WL. Demographics and distribution of dentists in Mississippi: A dental work force study. Journal of the American Dental Association 2005; 136(5): 668-677.
21. Hart JT. The inverse care law. Lancet 1971; 1: 405-412.
22. Vargas CM, Ronzio CR. Relationship Between Children's Dental Needs and Dental Care Utilization: United States, 1988-1994. American Journal of Public Health 2002; 92(11): 1816-1821.
23. Furler JS, Harris E, Chondros P, et al. The inverse care law revisited: impact of disadvantaged location on accessing longer GP consultation times. Medical Journal of Australia 2002; 177: 80-83.
24. Perera I, Kruger E, Tennant M. Rural Public Dental Clinic Distribution in Three States of Australia: Using Spatial Analysis to Inform Management and Planning of Services. Asia Pacific Journal of Health Management 2010; 5(1): 40-46.
25. Steele L, Pacza T, Tennant M. Rural and remote oral health, problems and models for improvement: a Western Australian perspective. Australian Journal of Rural Health 2000; 8(1): 22-28.
26. Kruger E, Jacobs A, Tennant M. Sustaining oral health services in remote and Indigenous communities: a review of 10 years experience in Western Australia. International Dental Journal 2010; 60(2): 129-134.
