

Introduction
Diabetes mellitus (DM) is a chronic disease, which has evolved into a global challenge and a burden on healthcare services1. DM has reached epidemic proportions in both low- and high-income countries in the past few decades2. There has been no nationwide survey on the prevalence of type 2 DM (T2DM) in Norway; however, in 2004 it was estimated at around 3.4% in adults aged 30 years and older3. The prevalence of all types of DM in the first survey of the Population-based Study on Health and Living Conditions in Regions with Sami and Norwegian Populations (the SAMINOR 1 Survey, 2003–2004) was 4.6% among inhabitants of rural areas in Northern and Middle Norway, with a remarkable heterogeneity across different geographical regions4; prevalence was higher among the Sami in southern municipalities and generally lower further north.
The Sami are an indigenous people who constitute an ethnic minority in the northern parts of Norway, Sweden and Finland, as well as in Russia’s Kola Peninsula. In Norway, the traditional Sami settlement area stretches from Finnmark County in the north to Engerdal in Hedmark County in the south. The number of Norwegian Sami has been estimated between 40 000 and 50 0005. Although this estimate has major limitations, no updated, reliable estimates exist. The Sami people harbor a rich variety of cultures, habits, rituals, languages, and livelihoods. Northern Norway is also home to the Kvens, an ethnic group with a long-standing attachment to that region. The Kvens are descendants of Finnish-speaking settlers who immigrated from Sweden and Finland in the 1700s and 1800s6 and were recognized as a national minority in 19987.
There is a lack of comprehensive information on health status and on the chronic and lifestyle-related disease burden among various ethnic groups in Northern Norway. However, numerous studies have reported an increasing prevalence of lifestyle-related diseases among indigenous populations in other countries8,9. Therefore, this study aimed to compare the prevalence of DM between Sami and non-Sami inhabitants of Northern Norway participating in the SAMINOR 1 Survey and the SAMINOR 2 Clinical Survey, and to track DM prevalence over time.
Methods
In 2003–2004, the Centre for Sami Health Research at UiT The Arctic University of Norway, in collaboration with the Norwegian Institute of Public Health, undertook the SAMINOR 1 Survey (hereafter referred to as SAMINOR 1)10. This survey included 24 mostly rural municipalities and districts in Northern and Middle Norway, where the proportion of inhabitants belonging to the Sami ethnic group is high according to ethnic and language information registered in the 1970 census, and historical and local knowledge about traditional Sami settlement regions. Information from the National Registry was used to invite inhabitants aged 30 and 36–79 years to participate, regardless of their ethnic group. The single cohort of 30-year-olds were invited due to collaboration with a regional screening of certain cohorts. Data were collected through self-administered questionnaires, a clinical examination, and analysis of blood samples.
The Centre for Sami Health Research conducted a second clinical survey, the SAMINOR 2 Clinical Survey (hereafter referred to as SAMINOR 2), in 2012–2014, which consisted of self-administered questionnaires, a clinical examination, and analysis of blood samples. Individuals aged 40–79 years were included from 10 municipalities in Finnmark, Troms, and Nordland counties. These same 10 municipalities were also included in SAMINOR 1:
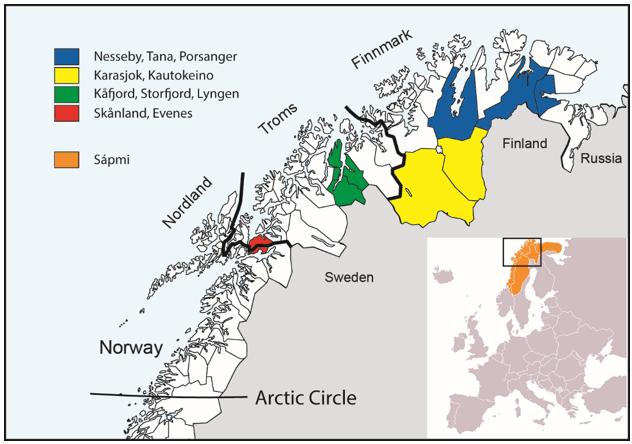 Figure 1: Map of Northern Norway, Sápmi, and the included municipalities in SAMINOR 1 and 2.
Study sample
The present analyses are based on cross-sectional data from two points in time of inhabitants aged 40–79 years residing in the 10 municipalities included in both SAMINOR 1 and SAMINOR 2.
In SAMINOR 1, 11 518 inhabitants aged 40–79 years from the 10 municipalities were invited, and 6587 underwent clinical examinations (57.2%). Of the 6587 eligible participants, 175 people who did not complete the questionnaire that collected information on ethnicity, 14 with missing plasma glucose values, 86 foreigners, and 27 with unknown ethnicity were excluded, leaving 6285 participants (54.6%) in the present analyses.
In SAMINOR 2, 12 455 inhabitants aged 40–79 years from the 10 municipalities were invited, and 6004 participated (48.2%). Of the 6004 eligible participants, 21 who did not complete the questionnaire that collected information on ethnicity, 25 with missing plasma glucose values, 96 foreigners, and 97 with unknown ethnicity were excluded, leaving 5765 (46.3%) individuals in the present analyses.
Data collection
In both SAMINOR 1 and 2, an invitation was mailed several weeks before the survey with information on the time and place of screening, relevant and required information about the survey, and questionnaires. The questionnaires were returned by the participants at the time of the clinical examination10.
In SAMINOR 1, all participants received three self-administered questionnaires (nine pages in total): An initial questionnaire that contained a variety of questions, including questions about ethnicity; a screening questionnaire that collected information about symptoms, lifestyle factors, and some diseases, including DM; and an additional questionnaire that collected cultural, social, and nutritional information. The questionnaires were prepared in Norwegian and translated into the three main Sami languages. Almost 97% of the participants in the present study completed the Norwegian version of the questionnaire. The clinical examination was carried out in two buses that moved throughout the study area, spending 1–6 weeks in each of the municipalities included in this analysis10. In 9 of the 10 municipalities, non-responders got a second chance to attend when the buses returned a couple of months later.
In SAMINOR 2, participants aged 40–69 years received an eight-page questionnaire with a broad range of questions on lifestyle, diet, risk factors, and diseases. A shorter questionnaire (four pages with larger fonts) was sent to inhabitants aged 70–79 years. The questionnaires were prepared in Norwegian and translated into the Northern Sami language. Less than 5% of participants chose to use the Sami questionnaire. The clinical examination was performed at 10 temporarily established health examination sites in nine municipalities. In each municipality, data collection was carried out within 2–7 weeks.
In both SAMINOR 1 and 2, height and weight were measured using an electronic height and weight scale, with participants wearing light clothing without shoes. Body mass index (BMI) was calculated as weight in kilograms divided by the square of the height in meters (kg/m2). Waist circumference (WC) was measured at the umbilicus with the participant standing and breathing normally. Waist-to-height ratio (WHtR) was calculated by dividing waist circumference by height both in centimeters. Finally, non-fasting blood samples were taken by venipuncture at normal venous pressure with the participant in a seated position and used to determine blood glucose. In SAMINOR 1, blood samples were sent by post directly to the laboratory and analysed consecutively. In SAMINOR 2, blood samples were initially frozen and sent to the laboratory later.
The Norwegian Prescription Database
The Norwegian Prescription Database (NPD) at the Norwegian Institute of Public Health (NIPH) contains a complete listing of all prescribed drugs dispensed by pharmacies in Norway from 1 January 200411. NIPH provided information on the number of users (per 1000) who were given a drug with Anatomical Therapeutic Classification code A10B in all 10 municipalities for the years 2004–2015, aggregated by sex and 10-year age groups. A user was defined as a person who has received at least one prescription from a pharmacy in Norway in a given year11. NPD data was used as an independent source of information to which results from SAMINOR data was compared.
Ethnicity
Information on ethnicity was obtained from the questionnaires. The questions were ‘What language(s) do/did you, your parents and your grandparents use at home?’, ‘What is your, your father’s and your mother’s ethnic background?’, and ‘What do you consider yourself to be?’ On all items the response options were ‘Norwegian’, ‘Sami’, ‘Kven’, and ‘Other’. The questions were to be answered separately for each relative, and multiple answers were allowed. Participants were categorized as Sami if they responded that they either considered themselves to be Sami or reported to have a Sami ethnic background, and if in addition at least one of their grandparents, parents, or they themselves spoke a Sami language at home. All other participants were categorized as non-Sami.
Diabetes mellitus
Both questionnaire information and non-fasting/random plasma glucose (RPG) levels were used to categorize participants as having DM. In SAMINOR 1, the question concerning diabetes was ‘Do you have or have you had diabetes?’ In SAMINOR 2, the question was ‘Have you ever been diagnosed with diabetes (elevated blood sugar levels)?’ The available answers were ‘yes’ or ‘no’. Missing values in SAMINOR 1 (n=349) and 2 (n=136) were classified as ‘no’. All participants with RPG levels of 7.5 mmol/L or higher were also classified as having DM, regardless of their reply in the questionnaire. No distinction was made between different types of DM (type 1, type 2 or gestational) due to lack of information in SAMINOR 1.
Statistical analysis
Data management and statistical analysis were done using STATA version 14.1 (Stata Corp, http://www.stata.com). Differences in age, BMI, WC and WHtR between ethnic groups and by sex in the two SAMINOR surveys were assessed using two independent samples t-tests. Normality of the variables was assessed using distribution histograms. The direct method was used to age-standardize the prevalence of DM, using the population invited to SAMINOR 2 as the standard population. Prevalence of DM was calculated with 95% confidence intervals (CIs) for different sexes, ages, and ethnic groups. Due to large sample sizes, CIs were calculated based on normal approximation. Ethnic differences in the prevalence of DM in each age group and sex were tested by Χ2 tests. A large number of participants in SAMINOR 2 also participated in SAMINOR 1. Because the two samples cannot be assumed to be independent, no statistical test was performed to compare the total age-standardized prevalence in the two SAMINOR surveys. However, overlapping of participants between SAMINOR 1 and 2 in the age groups 60–69 and 70–79 years, respectively, was less of a problem as the surveys were conducted 8–11 years apart. For these two age groups, differences in the prevalence of DM between SAMINOR 1 and SAMINOR 2 for corresponding age, sex and ethnic groups were tested using a large sample test for difference between two proportions.
Ethics approval
The SAMINOR Study was approved by the Norwegian Data Inspectorate and the Regional Committee for Medical and Health Research Ethics. The committee also approved the present study with the approval number 2016/173. All included participants gave written informed consent.
Results
BMI was higher among Sami than non-Sami participants in both surveys, except for men in SAMINOR 2. On the other hand, WC was higher among non-Sami men compared to their Sami counterparts. Although Sami women had statistically significantly higher WC in SAMINOR 1, this discrepancy was not observed in SAMINOR 2. WHtR was higher in Sami men and women compared to their non-Sami counterparts in both surveys. Participants in SAMINOR 2 were approximately 3 years older than participants in SAMINOR 1 (Table 1). The mean BMI (regardless of ethnicity) increased slightly in men but remained almost unchanged in women, while the mean WC and WHtR increased substantially in both sexes and in both ethnic groups (Table 1).
In SAMINOR 1, 587 (9.3%) participants were categorized as having DM. Of these, 289 (4.6% of all participants and 49.2% of those categorized as having DM) reported having DM in the questionnaire; the remainder were categorized as having DM due to RPG levels of 7.5 mmol/L or higher (results not shown). In SAMINOR 2, 684 (11.9%) participants were categorized as having DM, of whom 499 (8.7% of all participants and 73.0% of those categorized as having DM) reported having DM in the questionnaire (results not shown). The total age-standardized prevalence of DM in SAMINOR 1 and 2 was 10.0% (95%CI 9.2–10.7) and 11.2% (95%CI 10.4–12.0), respectively (results not shown).
The total age-standardized prevalence of DM remained fairly unchanged in both sexes and ethnic groups (Table 2). Regardless of ethnicity, while there was no sex predilection in the prevalence of DM in SAMINOR 1, men had a statistically significantly higher prevalence of DM in SAMINOR 2 (13.1 v 10.9, p=0.01).
For inhabitants aged 40–79 years in the 10 included municipalities, information from the NPR demonstrated an increase in the number of people using oral hypoglycemic agents for T2DM in the period 2004–2015 (Fig2). The increase was most prominent in men and elderly participants. In 2004, 4.6% of the inhabitants were using medications for T2DM, whereas 6.8% of inhabitants were using them in 2015. However, the pace of this increase was more stable during the last few years of the study.
Table 1: Selected characteristics of participants in the SAMINOR 1 Survey (2003–2004) and the SAMINOR 2 Clinical Survey (2012–2014)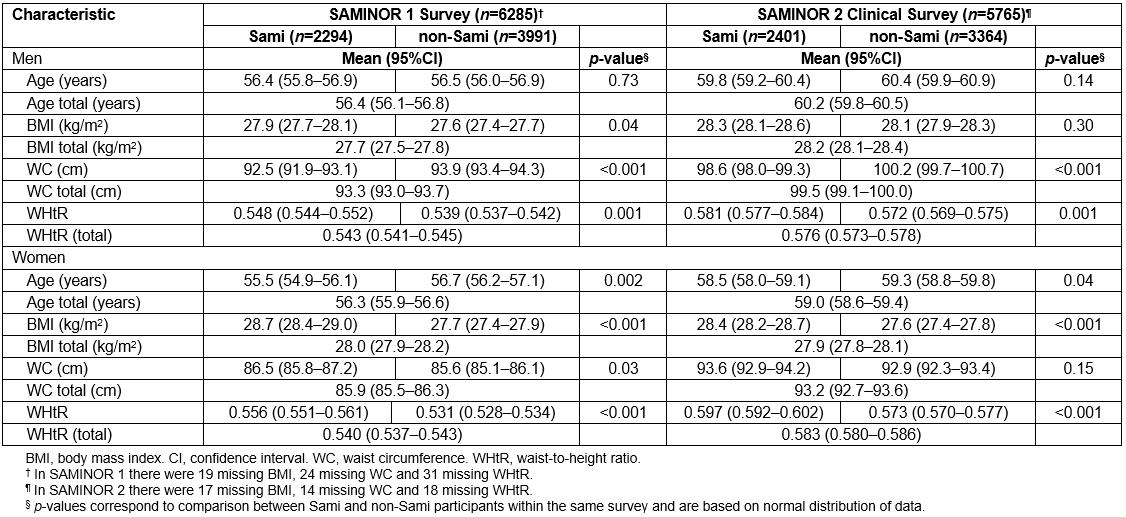
Table 2: Prevalence of diabetes mellitus in the SAMINOR 1 Survey and the SAMINOR 2 Clinical Survey by sex, age, and ethnicity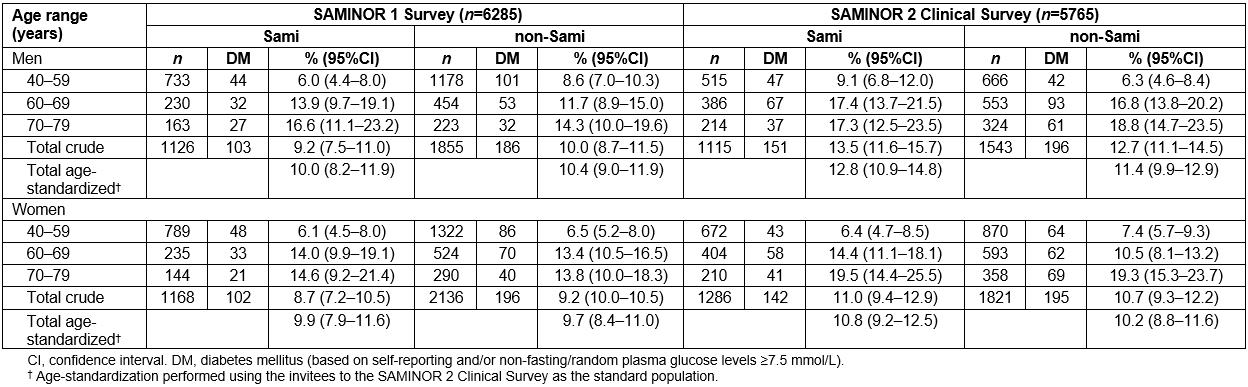
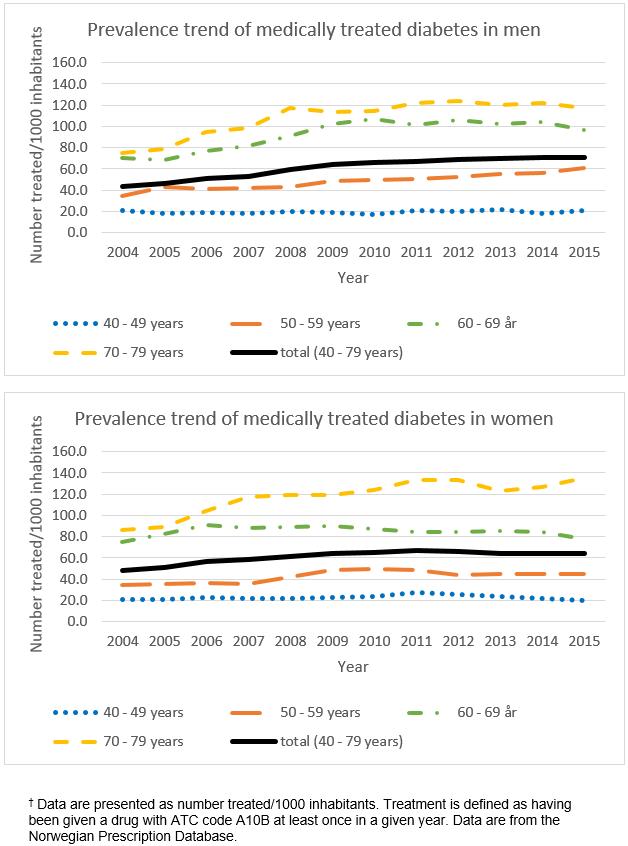 Figure 2: Use of oral glucose-lowering agents over the period 2004–2015 for men and women aged 40–79 years in the 10 municipalities included in the SAMINOR 2 Clinical Survey.†
Discussion
Main findings
Overall, no difference in the prevalence of DM by ethnic group was observed. Total age-standardized prevalence of DM in SAMINOR 1 and 2 were 10.0% (95%CI 9.2–10.7) and 11.2% (95%CI 10.4–12.0), respectively. In the 10 included municipalities, the number of people using oral hypoglycemic agents increased in the period 2004–2015. For both ethnic groups, mean WC and WHtR increased substantially in both sexes.
Increase in the proportion of diagnosed cases of DM: In 2015, the International Diabetes Federation estimated that around half of adults with T2DM worldwide were undiagnosed12. Although the total age-standardized prevalence of DM was similar in SAMINOR 1 and 2, the percentage of self-reported (ie known) cases of DM increased from 49.2% of total diabetics to 73.0%. The results are in accordance with findings of increased T2DM treatment in the NPD in the same municipalities. A plausible explanation may be higher awareness of DM in the general population and among healthcare providers, as well as more accessible diagnostic procedures. Strøm et al. reported that the number of people starting glucose-lowering agents between 2006 and 2011 in Norway remained rather consistent, at 16 000 new cases each year13. This number applies to all of Norway and does not take into account undiagnosed cases of T2DM, or those who manage it by diet and/or physical activity alone. The unchanged prevalence of DM in the present study may be attributable to the rather constant characteristics and demographic composition of the study population. It may take more time for the increase in abdominal obesity (WC and WHtR) observed between SAMINOR 1 and 2 to show its effects. On the other hand, this increase in WC and WHtR may have been compensated for by other factors such as enhanced physical activity. Unfortunately, there is lack of comparable information on physical activity and therefore it is not possible to assess whether physical activity levels changed in the period between the two SAMINOR surveys. As DM is a chronic disease that develops over a long period of time, one could expect that any changes in predisposing or protective factors would have a gradual effect, with resultant changes observed first in the prevalence of pre-diabetes.
No ethnic difference in the prevalence of DM: Similar to previous SAMINOR 1 publications including all 24 municipalities, no overall difference in the prevalence of DM between Sami and non-Sami populations was found in this study4,14,15. A relatively similar and homogeneous prevalence of DM among Sami and non-Sami inhabitants in Northern Norway may imply a similar lifestyle and equal access to healthcare information and services, even in rural districts. It should be mentioned that the included municipalities in the present survey were heterogeneous in terms of location, climate, ethnic composition of inhabitants, severity of assimilation and so-called Norwegianization policies in the past decades, inhabitants’ profession, diet, cultures and language.
DM among other indigenous peoples worldwide: Publications on the prevalence of DM in other Arctic indigenous peoples aged 40–79 years are scarce. In 1999–2001, the prevalence of DM among Inuit migrants in Denmark aged 35 years and above was 10.2%16. In 2007–2008, the prevalence of self-reported DM among the Inuit population in Canada aged 50 years and older was 12.2%17. These prevalence figures are similar to the present results. However, methods of determining diabetes cases differed. A recent study based on self-reported disease in Inuit aged 20 years and older in 2005–2006 and 2007–2008 suggests that the Inuit have a statistically significantly lower prevalence of DM than Métis, First Nations, and their non-indigenous counterparts, which had a similar burden of disease18. Nonetheless, obesity rates among Canadian Inuit are high, especially among women. Abdominal adiposity is the prominent form of adiposity among Inuit women19.
Sex difference in the prevalence of DM: Although no sex difference in the prevalence of DM was observed in SAMINOR 1, women had a statistically significantly lower prevalence of DM in SAMINOR 2. In 2015, the International Diabetes Federation estimated that adult (20–79 years) men were globally more affected by DM than women12. In 2016, it was estimated that for every 10 men with DM in Norway, there were eight women with DM20. A higher incidence rate and a different risk factor profile were observed for men in the fourth survey of the Tromsø Study21. Various risk factors for DM may affect men and women differently22, and the male sex can only be a proxy for them.
Non-fasting plasma glucose in diagnosing diabetics: In both SAMINOR 1 and 2, participants were categorized as having DM based on either self-report or elevated RPG levels (≥7.5 mmol/L). Medical guidelines accept RPG of ≥11.1 mmol/L in the presence of classic symptoms of DM as a diagnostic criterion23. The RPG cut-off of 7.5 mmol/L was chosen based on a validation study by Ziemer et al24, in which the authors found that an RPG cut-off of 7.5 mmol/L gave almost the same sensitivity (~28%) and positive predictive values (PPV; ~26%) given 75 g oral glucose tolerance test as standard. At a PPV-to-sensitivity ratio of 1, the most accurate measure of the number of patients in the population is provided25. However, the study by Ziemer et al. was based on a smaller sample (n=990), with a different age span (18–75 years), a higher mean BMI (30.4), and a lower prevalence of DM than in the present study sample. Hence, whether an RPG cut-off of 7.5 mmol/L yields the same PPV-to-sensitivity ratio in the present study is unknown. Besides this methodology, the present study’s data in SAMINOR 2 (where HbA1c results were at hand) showed a good agreement between RPG cut-off of ≥7.5 mmol/L and HbA1c of ≥6.5%, the latter being the recommended and preferred test to diagnose DM (results not shown). As the RPG cut-off was applied for all sexes and ethnic groups in SAMINOR 1 and 2, the comparison between different groups was probably not markedly affected.
Questionnaire validity: The validity of the SAMINOR questions on diabetes is unknown. The validity of questionnaires varies considerably according to the setting of the study, the design of the questionnaire, target population characteristics, and the burden of the disease26. In the Atherosclerosis Risk in Communities Study in the USA, the sensitivity and PPV of prevalent, self-reported DM ranged from 58.5% to 70.8% and from 60.4% to 72.3%, respectively, depending on the cut-off used for fasting plasma glucose (gold standard) and medication use27. In the French CADEUS study, the sensitivity and PPV of self-reported DM were 86.7% and 73.4%, respectively, using previous medical history as the gold standard28.
Strengths and limitations
The participation rate (54.6% in SAMINOR 1 and 46.3% in SAMINOR 2) is regarded as acceptable. Due to practical issues in SAMINOR 2, there was no second opportunity for participants to be examined, resulting in a lower participation rate compared to SAMINOR 1. The study was performed in municipalities with a high proportion of Sami inhabitants, including both coastal and inland regions. Self-reported ethnicity information enabled comparisons of Sami and non-Sami. The NPD provided a valid and independent source of information11.
Although the surveys had relatively large overall sample sizes, low power might be a problem when analyzing subgroups. Due to the cross-sectional study design, it was not possible to explore the risk factors for DM in Sami and non-Sami. Inherent to observational studies like the SAMINOR Study is the possibility that severely diseased people as well as completely healthy people might not participate in the survey, which could lead to selection bias. There is limited knowledge regarding non-responders, except that they tended to be younger and male. In SAMINOR 1, lower participation among single people was also observed10,15. This was in accordance with observed trends in recent Norwegian and international population-based surveys29-31. Lack of ethnic registry information from the total source population precluded assessment of whether the distribution of ethnic groups in the SAMINOR surveys reflected that of the actual population in the geographical regions. Participation rates varied across municipalities. As a consequence, the contribution of the Sami versus non-Sami from each municipality differed from SAMINOR 1 to SAMINOR 2, which makes the comparison of DM prevalence between the two studies challenging.
Applying 2-hour post-prandial glucose measurement or fasting plasma glucose measurements was not feasible in the survey due to the large number of participants examined throughout the day. In SAMINOR 1, the portable glycated hemoglobin (HbA1c) instruments were inadequate for conducting HbA1c measurements in the buses where clinical examinations took place. Moreover, the survey took place in provincial areas at long distances from the medical laboratory. HbA1c was measured in SAMINOR 2, but as there were not these data for SAMINOR 1, HbA1c was not taken into account in the present study.
In SAMINOR 1, the questions regarding diabetes were congruent. In SAMINOR 2, contrary to SAMINOR 1, the question about diabetes was followed by three questions asking the participants about the type of diabetes they were diagnosed with (T1DM, T2DM, or gestational diabetes). This difference in methodology made it more likely that the participants would report DM in SAMINOR 2. However, in those aged 40–79 years, unpublished results from the SAMINOR 2 Questionnaire Survey, which had exactly the same question about diabetes as SAMINOR 1, showed similar self-reported diabetes prevalence to the SAMINOR 2 Clinical Survey.
Different types of DM (T1DM, T2DM, or gestational DM) were not distinguished from each other in SAMINOR 1 owing to insufficient information acquired through questionnaires. Considering that T2DM accounts for ∼90–95% of those with diabetes32, and given the age of the participants in both studies (40–79 years), most of the DM cases are expected to be T2DM.
Considering the relatively small number of municipalities included in this study, it is not certain that the results illustrate the real health status and disease burden of the Sami as well as other inhabitants in Northern Norway.
Conclusion
The high prevalence of DM in Sami and non-Sami of both sexes demands attention and comprehensive prevention measures. Longitudinal studies with valid endpoint registers are needed in order to determine the effects of known and unknown risk factors, and whether these differ in Sami and non-Sami.
Acknowledgement
We are indebted to the participants of the SAMINOR Study, without whom our research would be impossible.