


Introduction
Skin diseases are common public health problems and cause a significant burden. Morbidity and mortality from skin diseases are expected to increase, and the prevalence of these diseases and related healthcare spending is considered to be among the fastest growing for any medical condition1-3. Dermatologists are recognised as the specialists most qualified for managing skin diseases and performing cutaneous cosmetic and surgical procedures4-6. Therefore, comprehensive and detailed information regarding the current state of dermatologic services is important for better allocating the resources needed in caring for skin diseases7. In Taiwan, the official organisation responsible for the development and supervision of dermatology residency training programs is the Taiwanese Dermatological Association (TDA), which was founded in 1975. Over the past 40 years, the field of dermatology has experienced rapid growth in the production of practitioners. The supply of dermatology services may have long-term impacts on the quality of care in the future. However, information regarding the supply and distribution of dermatology workforce and services remains limited. The aim of this article was to investigate the supply of dermatology services, their geographic distribution and the availability of dermatology services within the National Health Insurance (NHI) program of Taiwan.
Background
Taiwan’s NHI program was established in 1995 to provide health care to all the residents of Taiwan. Currently, 99.9% of Taiwan’s population is covered by the NHI program. It is a government-administered insurance-based national healthcare system. Taiwan has a single payer system for health care. The characteristics of the NHI system include good accessibility, comprehensive population coverage, short waiting times, relatively low costs and an NHI databank for planning, monitoring and evaluating health services8. However, the gatekeeper role of family physicians is weak in Taiwan. Taiwanese citizens are able to choose their healthcare providers without a referral, including dermatologists at any level of medical facility. In Taiwan in 2013, most of the dermatologic services were provided in physician clinics (86.4%), followed by metropolitan hospitals (5.9%), academic medical centres (4.7%) and local community hospitals (3.0%)9. As for the workforce distribution according to facility levels, most dermatologists practised in physician clinics (69.5%, n=818), followed by academic medical centres (18.7%, n=220), metropolitan hospitals (9.8%, n=115) and local community hospitals (2.0%, n=23)10. A similar phenomenon was also documented in the USA. In the USA, most dermatologists worked in a dermatology group or solo practice with less than 30% of dermatologists in multispecialty groups and academic settings in 201411. In Taiwan in 2013, 52.6% of the patients with skin diseases visited dermatologists for help, compared with 32.6% who visited non-dermatologists and 14.8% who visited both12.
Methods
Data collection
Data regarding numbers in the dermatology workforce, including attending dermatologists, fellows, and residents, were obtained from the Taiwan Medical Association (TMA) database and TDA database. The TMA and TDA database included graduates from Taiwanese dermatology residency programs (for the years 1981–2015), as well as geographic information consisting of townships, districts, counties and provincial cities10,13. Dermatologist-to-population ratios were calculated using the TMA data and population data from the Department of Household Registration, Ministry of the Interior10,14.
Data on dermatologic clinics themselves were obtained from the NHI administration, which provides detailed information related to contracted healthcare facilities publicly on its website, and updates that data monthly15. In this study, the related data were analysed, including contracted medical facilities, with full names, addresses, contract types and medical specialties at all healthcare facilities. The opening times of ambulatory services at each contracted healthcare facility were also examined in this study16. More specifically, the opening times were divided into 21 sessions (morning, afternoon and evening) for each of the seven days of the week.
The basic data on all 368 townships in Taiwan were collected from the Monthly Bulletin of Interior Statistics14. Townships are the third-level administrative subdivisions of counties of Taiwan. Initially, from the complete list of contracted medical specialties at all healthcare facilities, 445 office-based clinics that provided dermatologic services were identified. One clinic was subsequently excluded from the analysis due to the termination of its contract for service before January 2017, leaving 444 clinics in the study. Among these 444 clinics, 60 clinics also offered services provided by non-dermatologists, such as plastic surgeons. A programming script was written to retrieve the opening times of the 444 clinics from the NHI website and then to extract the data regarding the open sessions for further analysis.
To investigate their geographic distribution, the clinics were stratified according to the urbanisation level of the townships in which they are located. The level of urbanisation was determined by population density, the population ratio of people with higher educational levels, the population ratio of people aged over 65 years, the population ratio of farmers and the number of physicians per 100 000 people17.
In Liu’s study, townships of remote islands were not included in the analysis of development stratification of Taiwan townships. The 368 townships in Taiwan were classified into seven levels of urbanisation except for the isolated islands of Kingmen and Lienchiang counties. In terms of urbanisation level, the clinics were divided into three groups, with clinics with urbanisation levels of 1 and 2 included in the urban group, those with levels of 3 and 4 included in the suburban group and those with levels 5 to 7, plus those located on the aforementioned isolated islands, included in the rural group. The number of open sessions in a week was analysed for each clinic and associated with its grouping in terms of urbanisation. For after-hours sessions (evening sessions on weekdays, and all sessions on weekends), the proportions of open clinics for each urbanisation group were analysed in order to estimate the availability of dermatologic services. A town was used as a unit of measurement in determining the local availability of at least one clinic opening for after-hours sessions.
Statistical analysis
The data were analysed using the programming software Perl v5.20.2 (http://www.perl.org) for data processing and the statistical software SPSS v22.0 (IBM; http://www.spss.com) for statistical analysis. In this study, descriptive statistics were applied to evaluate the distributions of the dermatology workforce and the opening times of clinics. A χ² test and Fisher’s exact test were performed to compare the open ratios between the three groups with urban areas being the control group. A p-value less than 0.05 (two-tailed) was considered statistically significant.
Ethics approval
According to Taiwan’s personal data privacy legislation and the regulations of the institutional review board (IRB) at Taipei Veterans General Hospital (Taipei, Taiwan), the use of publicly available data is exempted from the need for IRB approval.
Results
Geographic distributions and density of dermatologists
The number of board-certified dermatologists in Taiwan increased from 125 in 1985 to 1002 in 2015. When normalised for population growth, this increase was still substantial (Fig1). There are now 4.27 dermatologists per 100 000 persons. However, this growing workforce is geographically maldistributed (Fig2). Of the 21 administrative divisions containing at least one dermatologist, 11 (52.4%) had fewer than four dermatologists per 100 000 people (Table 1). The three most dermatologist-dense areas in Taiwan were Taipei City, Chiayi City and Taichung City, while Lienchiang County had no dermatologists at all.
Table 1: Geographic density of dermatologists in Taiwan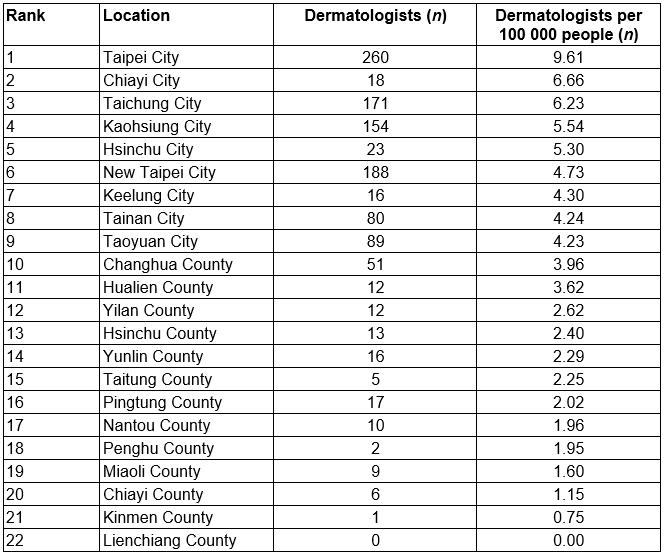
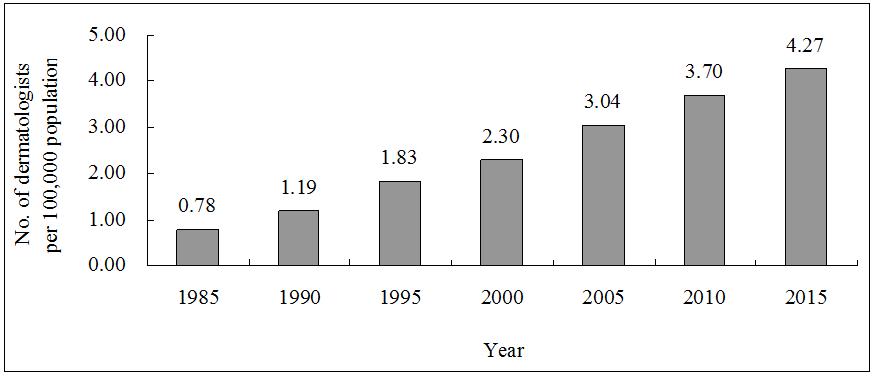 Figure 1: Number of dermatologists per 100 000 people in Taiwan, 1985–2015.
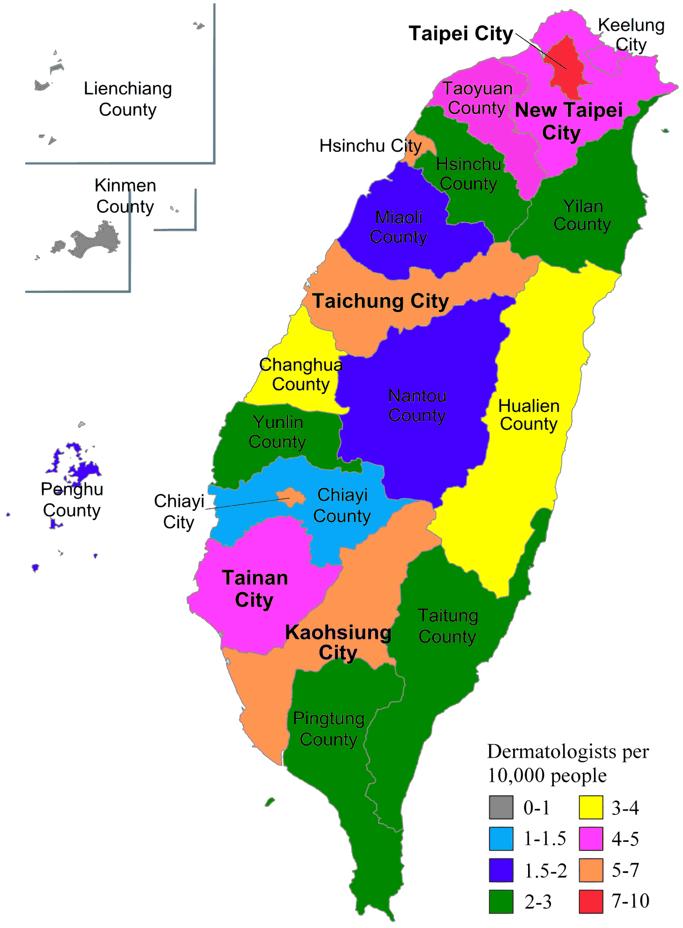 Figure 2: Dermatologist density in Taiwan (dermatologists per 100 000 people).
Geographic distribution of dermatologic clinics
Among the 444 office-based dermatologic clinics in Taiwan, the majority are situated in urban (77.4%, n=344) and suburban (20.9%, n=93) areas. While 91.3% (n=63) of urban towns had at least one dermatology clinic in town, 63.9% (n=92) of suburban towns and 96.1% (n=149) of rural towns had no dermatology clinic. When normalised for population size, the urban–rural disparity was still substantial (Table 2).
Table 2: Distribution of dermatologic clinics in Taiwan, 2015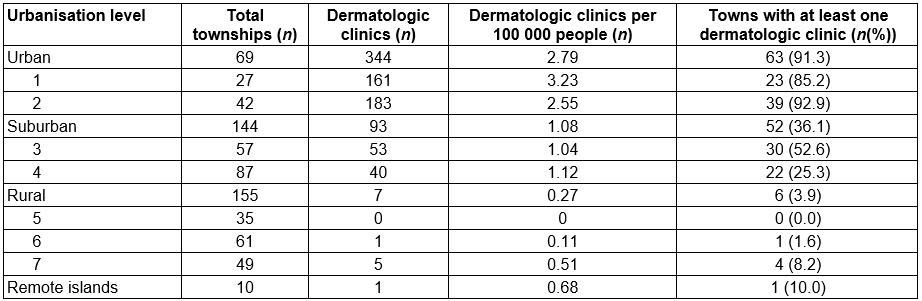
After-hours availability of dermatologic services
During weekday daytimes, at least 98.9% of the dermatologic clinics are open. On weekday evenings, 99.7% of the clinics in urban areas and at least 93.5% in suburban areas provide services, compared with a minimum of just 85.7% in rural areas. Altogether, a maximum of only 57.1% of the rural clinics are open during any of Saturday evening, Sunday daytime and Sunday evening, while the corresponding maximum percentage is 75.9% for urban areas. Most of the clinics in all three urbanisation groups are closed on Sunday, but the percentage of clinics providing services is highest in urban areas. Statistical analysis shows that the open ratios in suburban areas are significantly lower than those in urban areas on Saturday evening, Sunday daytime and Sunday evening (p<0.001), while urban and rural areas have no significant difference in open ratios on these three sections. On average, dermatologic clinics in Taiwan provide 14.9 (standard deviation (SD) 3.04) service sessions per week. In this respect, the urban–rural disparity was minimal, with urban clinics averaging 14.7 (SD 3.07) sessions per week, suburban clinics averaging 15.6 (SD 2.78) sessions per week and rural clinics averaging 14.7 (SD 2.56) sessions per week (Table 3).
Table 3: Temporal availability of dermatologic services, stratified by urbanisation level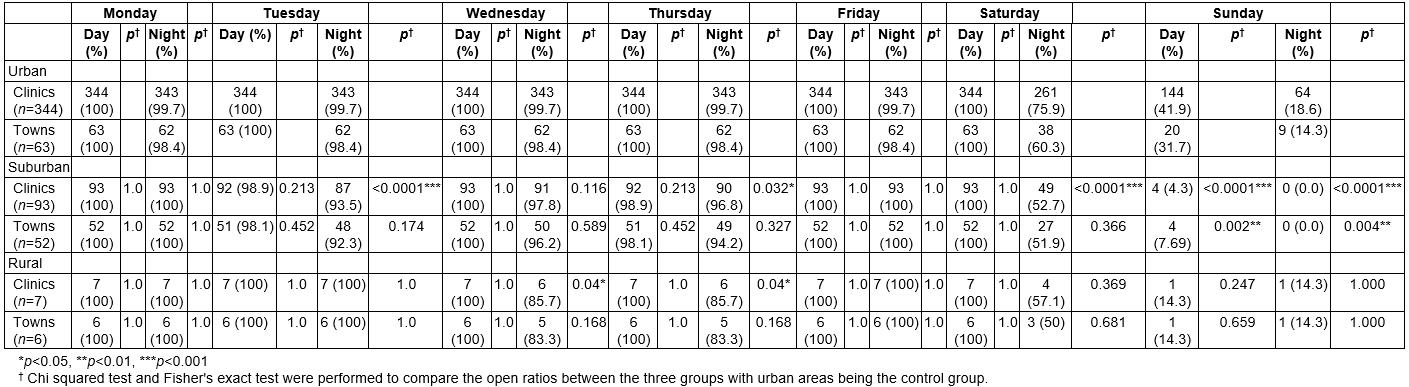
Discussion
Previous studies have shown that patients with dermatologic conditions frequently receive medical care from non-dermatologists18,19. According to one 2001 study in the USA, 36.5% of patients presenting to primary care physicians had at least one skin problem, with that problem being the chief complaint for 58.7% of those patients20. Among patients with skin conditions, dermatologists manage only 40% of outpatient visits21. A 2006 study in Taiwan found that 26.0% of outpatients had at least one skin condition, and that patients with skin diseases accounted for 5.4% of total ambulatory care visits22. Several studies have suggested that dermatologists are superior to non-dermatologists in managing skin diseases and performing cutaneous cosmetic and surgical procedures4-6,23. As such, an insufficient supply of dermatologists can threaten patient access to specialised skin care and potentially affect quality of care.
In the USA, there has been considerable debate as to whether the supply of dermatology workforce meets the nation’s needs. Taiwan’s total population grew by 21.6% between 1985 and 201514. During the same period, a staggering 529% increase was observed in the number of dermatologists per 100 000 people10,13. The Graduate Medical Education National Advisory Committee in the USA used an epidemiological approach to estimate the care required to treat the anticipated burden of skin diseases. That report was published in 1980, and suggested that about 2.8 dermatologists per 100 000 people were needed24. In 2015, Taiwan had 4.27 dermatologists per 100 000 people, compared with just 3.64 in the USA25.
Conclusions
Despite the substantial increase in Taiwan’s dermatology workforce, dermatologists in Taiwan are geographically maldistributed, with many rural citizens having limited access to care. Although previous reports from Taiwan have found that the implementation of the NHI program resulted in more equal geographic distributions of physicians in general, studies in the USA have suggested that specialty has a powerful effect on physician location choice26,27. More specifically, while family physicians are distributed in proportion to the population in both rural and urban locations and are the largest single source of physicians in rural areas, physicians of all other specialties are much more likely to settle in urban areas. That being said, crude comparisons of the dermatologist-to-population ratios in rural and urban areas can be misleading and provide limited information about whether shortages or surpluses of dermatologic services exist in either location. In this study, it was found that two-thirds (67.1%) of the towns in Taiwan had no practising dermatologists. About 10.9% of Taiwan’s population live in rural areas, but only 1.6% of the nation’s dermatologic clinics are located in rural communities. Meanwhile, in those rural areas containing dermatologic clinics, the data indicate that the availability of dermatologic services is relatively limited on weekends. These results raised a concern regarding urban–rural disparities in the delivery of dermatologic services.
A similarly geographic maldistribution of dermatologic services has been observed in the USA28,29. The fact that location is consistently ranked as the highest priority in job selection suggests that this problem is likely to continue. Possible solutions to address dermatologist shortages in rural areas in Taiwan include improving postgraduate education to non-dermatologists and changing the reimbursement strategies of the NHI program to incentivise dermatologists to move to underserved areas30. This study found that urban dermatologists provided more services than rural ones at weekends. Given that there are many fewer dermatology clinics in rural areas than in urban areas, rural residents are relatively lacking in access to dermatologic services compared with urban residents. This implies that urban dermatologists face a more competitive practice environment than rural ones. Similar findings were reported in the USA. Dermatologists in rural communities are most likely to report a need for more dermatologists (48%), whereas urban (39%) and suburban dermatologists (32%) are more likely to report an oversupply of dermatologists11. Previous studies have shown that financial incentives significantly influence physicians’ supply of health care31. The present study’s findings suggest that dermatologists are financially motivated to provide more services in a more competitive environment. However, further studies are necessary to confirm this hypothesis.
There are some limitations to this study. First, the total opening times in a week could not be calculated exactly. The start and end times of each session might vary greatly among clinics. Second, the availability of dermatologic services among group practices involving physicians of several specialties might have been overestimated because the opening time schedules posted on the website of the NHI Administration display only data for whole clinics instead of individual specialties. Third, due to a lack of related data, specialties of all physicians and practice pattern were not examined in this study. Therefore, comparison of the quality of care could not be performed between dermatologists and non-dermatologists. Fourth, this was a cross-sectional study; changes and potential trends across time could not be identified due to the lack of longitudinal data. Finally, services not reimbursed by NHI were not included in this study. Considering the increasing trend of surgical and cosmetic dermatology, the lack of such data in this study limits the degree to which dermatologic practices in general can be assessed accurately.
Acknowledgements
The authors thank the School of Medicine of National Yang-Ming University and Taipei Veterans General Hospital for supporting this research.