


Introduction
Injury remains the leading cause of death for persons aged 1–44 years1 and is the most expensive medical condition to treat, costing approximately $671 billion annually in the USA2. Injury mortality is correlated with access to trauma centers, yet nearly 30 million US residents lack access to level I or II trauma care within 1 hour3. Individuals in rural areas experience greater difficulty accessing trauma care and have higher rates of death due to traumatic injury compared to urban residents3-8.
Rural areas face challenges beyond the locations of trauma centers6; there are fewer prevention resources, higher injury rates9, longer emergency response and transport times, and emergency medical services (EMS) have limited capacity and capability10. In 2012, approximately 1 million EMS calls were to America’s most remote and sparsely populated regions10; such calls frequently require helicopter transport and advanced life support. Given these disparate conditions, improving access to trauma care is a public health imperative and a goal identified by Healthy People 202011.
Physical trauma is a serious injury to the body occurring through penetrating or blunt force12. Specialized centers have been developed to treat serious injury. Trauma centers are categorized into five levels by the American College of Surgeons (although there are local/regional variations in these criteria)13. Generally speaking, level I and II trauma centers provide the highest levels of care, while levels III–V will often stabilize and transfer patients to level I or II centers.
The purpose of this study was to better understand geographic patterns of traumatic injury morbidity and mortality in Colorado, a state with unique geographic and weather barriers in addition to rural–urban variation, using both traditional statistical methods and Geographic Information System (GIS) analyses. This approach allows for experts familiar with injury epidemiology and trauma systems as well as laypersons to understand the burden of injury and the importance of a functional and accessible trauma system. This study informs advocacy, education, and outreach within the state as well as a model for assessing trauma system functioning and identifying needs, including prevention priorities and disparities.
Methods
Injury, fatality and population data were linked at the county level from four sources: (1) the Centers for Disease Control and Prevention (CDC) database, Wide-ranging ONline Data for Epidemiologic Research (WONDER) database; (2) population estimates from the US Census Bureau; (3) injury hospitalization data from the Colorado Department of Public Health and Environment (CDPHE) Trauma Registry; and (4) county urbanization codes from the National Center for Health Statistics (NCHS). Data were linked using Federal Information Processing Standard (FIPS) codes for counties to examine county-level disparities in traumatic injury hospitalizations and deaths. Descriptive statistics, correlations, and t-tests (Statistical Package for the Social Sciences v25; http://www.spss.com) were used to explore differences in injury hospitalization and death by county characteristics. This ecological study used secondary, de-identified data at the county level and did not require human participant protection review.
To measure county rurality, the NCHS Urban-Rural classification scheme for counties was used. These are defined as: (1) large central metro (ie most urban), (2) large fringe metro, (3) medium metro, (4) small metro, (5) micropolitan, and (6) non-core. County age-adjusted injury mortality rates per 100 000 were computed using 5 years of data (2011–2015) from CDC-WONDER14, while injury hospitalization rates per 100 000 were calculated from 5 years of data (2010–2014) provided by CDPHE15. Descriptive statistics were run for the sample; rurality was correlated with both injury hospitalization rates and injury mortality rates. Histograms were visually inspected for both variables against a normal plot of the same mean and standard deviation. Because both variables are close to normally distributed, and because the t-test is robust to deviations from normality, independent samples t-tests were chosen to compare rates between non-core (rural) and all other county types. To confirm, the authors also ran independent samples Mann–Whitney U-tests for each variable, which generated nearly identical results.
GIS analyses were conducted using ArcGIS Desktop v10.5 (Esri; http://www.desktop.arcgis.com) to visually assess injury hospitalization and mortality rates by county and display locations of trauma centers by designation categories. Locations of trauma centers were geocoded to points and imported into an ArcGIS file geodatabase16. Data tables showing age-adjusted mortality and crude injury hospitalization rates by county for Colorado were joined to Colorado county boundaries using the county FIPS code.
Drive times were calculated using network analysis, which provides a more reliable measure of access to trauma care than a Euclidean distance-based buffer approach. Colorado’s mountainous terrain and rural areas support a sparse road network, which makes buffers ineffective in measuring access. Locations of population centers were acquired from the National Atlas database17 Cities and Towns layer to serve as a representation of where people would originate from if being transported to a trauma center.
Drive times from each populated place to the closest trauma center were calculated using the Esri ArcGIS Online Network Analysis Closest Facility Solver. Drive times were calculated along roads using Dijkstra’s algorithm, which solves a shortest-path problem on an undirected, non-negative, weighted graph, and is modified for use in network analysis to include aspects of transportation routing, such as one-way streets, turn restrictions, and barriers, while solving for the lowest cost path between network locations18. The user-defined cost for this analysis was drive time in minutes. The vehicle was assumed to be an ambulance, facilitating faster speeds.
After drive times were calculated, they were visualized in two ways. First, the output drive time values for every populated place within a county were averaged, creating an average drive time to the nearest level I or II trauma center per county. Second, drive time values were displayed as straight lines from each populated place to the nearest trauma center. The process of running the closest facility solver was conducted twice.
A second method was employed to visualize access to trauma care in Colorado. Polygons representing the areas within a 30-, 60-, and 120-minute drive time of trauma centers were generated using the Esri ArcGIS Online Network Analysis Service Area Solver. The drive-time polygons were created to represent access to any level I or II trauma center. The same network analysis settings were used in the service area analysis as in the closest facility analysis described above, and driving time was calculated in the direction of ‘from’ the populated place ‘to’ the trauma center.
Results
Over half (56%) of Colorado’s 64 counties are considered ‘non-core’ (rural). These rural counties have an average 2014 population of 8390 (range 690–29 951). The mean age-adjusted injury mortality rate for all counties with available data is 82.5 per 100 000 (n=53). The mean injury hospitalization rate for all counties is 633.3 per 100 000 (n=64). All-cause injury hospitalization rates (r(62)=0.291, p=0.020, n=64) and injury fatalities (r(51)=0.448, p=0.001, n=53) were significantly and positively correlated with increasing levels of rurality. In independent samples t-tests, the rural counties, when compared to all other designations, had significantly higher injury hospitalization rates per 100 000 (mean (M)=685.4 (standard deviation (SD)=186.5) v M=566.3 (SD=121.8); t(62)= –2.96, p=0.005) and fatality rates per 100 000 (M=93.8 (SD=21.8) v M=71.6 (SD=12.8 ); t(51)= –4.54, p<0.001), indicating residents of rural Colorado with the least access to trauma care are the most impacted by the burden of traumatic injury.
Mapped results
Colorado has 72 designated trauma centers. Level I and II centers are clustered in a central corridor on the east side of the Rocky Mountains. County-level maps demonstrate percentage of population in rural areas, locations of trauma centers, gradated rates of injury and death by county, and time to travel to level I and II trauma centers. The maps reveal the counties with the highest rates of injury hospitalizations and fatalities are often the same counties that have a drive time of 1 hour or more from a level I or II trauma center.
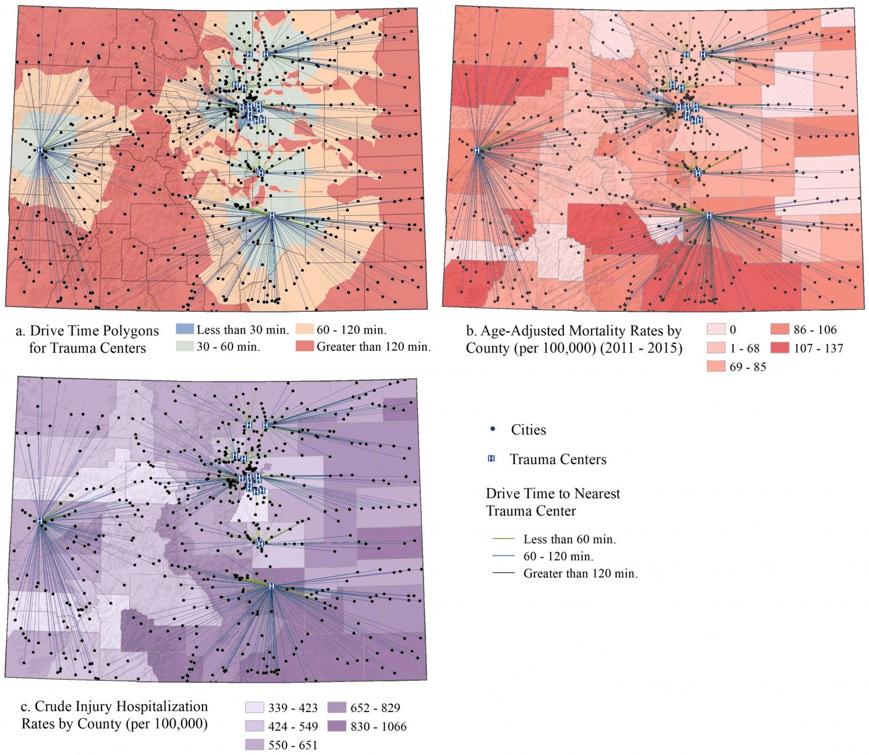 Figure 1: Drive time from populated places to the nearest level I or II trauma center, showing drive times (a) by 30-minute intervals, (b) layered over injury hospitalization rates by county, and (c) layered over injury mortality rates by county.
Discussion
GIS methods have been successfully applied in public health to understand relationships between access to resources and health, the spread of disease, and effectiveness of treatment and prevention programs19,20. GIS has also been used to identify geographic and social factors associated with intentional injury21, cycling injuries as a function of traffic stress22, and disparities in access to surgical care23. GIS methods have also recently been applied to trauma system analysis. Studies of the Pennsylvania trauma system found that despite having an organized trauma system, a full 30% of severely injured patients were treated at non-trauma centers24,25. Their GIS models demonstrated access could be improved with better trauma center location. A similar study using Colorado as a model found fewer trauma centers in the state could still ensure adequate access to trauma care26. Neither study could link outcomes to improved access, although previous literature supports that patients treated at trauma centers have a 25% lower risk of mortality than those treated at non-designated facilities27. Further research on how to best utilize available data and GIS capabilities for trauma system analysis is warranted.
The current study is limited in its ability to account for all factors in the complexity of a trauma system, and there are a number of compelling areas for future GIS analyses of trauma systems. For instance, in some rural and remote areas, helicopters and fixed wing planes may be used for emergency response and transport, and the current study only accounts for road travel. However, in Colorado specifically, those flight resources are often unusable due to extreme weather patterns. In future studies, including helicopter and plane transport would be a benefit to understanding the full picture of trauma injury transport options. Future studies may also expand on findings by including information about injury severity, because minor traumatic injuries may not require treatment in level I or II centers and can be well addressed in other settings. Similarly, patients who are coming from long distances away from the hospital may be more likely to be admitted for observation, potentially inflating rates of rural hospital admissions. Additionally, future studies applying GIS to trauma system operations may want to incorporate response times and time spent on scene. These data were not accessible for the current state-level study, but studies of more local systems may be able to incorporate all of these data points.
Beyond trauma systems specifically, GIS offers a number of applications for public health and health-related research. A review of 621 studies of GIS-involved health studies grouped studies into five predominant categories of utility: disease surveillance, risk analysis, health access and planning, community profiling, and general/methodological28. GIS is versatile and valuable beyond research domains, and also lends itself well to inclusion in public health planning, implementation and evaluation cycles29. The results of the current study support the use of GIS-informed decision making for trauma systems and other public health applications.
Conclusions
In some regions, optimally placed trauma centers will improve access and outcomes, while others face barriers to access that exceed system optimization, including topography, weather, population dynamics, and healthcare provider shortages. GIS is useful for identifying communities at the intersections of injury burden and barriers to access. These communities would benefit from a public health approach, beginning with identification of prevention opportunities, development of the prevention workforce, and investment in evidence-based prevention strategies, with follow-up monitoring and evaluation. GIS can also be used to identify areas most in need of training, such as the Rural Trauma Team Development course, and areas in need of innovative solutions such as tele-education, telehealth, robotics, and supporting the first responder workforce. Public health and trauma system advocates may be able to leverage GIS for advocacy, as visual displays of access limitations and injury burden may reduce communication barriers between clinical and non-clinical audiences, and therefore be especially impactful for legislators.