


Introduction
Health inequities are systematic, avoidable and unfair differences in health caused by differential access and exposure to the social determinants of health such as poverty, housing and the health system itself1. Achieving health equity depends on eliminating disadvantage beyond individual control2,3. As health systems can cause and perpetuate inequities4, ensuring the equity of health care such as primary care services is a critical step to achieving health equity5. Spatial equity is in turn a key component of equitable service delivery6,7. Researchers can investigate the equitable distribution of health care using geographical measures of access to services7-10, which are the foundation of spatial equity investigations11. Accessibility studies in Aotearoa New Zealand have examined population-to-provider ratios and the distance between populations and services12-14. However, population-to-provider ratios are susceptible to the modifiable area unit problem and overlook patient ‘border crossings’, while distance-based measures disregard the supply and demand of services8. Further, both techniques assess potential accessibility, rather than measuring realised access to health care. While research suggests that greater distance to health care results in reduced utilisation and increased health inequities12, there is no clear evidence that patients use services closest to where they live. In fact, patient surveys and enrolment records suggest that most patients bypass their closest service15-18. Therefore, researchers should be aware that that potential accessibility measures may not reflect realised access and could misrepresent the equitability of service distributions.
This study used an extensive dataset of more than 130 000 patients to examine primary healthcare enrolment in the Waikato region of Aotearoa New Zealand. The rate of general practitioner (GP) bypass in the Waikato region is calculated, and the factors affecting the likelihood of a patient bypassing their closest clinic are investigated. This analysis makes an important contribution to understandings of the relationship between geography and access to health services, which can inform an improved understanding of spatial equity and the development of health services that support health equity.
Setting
Government health funding in New Zealand is distributed to district health boards (DHBs) according to the population size and demographic characteristics of each region. DHBs then allocate funding to primary health organisations (PHOs), which provide primary health care to their enrolled population. Most of these services are delivered through general practices. The majority of New Zealanders are enrolled with a PHO through their enrolment in a selected GP service. This enrolment results in reduced costs for doctor visits, prescription medicines and other benefits. Co-payment charges to patients, particularly for those aged over 14 years, are common. This study focuses on the enrolment data from Hauraki PHO in the Waikato region, in the North Island of New Zealand. About 400 000 people live in the Waikato region with about 140 000 residing in the main urban centre (Hamilton), with the remainder in small towns or rural areas19. Public transport services are minimal, and are only used by 1% of Waikato commuters19. A greater proportion of the Waikato population identify as Indigenous (Māori; 22%) compared to the national average of 15%19. The New Zealand Health Survey has found that, compared to the national average, adults living in the Waikato region have higher levels of obesity, ischaemic heart disease, diabetes, high cholesterol and blood pressure, as well as higher levels of unmet need for primary care20. As with elsewhere in Aotearoa New Zealand, inequities in these indicators of poor health outcomes are experienced in the Waikato region, particularly for Māori20.
Methods
Data
The anonymised patient enrolment records (n=137 596) of Hauraki PHO’s 36 GP clinics, 11 of which are Māori service provider clinics (MSPC), and information about GP and nurse full time equivalent (FTE) hours at each clinic was provided in December 2017. Enrolment records included each patient’s age, residential address with associated GPS coordinates, a geocoding uncertainty score, ethnicity (according to six major ethnic group categories: European, Māori, Asian, Pacific, Middle Eastern/Latin American/African (MELAA) or ‘other’), socioeconomic status according to area-level New Zealand Deprivation Index 2013 (NZDep2013) quintile21, date of last consultation and the name of the clinic that they were enrolled with. For the purposes of these analyses, the MELAA ethnic group (n=2237) was combined with ‘other’ (n=980). The New Zealand road network geographic information systems (GIS) layer was obtained from the Land Information New Zealand data service. Statistical Area 2 (SA2) geographical boundaries and the 2018 urban/rural form classification (UR2018) were downloaded from the Statistics New Zealand geographic data service. The UR2018 classifies areas as ‘major urban’, ‘medium urban’, ‘small urban’, ‘rural settlement’ or ‘rural other’. The ‘rural settlement’ and ‘rural other’ categories of the UR2018 were combined into a single ‘rural’ category for the purposes of this analysis. The location of all GP clinics within the Waikato DHB region, including clinics associated with other PHOs, were geocoded based on information from the Waikato DHB website. During data cleaning any records with a geocoding uncertainty score greater than 5, indicating that the chance of incorrect geocoding was 50% or higher, were removed from the sample. Any patients residing outside the North Island mainland were also removed from the sample. A small proportion of patients (1891, 1.4%) had residential addresses outside the Waikato DHB region, and these were also removed. The total sample for this analysis included 133 870 enrolled patients. Information regarding the cost of services, after-hours care and Māori service provider status was located on the Hauraki PHO website and incorporated into the dataset.
Analytical methods
The ArcGIS (ESRI; https://www.arcgis.com) ‘closest facility’ function was used to (i) calculate the road network distance from each patients’ residential address to their closest GP clinic and (ii) calculate the distance from each patient’s residential address to their enrolled GP clinic. Patients were classified as either enrolling with or bypassing their closest GP. All GP clinics in the Waikato DHB region were included in (i) to account for patients bypassing other PHOs’ clinics. Some patients were enrolled with clinics that operated satellite services and the exact clinic patients used was unknown (n=42 706), so it was assumed that patients used the satellite service closest to their home. A binomial logistic regression was performed with the Statistical Package for the Social Sciences v25 (IBM; http://www.spss.com) using ‘bypassed closest clinic’ (yes or no) as the dependent variable. Predictor variables included patient residential area (major urban, medium urban, small urban or rural), ethnicity (European, Māori, Pacific, Asian, other), age (in bands of 0–4, 5–14, 15–24, 25–44, 45–64 and ≥65 years) , area-level deprivation (NZDep2013 quintile), sex (male or female), distance to closest GP, clinic after-hours availability, MSPC status, clinic total FTE hours and clinic fees. Interaction effects were calculated for ethnicity and age, ethnicity and deprivation, and residential area and deprivation.
Ethics approval
This research was approved by the Human Research Ethics Committee, University of Waikato; granted 18 May 2017 (Whitehead FS2017-18).
Results
Bypass of closest GP service
Overall, 68.1% of enrolled Hauraki PHO patients in the Waikato DHB region bypassed the GP service closest to their residential address. Table 1 displays bypass rates for key variables.
Table 1: Rates of GP bypass according to key variables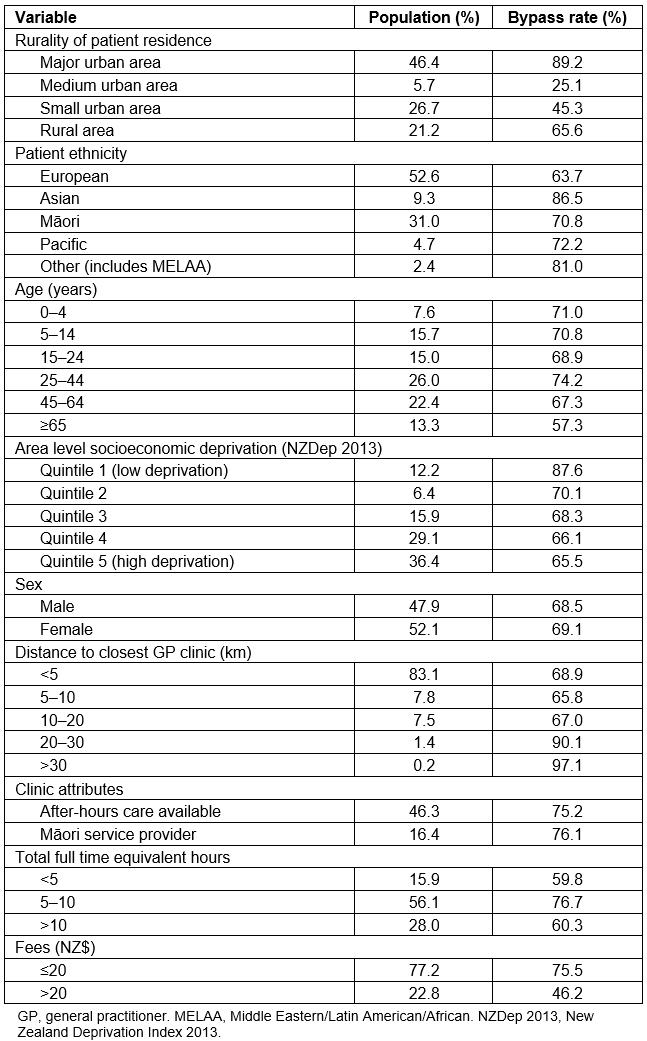
Logistic regression analysis
The logistic regression model (Table 2) returned a statistically significant Hosmer & Lemeshow test (χ2(8)=1586.480, p<0.001), explained 39% (Nagelkerke R2) of the variation in the dependent variable and correctly classified 79% of the cases.
Table 2: Results of binomial logistic regression with GP bypass as the dependent variable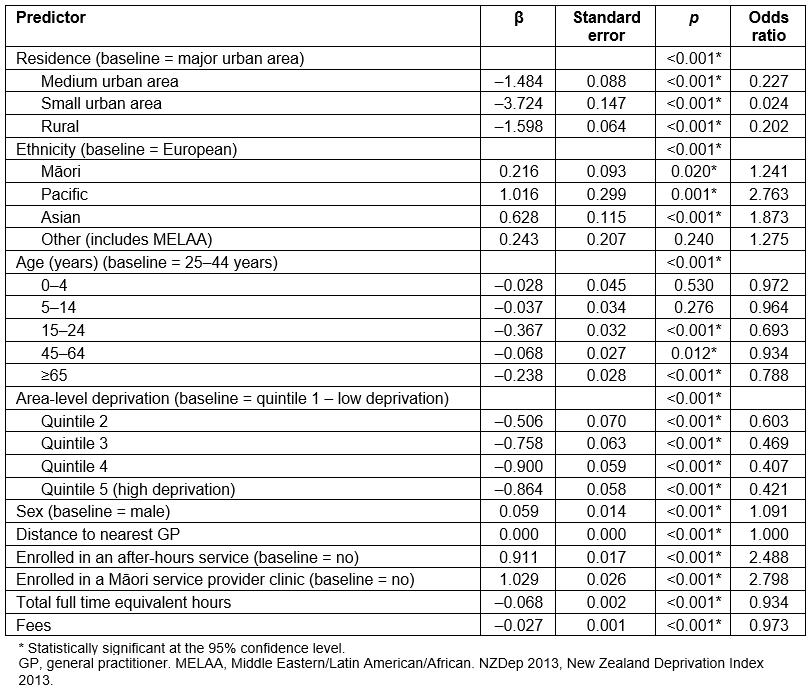
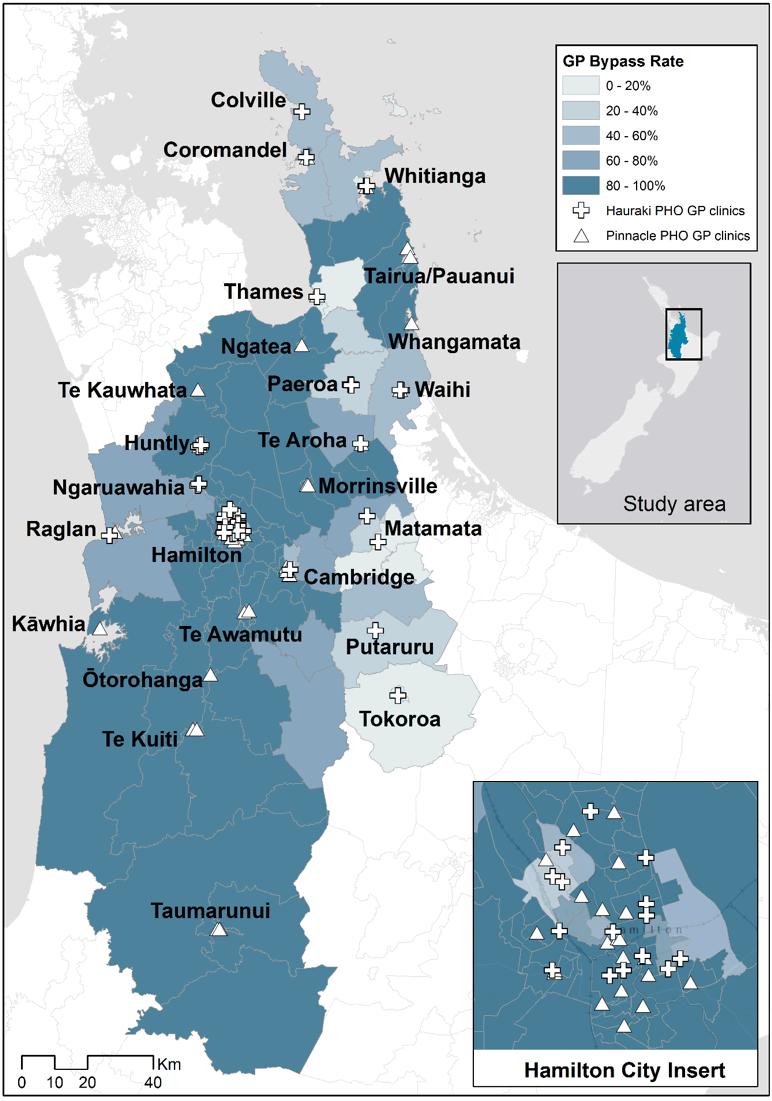 Figure 1: Proportion of Hauraki primary health organisation patients in each Statistical Area 2 bypassing their closest GP clinic.
Residential rurality
Compared to major urban areas, patients living in medium urban, small urban and rural areas were less likely to bypass their closest GP service. This may reflect the availability of services in urban and rural locations. Hamilton has more GP services located within a relatively small area and therefore residents are able to travel shorter additional distances to use a particular clinic. While rural residents live further from their closest clinic, they may be willing to travel further to a certain service, as they must already travel significant distances to any service. Table 3 displays the average distances to patients’ closest GP and enrolled GP for each UR2018 category of residence, the average additional travel for those patients who did bypass their closest GP, the total number of clinics in each UR2018 category and the average number of clinics per spatial unit in each UR2018 category.
Overall, patients who bypassed their closest GP tended to travel relatively short additional distances. The median additional travel among ‘bypassers’ was 2.2 km, while 79% of patients bypassing their closest GP travelled less than 5 km to their enrolled clinic. However, there do appear to be significant differences between the additional distances travelled by patients in major urban areas compared to those in other smaller settlements. For instance, major urban residents lived closest to their enrolled clinic and those who bypassed travelled the shortest average additional distance of 3 km. While rural patients had the furthest to travel to access their closest clinic (9.9 km) and also travelled the furthest additional distance to attend their enrolled clinic (14.9 km), the additional travel among those who bypassed (7.5 km) may not be viewed as a barrier compared to the benefits of enrolling with a preferred service. Interestingly, patients in medium urban areas had the highest additional travel distance (14.5 km), despite living within relatively short distances of their closest GP (1.6 km). This may reflect commuter patterns in the Waikato (and particularly for the areas surrounding Hamilton), as people could be choosing to enrol with GP services close to their work or study locations rather than their home addresses. In most towns more than 90% of patients enrolled with services inside their town, except for five towns where more than 20% of patients were enrolled with external clinics. Patients living in Cambridge, Coromandel, Ngāruawāhia, Putāruru and Raglan were more likely to ‘cross borders’ and enrol with services outside their town of residence. More than 98% of Hamilton residents were enrolled with GPs in the city.
Table 3: Number of clinics and average distances travelled by rural and urban patients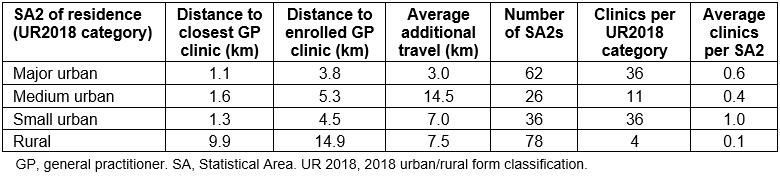
Ethnicity
The rate of GP bypass varies by patient ethnicity. Compared to European patients, Māori, Asian and Pacific patients were statistically significantly more likely to bypass their closest GP service. More than 80% of Asian patients enrolled in GP clinics more distant from their residential address, and more than 70% of Māori and Pacific patients also bypassed their closest services, while European patients had the lowest GP bypass rate (64%). These ethnic patterns could be for a variety of reasons, which may change for different groups. For instance, patients may prefer GPs of a certain ethnicity and/or with particular language skills. Thirty-seven percent of all Māori patients were enrolled with an MSPC, and 77% of Māori who were enrolled in a MSPC bypassed a closer service to attend that MSPC. It appears that the urban–rural distribution of ethnic groups may be moderating these ethnic variations in bypass rates. Eighty percent of Asian patients lived in major urban areas, compared to 67% of Pacific patients, 50% of Māori patients and only 35% of European patients. In contrast, a larger proportion (30%) of European and Māori patients lived in small urban or rural areas compared to other ethnicities. Table 4 displays the distribution of each ethnic group among urban and rural areas, while Figure 2 shows the variation in GP bypass rates among Māori patients, and the distribution of MSPCs in the Waikato DHB region.
Table 4: Ethnicity and urban/rural residence of patients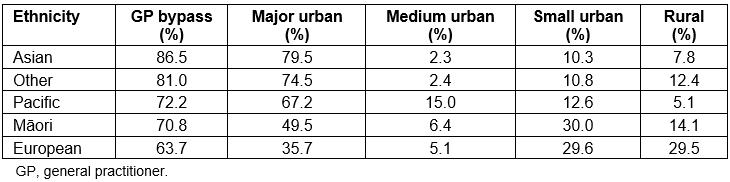
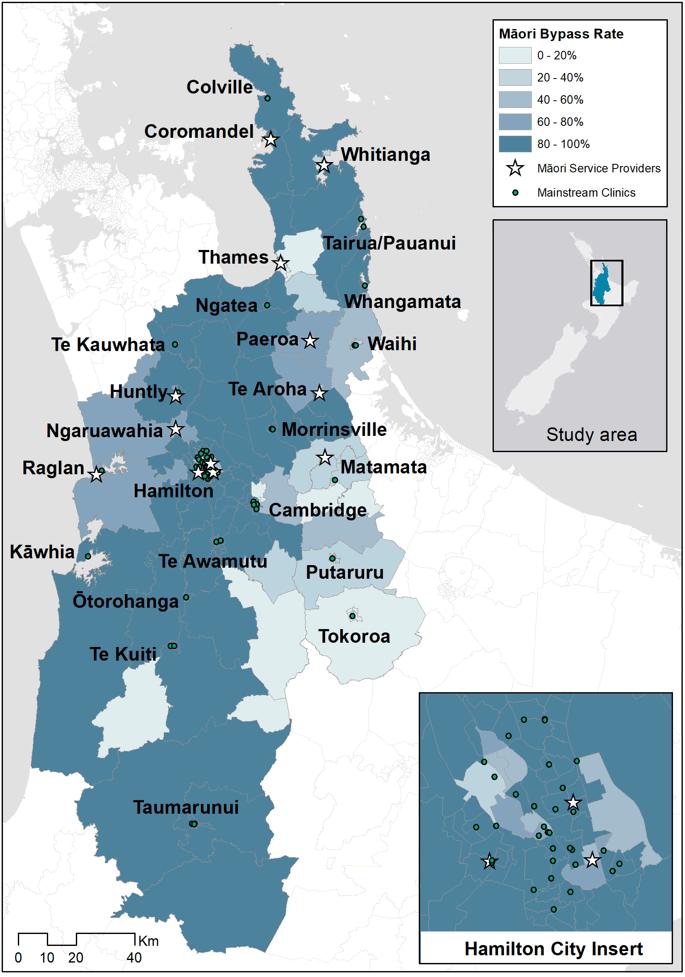 Figure 2: Proportion of Māori Hauraki primary health organisation patients in each Statistical Area 2 bypassing their closest GP.
Age
The highest rates of GP bypass were among those aged 25–44 years (74%). Compared to this age group, people aged 15–24 years, and those aged more than 45 years, were less likely to bypass their closest GP, while no significant difference was found between those aged 24–44 year, and the 0–4 years and 5–14 years age groups. The high rate of GP bypass among people aged 22–45 years may reflect the lower rates of GP utilisation among this group (who, on average, last had a consultation 12 months previously) as well as their increased access to personal transportation. Patients in this age group may also be more likely to choose a practice that is closer to their work address than their home. Patients aged less than 14 years also had high rates of GP bypass and no statistically significant difference to the 25–44 years age group was identified by the regression analysis. On the other hand, the lowest rates of GP bypass were among the ≥65 years age group (57%) who also had the shortest time since their last consultation (an average of 6.8 months). Older patients were more likely to enrol in services closer to home, which may reflect the increased importance of convenience, lower transport accessibility and higher GP utilisation rates among this age group. A statistically significant interaction term between age and ethnicity was identified. Asian and Māori patients aged 15–24 years, Asian and other patients aged 45–64 years and Māori patients aged 65 years or more were more likely to bypass their closest GP service.
Socioeconomic deprivation
Compared to the less socioeconomically deprived neighbourhoods, patients living in more deprived areas were less likely to bypass the GP service closest to their home. Overall, 88% of patients living in the least socioeconomically deprived neighbourhoods bypassed the GP closest to their residence compared to 66% of patients living in the most deprived areas. Statistically significant interaction terms were identified between socioeconomic deprivation and ethnicity, and socioeconomic deprivation and residential rurality (Appendix I). Table 5 displays the breakdown of differences in rates of GP bypass between areas of high and low deprivation across patient ethnicity and rurality of residence. Each ethnic group displayed a deprivation gradient, with patients living in affluent areas the most likely to bypass their closest GP services. Pacific patients had the greatest difference in bypass rates between residents of high- and low-deprivation areas, and were 1.5 times more likely to bypass their closest GP when living in areas of low deprivation. The effect of deprivation also appears to vary across rural and urban areas, with a relatively small difference in bypass rates among major urban residents living in areas of low compared to high socioeconomic deprivation. Rural patients were 2.6 times more likely to bypass their closest GP if they lived in areas of low deprivation, while medium urban residents in areas of high deprivation showed very low rates of bypass and an odds ratio of 12.9. Patients residing in small urban areas showed an inverse pattern, with those living in areas of high deprivation more likely to bypass GP clinics. This could be because patients living in small towns with more than one clinic may choose a cheaper service even if it is slightly further away. Of the residents of deprived small urban areas who bypassed their closest GP, 78% travelled less than 3 km to their clinic and 96% paid less than NZ$20 for an appointment.
Table 5: Differences in bypass rates between areas of high and low deprivation by ethnicity and residence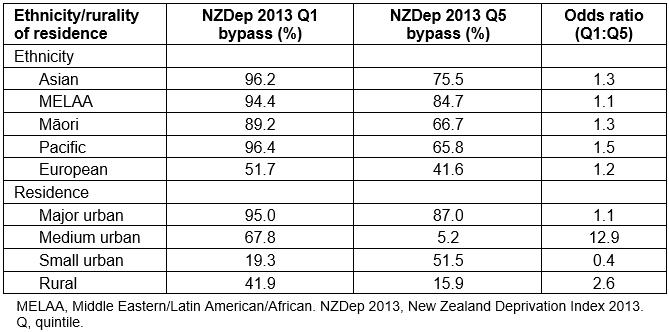
Sex
Rates of GP bypass for male and female patients were relatively similar, at 68.5% and 69.1% respectively, while the regression analysis returned an odds ratio of 1.091, suggesting little difference in enrolment patterns between male and female patients.
Distance to closest GP service
A breakdown of the differences in rates of GP bypass according to the distance between patients’ residential addresses and their closest GP clinic (Figure 3) reveals little difference in rates of bypass among patients living up to 20 km from their nearest service. Rates of bypass were generally between 60% and 70%. However, for patients living 20–30 km from their closest clinic, GP bypass rates rise above 90% and for those who live more than 30 km from a clinic the rate of bypass is generally 100%. Overall, in the Waikato region, only 2% of patients lived further than 20 km from a GP clinic. Of these patients, more than half travelled less than 10 additional kilometres to their enrolled GP clinic, and two-thirds used services located in rural areas or small towns.
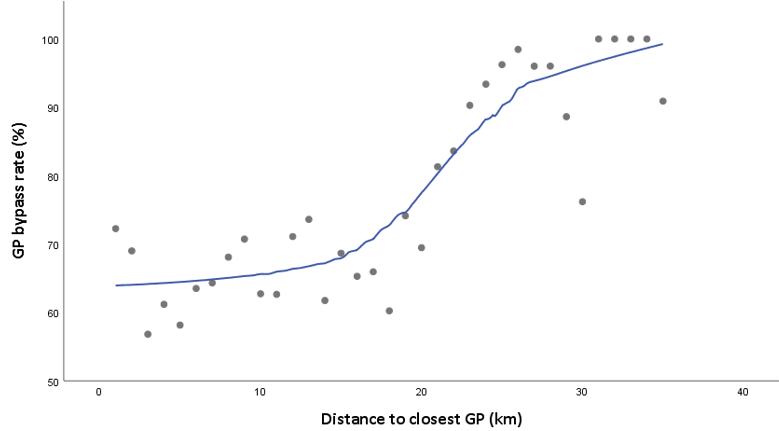 Figure 3: Scatterplot of GP bypass rate versus distance to closest GP clinic.
Clinic attributes
The main clinic attributes associated with increased rates of GP bypass were whether or not the clinic had after-hours care, and whether or not the clinic was an MSPC. Total GP and nurse FTE hours and clinic fees were statistically significant predictors of lower bypass rates. Overall, 21 953 patients were enrolled in MSPCs (70% of whom were Māori) and 62 031 in after-hours clinics. Of those enrolled with MSPCs, 76% had bypassed a GP clinic closer to their home, while the same was true for 75% of patients enrolled in services providing after-hours care. Patients enrolled with MSPCs and clinics with after-hours care on average travelled an additional 3.4 km and 3.3 km respectively past their closest clinics. Clinic fees also appears to influence patients’ enrolment choices. Three-quarters of patients enrolled in clinics that charged less than $20 for an appointment had bypassed closer services, while the same was true for less than half of those patients enrolled in clinics charging more than $20 for an appointment. Although the FTE hours of clinics was a statistically significant predictor variable in the logistic regression the nature of the relationship between GP bypass is unclear. Clinics with less than five FTE hours and those with more than 10 FTE hours had the lowest rates of bypass (60%), while patients enrolled at clinics with between 5 and 10 FTE hours were more likely to bypass closer GPs (77%). One key finding is that across the Hauraki PHO network there were on average 1314.9 patients per GP FTE and 1520.3 patients per nurse FTE, significantly lower than the New Zealand average clinician workload of 1529.9 patients per GP FTE and 2022.7 patients per nurse FTE22.
Discussion
The analysis of more than 130 000 patient enrolment records indicates that almost 70% of Hauraki PHO patients in the Waikato region are not enrolled with a GP clinic closest to their residential address, and that rates of GP bypass vary according to several key factors. This has important implications for methodological approaches to measuring spatial accessibility. Despite several key limitations, to date the majority of healthcare accessibility research in Aotearoa New Zealand has taken a ‘closest facility’ approach. The general lack of data on ‘real’ patient behaviour and the relationship between access and geography has been cited as one reason for the assumption that patients use the facility closest to where they live15. However, the results of this study, based on detailed data, suggest that such measures are unlikely to accurately reflect how people actually access and use health care. This adds to the somewhat contradictory evidence from previous research where surveys have identified varying rates of GP bypass in different settings. For instance, more than 80% of participants from Gisborne, New Zealand bypassed their closest GP17, 32% of respondents in a US study bypassed their closest primary healthcare provider23, while only 28% of middle-aged or older adults surveyed in rural Montana bypassed their local primary healthcare providers24. It also supports the previous analysis of patient enrolment data in the UK, which revealed that the majority of patients did not register with their closest GP18, and US data suggesting that 65% of women bypass their closest mammography clinic15. These findings suggest that not only are closest facility approaches limited by their disregard for levels of service supply and demand8, but also that assumptions that patients will use their closest service appear to be incorrect. The use of closest facility measures could therefore create a misleading representation of access that does not necessarily reflect the realities of how patients interact with services, and this may impact understandings of spatial equity.
The regression analysis appears to confirm that non-spatial factors are key components of accessibility. Higher rates of bypass for patients enrolled in clinics offering lower fees, after-hours care and Māori-focused services suggest that Penchansky and Thomas25 were correct in considering the affordability, accommodation and acceptability of services as key non-spatial dimensions of access alongside service availability and accessibility. Furthermore, it is important to consider not only service attributes, but the abilities of individuals and populations to access and interact with health services26. Therefore, a key flaw of most accessibility measures is that they tend to be ‘place-based’ rather than ‘people-based’27, and don’t consider the interaction of spatial, temporal and social components of access. Harris et al28 also argue that to improve access equity it is essential to consider whether primary care services (i) provide high-quality care for socially disadvantaged groups, (ii) provide access that is appropriate to needs, and (ii) promote prevention and early intervention and address the underlying social determinants of health. Researchers should therefore carefully consider the importance of both spatial and non-spatial domains on access equity, and incorporate these components into more holistic measures of access. For instance, while availability and spatial accessibility are privileged in the two-step floating catchment area (2SFCA) method29 and its various derivatives30, it has also been used to incorporate non-spatial aspects of accessibility such as population health31, and the 2SFCA is considered a valid measure of accessibility that is associated with health outcomes32. However, in order to more effectively evaluate the equity of access, researchers must develop an accessibility measure that more appropriately captures all domains of access. This could involve synthesising the Levesque or Penchansky and Thomas models of access with the 2SFCA using weightings to account for the affordability (eg clinic fees), accommodation (eg after-hours or drop-in availability), acceptability (eg availability of Māori or Pacific services, female or bilingual staff), as well as considering the differing abilities of populations to access care.
The results suggest that enrolment patterns are associated with residential rurality. However, most patients are enrolled with services in the town or city they live in, suggesting that when GP bypass does occur, patients are enrolling with other local services. Rates of GP bypass may therefore be related to the differing availability of services in rural and urban locations. For instance, in Hamilton, which has 36 GP clinics, 98.2% of residents enrolled in local clinics, while 89.2% bypassed their closest service. Conversely, small and medium urban areas have fewer enrolment options (on average 1.0 and 0.4 GP clinics per SA2, respectively) and much lower GP bypass rates. Commuter travel may also influence enrolment patterns. More than 20% of patients residing in Cambridge, Raglan and Ngāruawāhia were enrolled in services outside their town, and in each case more than 80% of these patients had enrolled in Hamilton GP clinics. These three towns are all located close to Hamilton and therefore patients may be enrolling in clinics closer to their work or study locations rather than their home address. The relatively high rate of GP bypass for rural areas may also be related to service availability and commuter patterns. Only four GP clinics in the Waikato region were inside SA2s classified as rural, meaning an average of 0.1 clinics for each rural SA2 in the region. Therefore, most rural patients must travel further to access primary health care and may be inclined to enrol with services near their work or place of study.
Spatial equity is concerned with the equitable distribution of services not only geographically, but also among socioeconomic and ethnic population groups33. This can be thought of as investigating ‘… whether socially disadvantaged populations live in spatially disadvantaged areas’34. Since spatial equity and realised access are particularly under-researched in Aotearoa New Zealand, where the greatest and most persistent health inequities experienced are among Māori, people of other Pacific origin and people living in areas of high socioeconomic deprivation35,36, this study also sought to examine the sociodemographic factors associated with varying rates of GP bypass.
The results highlight that residents of major urban areas, those living in areas of low socioeconomic deprivation, patients identifying as Asian and patients living more than 20 km from any GP clinic were the most likely to bypass their closest GP. Patients enrolled in clinics that offered after-hours care, were MSPCs or offered lower fees were also more likely to bypass closer GP services. Māori and Pacific patients had higher-than-average rates of GP bypass, and a large proportion of patients enrolled with MSPCs also bypassed their closest GP. This supports evidence of the importance of Māori-governed GP clinics with underlying philosophies of health and wellbeing for Māori patients37. This complements Australian research demonstrating that Indigenous Australian patients bypassed several mainstream services in order to access primary care delivered by Indigenous organisations, and 20% of Indigenous Australian patients using these services travel more than 30 minutes38. A 2004 survey of Māori health providers suggested that, compared to mainstream GP services, MSPCs were more likely to have a higher proportion of Māori patients enrolled, provide a wider range of services such as maternity care and group health promotion and serve populations disproportionately drawn from the most deprived areas39. Although MSPCs tended to have fewer GPs working for them, the contribution of nurses meant that on average the overall FTE hours were higher than for mainstream services. In Aotearoa New Zealand average GP and nurse FTE hours per clinic of 3.5 and 3.3 respectively and the average clinician workload of 1529.9 patients per GP FTE and 2022.7 patients per nurse FTE has been suggested22. The MSPCs in the sample for the present study had similar GP FTE hours (3.1) but higher nurse FTE hours (4.7). The ratios of patients to health professionals were much lower in MSPCs with averages of 1191.1 patients per GP FTE and 777.9 patients per nurse FTE, suggesting that MSPCs are well staffed relative to the number of patients enrolled. Furthermore, the ratio of overall FTEs to enrolled patients was lowest for MSPCs, and no clinics charged more than $17.50 for an appointment. This information may provide some insight as to why MSPCs appear to be valued by patients. Not only are services delivered from a Māori perspective, but fees tend to be lower, while GPs and nurses are caring for relatively fewer patients.
The present study results suggest that area-level deprivation may influence enrolment patterns as there is an overall deprivation gradient in bypass rates for all patients, with 88% of people living in the wealthiest areas bypassing their closest GP compared to 66% in the most deprived areas. The distance between a patient’s residential address and their GP clinic could be a greater consideration for those patients who live in areas of higher socio-economic deprivation, or, conversely, those who live in areas of low deprivation may be more able to travel to a preferred clinic further away from their home address. It also appears that the bypass rates of ethnic groups are affected differently by area-level deprivation, while there are large differences between the deprivation gradients of urban and rural areas. European patients living in areas of high deprivation were the least likely to bypass their closest GP, as were patients living in deprived rural and ‘medium urban’ areas. Further analysis is required to understand these patterns; however, the availability of transportation and additional costs involved in travelling to more distant clinics may act as a barrier for patients living in areas of high deprivation. NZDep2013 is calculated based on several census variables, including a measure of access to a private vehicle21. Patients living in areas of low deprivation are less likely to experience economic or transport-related barriers that could prevent them from enrolling in a preferred clinic of their choice, which may not necessarily be closest to their home.
Limitations
One limitation of this study is that patient enrolment data were only available from one of the PHOs operating in the Waikato DHB region, meaning that this study only exemplifies a sample of patients within the region, rather than the entire enrolled patient population. However, all GP clinics in the DHB region were included in the analysis. The dataset did not include ‘non-enrolled’ patients, who may still access GP services albeit at a higher cost, and who may well have very different spatial equity and need. The number of consultations patients had each year was not available either, and therefore it was assumed that enrolment in a GP service is equated to accessing that service. It was assumed that patients’ residential addresses were correct and current despite Aotearoa New Zealand’s high rates of residential mobility40.
It is important to consider the potential impact of residential mobility on the results of this analysis, as people may wish to keep their regular GP despite changing addresses. Younger people and Māori tend to have higher rates of residential mobility41, which may explain some of the higher rates of GP bypass among these groups. Furthermore, 17 practices in the Hauraki PHO network are practices with low fees (very low cost access), which may mean that the impact of cost on enrolment decisions and bypass rates has been underestimated. This study does not consider other components to GP clinic location preference, such as daily travel patterns of patients to locations such as work, study or school, and how this may impact on enrolment. This information was not available from Hauraki PHO; however, there is potential for further research using integrated datasets such as the Statistics New Zealand Integrated Data Infrastructure. Finally, the definition of rurality for the purposes of health research is currently unclear and contested42. This study has used the latest UR2018 classification from Statistics New Zealand, which is the only classification for SA2s currently available and is based on urban/rural form rather than function. The results of this study may have differed if previous or alternative classifications had been used.
Conclusion
This is thought to be the first study in Aotearoa New Zealand to examine enrolment patterns and the reasons for variation in rates of GP bypass using a geospatial approach. This study is based on a highly accurate and detailed patient enrolment dataset geocoded at the street-address level. This is likely the first study to use such data to examine GP clinic enrolments in a mixed urban–rural setting to understand how travel behaviour for health care is influenced by a variety of factors, including clinic attributes, rurality of residence, patient characteristics and area-level socioeconomic deprivation. The results suggest that closest facility accessibility measures, which assume patients use the service closest to their home, should be treated with caution as the decisions people make around which service to access and where appear to be much more complex. These results also suggest that a variety of factors influence the choice of patients to either use or bypass their closest GP service, and primary health services in Aotearoa New Zealand should be developed to reflect the realities of the populations they serve.
Acknowledgements
Hauraki PHO supported this research by providing patient enrolment and workforce data. This research is also supported by a University of Waikato Doctoral Scholarship.
References
appendix I:
Appendix I: Statistically significant interaction terms from the logistic regression model.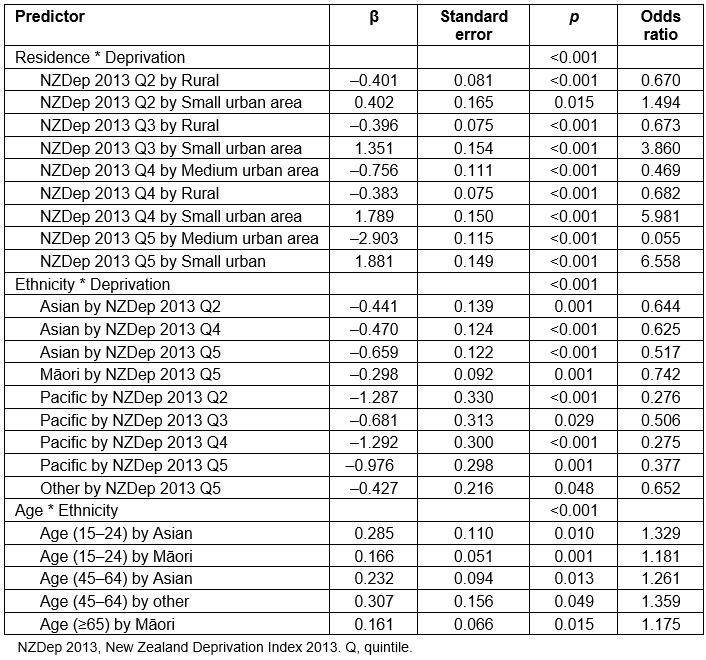
You might also be interested in:
2019 - Teleneurology service provided via tablet technology: 3-year outcomes and physician satisfaction
2016 - Towards understanding the availability of physiotherapy services in rural Australia