

Introduction
Cancer is the second leading cause of death in the USA1. While cancer deaths have decreased nationally, declines have been much slower in rural areas than in urban areas. Living in rural, low-population-density areas has been associated with poor cancer outcomes and survival2,3. Rural healthcare provider shortages and a lack of available cancer services contribute to these disparities4-7. Breast cancer is the most common cancer among females and accounts for 30% of all new cancer cases in women8. Lower reported incidences and higher death rates for breast cancer in rural areas than in urban areas have been documented and may be due to lower cancer screening rates and treatment access for women in rural areas9-11.
Previous studies on the availability of rural cancer services have been limited to specific points along the cancer care continuum (eg screening, diagnosis or treatment) and require updating to capture the current rural health landscape since implementation of the Affordable Care Act (ACA) and updated breast cancer screening guidelines. In Texas, mammography machines were present in only 50% of Texas counties and unequally distributed geographically7. Less populated areas were less likely to have mammography machines, which was associated with lower screening rates and a higher breast cancer stage at diagnosis7. While the majority of rural cancer patients have access to surgical services, fewer than half have radiation oncology services within 48 km (30 miles) of their residence, which involve daily treatments12.
Previous studies documented rural–urban disparities in human resources for cancer prevention and treatment. Healthcare providers disproportionately practise in urban areas4. Rural areas often face shortages or have no specialists that are integral to cancer screening and care, such as medical oncologists, radiation oncologists and general surgeons13-15. While gynecologic oncologists are disproportionately located in metropolitan areas, ovarian cancer death rates have been shown to increase with increased distance to a practising gynecologic oncologist16. Urban counties have higher urologist densities than rural counties while rural counties are associated with higher kidney and renal pelvis cancer mortality3.
Current research is limited on the present-day landscape of rural breast cancer screening and treatment capacity and resources across the cancer care continuum. It is unclear how these rural disparities affect breast cancer incidence and death. This study hypothesized that lower cancer service capacity is associated with lower reported cancer incidence and higher death rates. This article aims to explore the association between county-level breast cancer capacity and services and cancer incidence and mortality outside of Arizona’s two metropolitan counties (Pima and Maricopa).
Methods
Survey design
A survey was developed to assess organizational cancer capacity and resources for breast cancer. Organizational capacity was defined using the Public Health Services and Systems Research Model17. Survey questions were adapted from previous studies assessing breast cancer capacity18-20. The Arizona Center for Rural Health, the Arizona Alliance for Community Health Centers, and universities across the USA participating in the Rural Supplement Workgroup that had rural cancer supplement grants funded by the National Cancer Institute reviewed the survey during the development phase. Management and leadership from the Arizona Department of Health Services, University of Arizona Cancer Center, State Office of Rural Health and the Arizona Tribal Coalition also reviewed the survey in the spring of 2019. They were asked to provide feedback on the survey and note any questions that were confusing or required respondents to provide information that would be difficult to collect. Survey questions were adapted based on feedback from these stakeholders to ensure survey feasibility and participation.
Survey population focus and distribution
Since population-centered urban areas have more cancer capacity and resources than rural areas with lower population density, this survey focused on documenting the current landscape of cancer capacity and resources in low populous areas. Survey data were collected from areas with low population density. As a result, locations in 13 of Arizona’s 15 counties were surveyed. Arizona’s two largest counties, Maricopa and Pima, comprising 76% of the state’s total population across just 16% of its total land area, were excluded from this survey since the majority of their populations are clustered in large urban areas (Phoenix and Tucson) with easy access to cancer services.
With partner organization assistance, the survey was distributed to key individuals at healthcare entities operating in low populous areas of Arizona in 2019 to assess organizational capacity of breast cancer screening, diagnostic and treatment services. Partner organizations operating in rural Arizona helping disseminate the survey included the following. The Arizona Center for Rural Health sent the survey to critical access hospitals and rural health clinics; the Arizona Alliance for Community Health Centers sent the survey to its organizational members that are Federally Qualified Health Centers (FQHCs) and FQHC look-alikes, which are health centers that meet requirements but do not receive federal funding; and the Arizona Department of Health Services sent the survey to county public health departments. The Food and Drug Administration online Mammography Facilities Database and the state Medicaid program (Arizona Health Care Cost Containment System) website were used to identify community hospitals, health centers, and freestanding imaging centers. Key individuals at healthcare entities operating in rural Arizona who were asked to complete the survey included leadership (organizational directors and chief officers), clinicians, managers, or other personnel with the ability to complete the survey.
A total of 58 organizations were identified and included in the survey. Contacts were instructed to fill out the survey for their entire organization at the county level and were given a $20 gift card. For example, an organization with clinical sites in two counties was asked to fill out two surveys to determine the availability of capacity and services of their organization in each county. This resulted in 72 county-level organizations representing 166 clinical sites. Thirty-one county-level organizations completed the electronic survey, resulting in a response rate of 43%. For organizations that did not respond or were not reached successfully, follow-up calls were made and publicly available information from internet sources was used to complete the survey. This included searching organization/clinic websites, annual reports, imaging/procedure order forms, health and wellness flyers, and patient reviews of clinics/facilities. There were no differences in response rates between county-level organizations in metropolitan (42%) and non-metropolitan counties (44%).
Variables
Respondents were asked what type of organization best described their facility, which included critical access hospital, rural health clinic, FQHC/FQHC look-alike, county public health clinic, or other. They were asked which county their organization was located in and the title of the individual filling out the survey (financial manager, social worker, nurse, case manager, advanced practice nurse, facility administrator, department administrator, physician, or other).
Onsite service availability: Each organization was asked to check off the breast cancer screening, diagnostic and treatment services provided. Screening and diagnosis included in-house mammography. Treatment included surgery, radiation therapy, chemotherapy, hormone therapy, and/or biological therapy.
Healthcare personnel: County-level healthcare personnel numbers were pulled from the Centers for Medicare and Medicaid Services National Provider Identifier database in August 2019 because personnel data from surveys was limited for some organizations.
Breast cancer incidence and mortality: The Arizona Department of Health Services, Arizona Cancer Registry provided age-adjusted county-level breast cancer incidence and death rates from 2010 to 2016.
County demographics: County demographic information from 2017 was obtained from the US Census Bureau website; income data were provided by the US Bureau of Economic Analysis, and current unemployment rates were provided by the US Department of Labor. Rural-Urban Continuum (RUC) codes from the Food and Drug Administration for each county were used to designate metropolitan and non-metropolitan counties using codes that range from 1 to 921.
RUC codes 1–3 indicate metropolitan (urban) counties and are defined as follows: 1=counties in metropolitan areas with ≥1 million people; 2=counties in metropolitan areas with 250 000 to 1 million people; and 3=counties in metropolitan areas with <250 000 people. RUC codes 4–9 indicate non-metropolitan (rural) counties and are defined as follows: 4=urban population of > 20 000 adjacent to metropolitan area; 5=urban population of ≥20 000 not adjacent to metropolitan area; 6=urban population of 2500–19 999 adjacent to metropolitan area; 7=urban population of 2500–19 999 not adjacent to metropolitan area; 8=completely rural or urban population <2500 adjacent to metropolitan area; and 9=completely rural or urban population <2500 not adjacent to metropolitan area21,22.
Statistical analyses
Individual clinic site (total and by breast cancer services offered) and healthcare provider numbers in each county were converted to per capita rates per 100 000 people, using age-adjusted breast cancer populations for breast cancer incidence and mortality. Primary care physicians included family medicine, general practice, and internal medicine physicians. Descriptive statistics were used to summarize county-level demographic information. Student’s t-test was used to evaluate rural–urban county differences for continuous variables and chi-square tests were used to evaluate rural–urban county differences for binary and categorical variables.
Multivariate regression was used to evaluate the association between breast cancer capacity and breast cancer incidence and mortality. Dependent variables included county-level age-adjusted breast cancer incidence and mortality rates. Independent variables included county RUC code (coded as binary to indicate urban (RUC codes 1–3) and rural (RUC codes 4–7) county status), per capita healthcare providers, per capita clinic sites providing on-site breast cancer screening, diagnostic, treatment, and all three services. Analyses were completed using Stata v14.2 (Statacorp; http://www.stata.com).
Ethics approval
The survey and methodology for this study was approved by the University of Arizona Institutional Review Board (Protocol number 1 903 467 465).
Results
County demographics
Thirteen of Arizona’s 15 counties were represented in the cancer capacity and resources survey; no survey data were collected for the two metropolitan counties with the largest populations (Maricopa and Pima) since the survey focused on low population density, rural areas. County demographic information is summarized in Table 1. There were six counties with RUC codes 1–3, indicating metropolitan counties, and seven counties with RUC codes 4–7, indicating non-metropolitan counties. There were no completely rural counties with RUC codes 8 or 9. The average RUC code was 4 overall and lower for metropolitan counties (3) than for non-metropolitan counties (5) (p≤0.01). Metropolitan counties had a larger average population (216 773) than non-metropolitan counties (49 507) (p=0.01). Individuals in metropolitan counties were significantly more likely to be Asian (1.4%) and other race (0.1%) than in non-metropolitan counties (0.6%, 0.0%) (p≤0.01, 0.03). There were no other significant demographic differences between metropolitan and non-metropolitan counties.
Table 1: Demographics of Arizona counties included in the Cancer Capacity and Resources Survey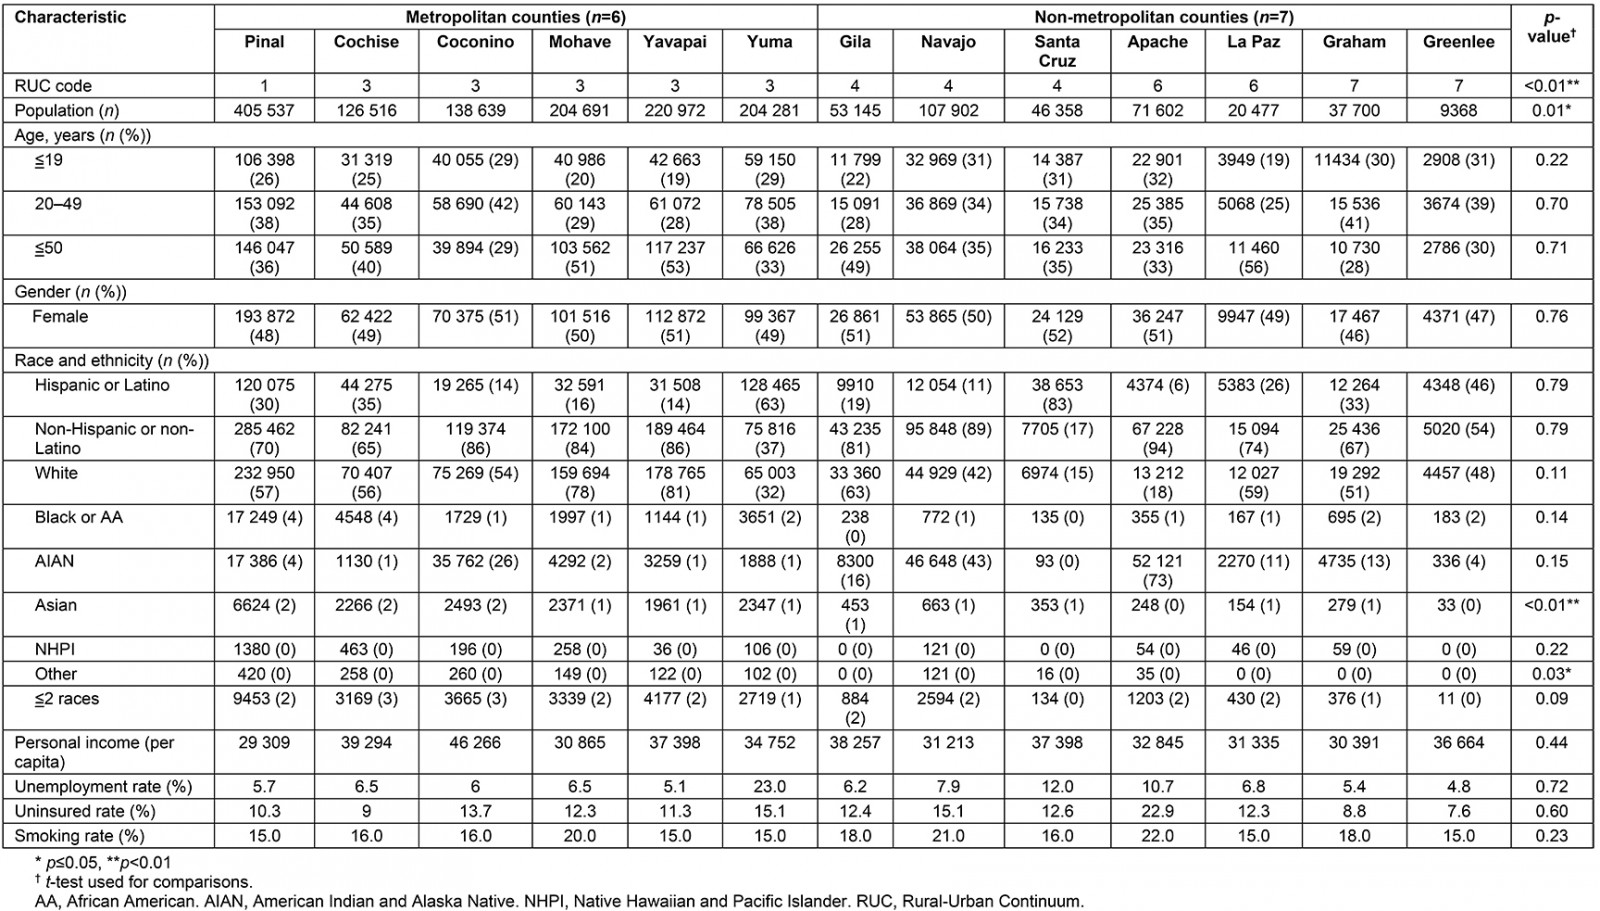
Per capita sites
Out of the 72 county-level organizations, 31 (43%) completed the electronic survey. Surveys were completed by facility administrators (45.2%), physicians (32.3%), department administrators (9.7%), advanced practice nurses (3.2%), or other staff (9.7%). The county-level per capita clinic sites are summarized in Table 2, overall and by county metropolitan status. There were 166 organizational sites represented in the survey. Overall and on average per capita, Federally Qualified Health Centers were the most common (5.1), followed by critical access hospitals and rural health clinics (4.8), county public health departments (3.1), hospitals and health centers (1.9), and free-standing imaging centers (0.2). There were no free-standing imaging centers in non-metropolitan counties. Non-metropolitan counties had more total per capita sites (20.4) than metropolitan counties (8.9) (p=0.02) included in the survey.
Table 2: Population-adjusted per capita organizations and sites by type included in the Cancer Capacity and Services Survey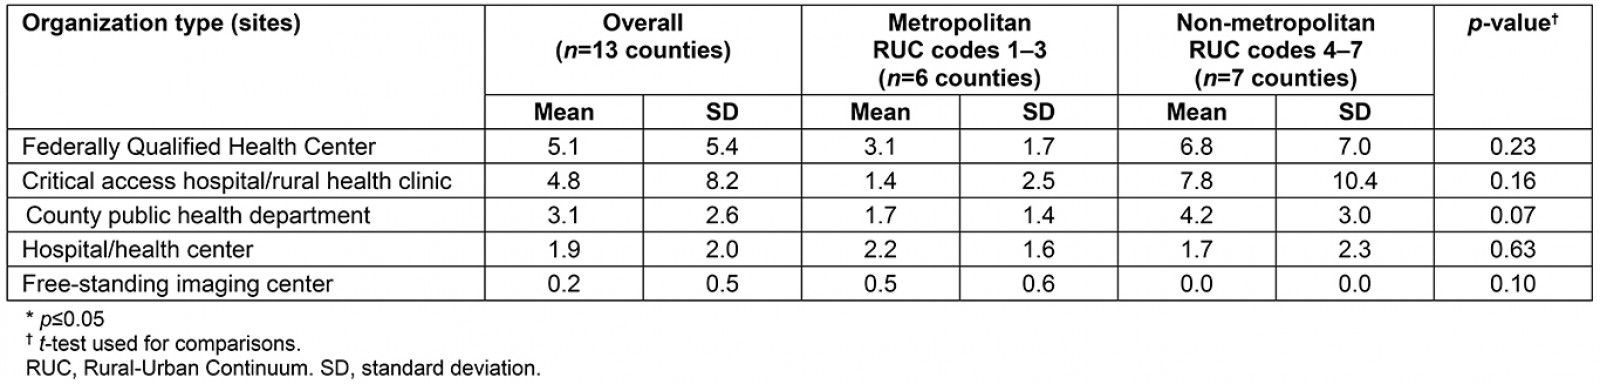
Onsite services availability
The per capita clinical sites providing onsite breast cancer services are summarized in Figure 1. Per capita, screening was the most common onsite breast cancer service provided (2.8) followed by diagnosis (2.7), treatment (2.1), and all three services (1.8). No differences in the per capita availability of onsite services for screening (p=0.25), diagnosis (p=0.41), treatment (p=0.10), and all three services (p=0.08) were observed between metropolitan and non-metropolitan centers.
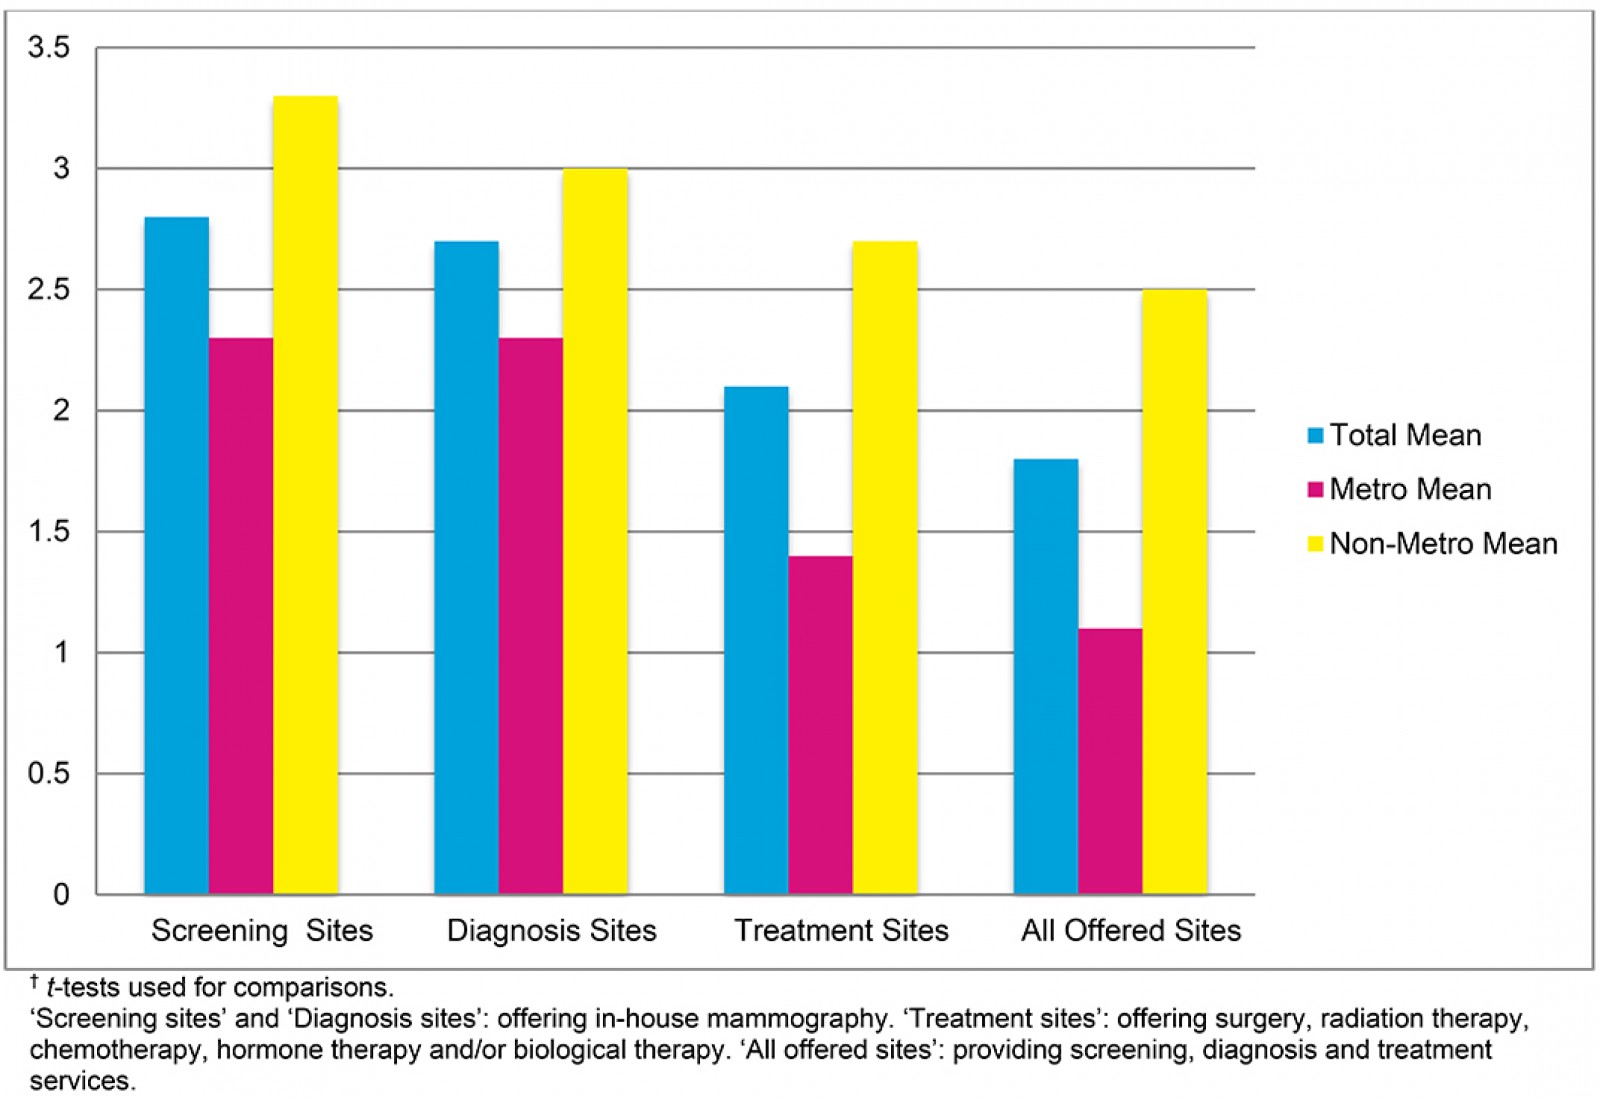 Figure 1: Per capita breast cancer onsite service availability.†
County-level human resources
Metropolitan counties had more per capita pathologists (2.3) than non-metropolitan counties (0) (p≤0.01). There were no medical oncologists in non-metropolitan counties, although the metropolitan versus non-metropolitan county difference was not significant (p=0.09).
Overall per capita, family medicine were the most common physician type (47.3) followed by internal medicine (23.8), obstetricians and gynecologists (8.7), surgery (6.3), radiology (3.7), general practice (2.6), oncology (1.3), pathology (1.1), and medical oncology (0.2). A similar trend was observed in metropolitan counties with family medicine doctors being the most common physician type (38.3) followed by internal medicine (30.2), obstetricians and gynecologists (10.9), surgery (7.9), radiology (4.6), general practice (3.4), oncology (1.9), pathology (2.3) and medical oncology (0.5). The trend was similar but slightly different for non-metropolitan counties, with family medicine being the most common physician type (55.1) followed by internal medicine (18.4), obstetricians and gynecologists (6.8), surgery (5.0), radiology (2.9), general practice (1.9), oncology (0.8), pathology (0.0), and medical oncology (0.0). There were no significant metropolitan versus non-metropolitan differences in the number of family medicine (p=0.33), internal medicine (p=0.12), obstetricians and gynecologists (p=0.22), surgery (p=0.35), radiology (p=0.42), general practice (p=0.22), oncology (p=0.31), or medical oncology (p=0.09) physicians. Population adjusted per capita healthcare providers by RUC code are summarized in Table 3. There were no pathologists or medical oncologists in any of the non-metropolitan counties as previously noted. Per capita, there were hematology and oncology physicians in non-metropolitan counties with RUC codes 4 (0.3) and 6 (2.5); however, there were none in non-metropolitan counties with RUC code 7. Per capita, there were radiologists in non-metropolitan counties with RUC codes 4 (2.8) and 6 (6.0); however, there were none in non-metropolitan counties with RUC code 7.
Table 3: Average per capita healthcare provider rates by metropolitan and non-metropolitan Rural-Urban Continuum codes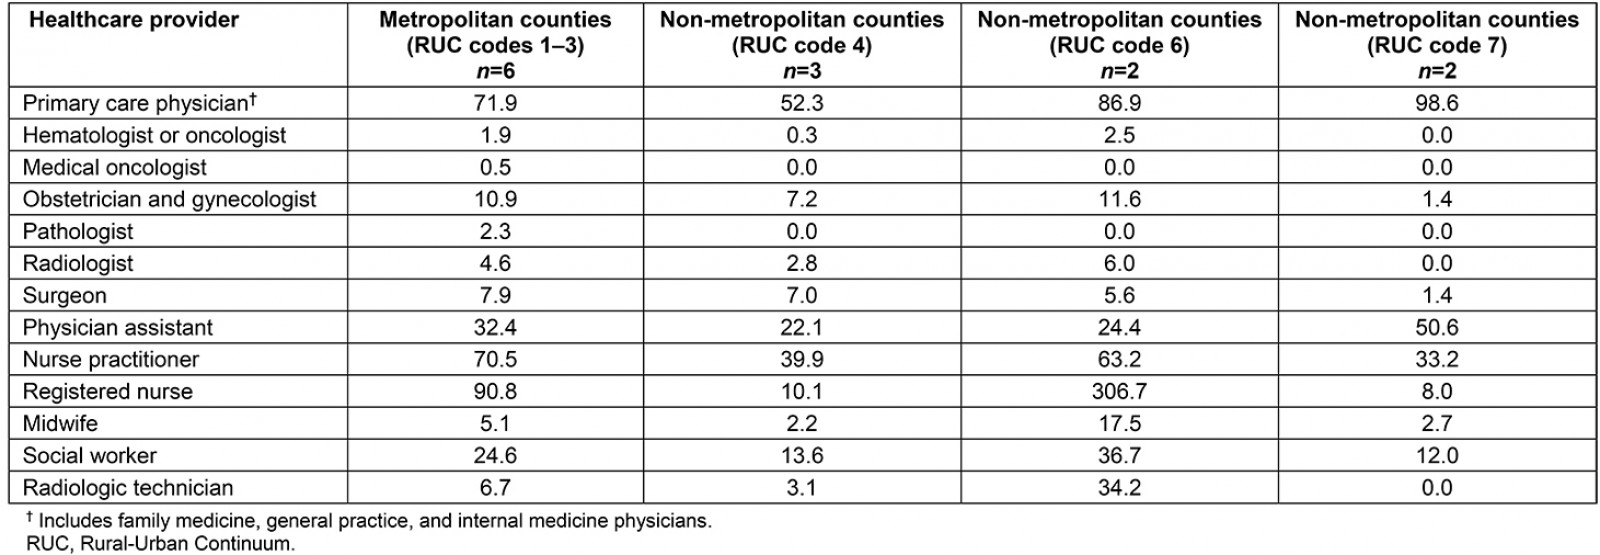
Breast cancer incidence and mortality
Rural county status was associated with a decrease in breast cancer incidence (β=–20.1, 95% confidence interval (CI) –37.2– –3.1). There was no association between breast cancer incidence and county-level per capita sites providing breast cancer screening (β=–8.8, 95%CI –23.9–6.9), diagnosis (β=–5.2, 95%CI –22.2–11.7), treatment (β=–6.5, 95%CI –23.2–10.2) and all three services (β=–8.0, 95%CI –23.9–7.9) or county-level per capita primary care physicians (β=0.0, 95%CI –0.54–0.48), hematology oncology physicians (β=–0.9, 95%CI –15.7–13.8), medical oncology physicians (β=35.2, 95%CI –22.7–93.0), obstetric and gynecology physicians (β=–0.5, 95%CI –4.2–3.2), radiologists (β=–0.2, 95%CI –6.8–6.4) and surgeons (β=1.6, 95%CI –3.1–6.3). The association between breast cancer incidence and rural county status is broken down by RUC code in Table 4. In the unadjusted model, rural RUC codes 4 (β=–24.1, 95%CI –41.8– –6.4) and 6 (β=–32.6, 95%CI –53.0– –12.2) were associated with lower breast cancer incidence than urban counties. In the model adjusted for race (percentage of the county population that is Hispanic) and ethnicity (percentage of the county population that is American Indian and Alaska Native), RUC codes 4 (β=–19.0, 95%CI –37.7– –0.4) and 6 (β=–32.6, 95%CI –56.0– –7.9) were associated with lower breast cancer incidence than urban counties.
There was no association between breast cancer mortality and rural county status (β=–1.1, 95%CI –7.7–5.6), county-level per capita sites providing breast cancer screening (β=–0.2, 95%CI –4.2–3.8), diagnosis (β=0.4, 95%CI –3.8–4.6), treatment (β=0.4, 95%CI –3.9–4.6), all three services (0.2, –3.9–4.3) or county-level per capita primary care physicians (β=0.0, 95%CI –0.1–0.0), hematology oncology physicians (β=–1.6, 95%CI –5.3–2.1), medical oncology physicians (β=–0.9, 95%CI –17.2–15.3), obstetric and gynecology physicians (β=–0.6, 95%CI –1.5–0.3), radiologists (β=–0.7, 95%CI –2.4–1.0) and surgeons (β=–0.1, 95%CI –1.4–1.2).
Table 4: Rural-Urban Continuum code association with breast cancer incidence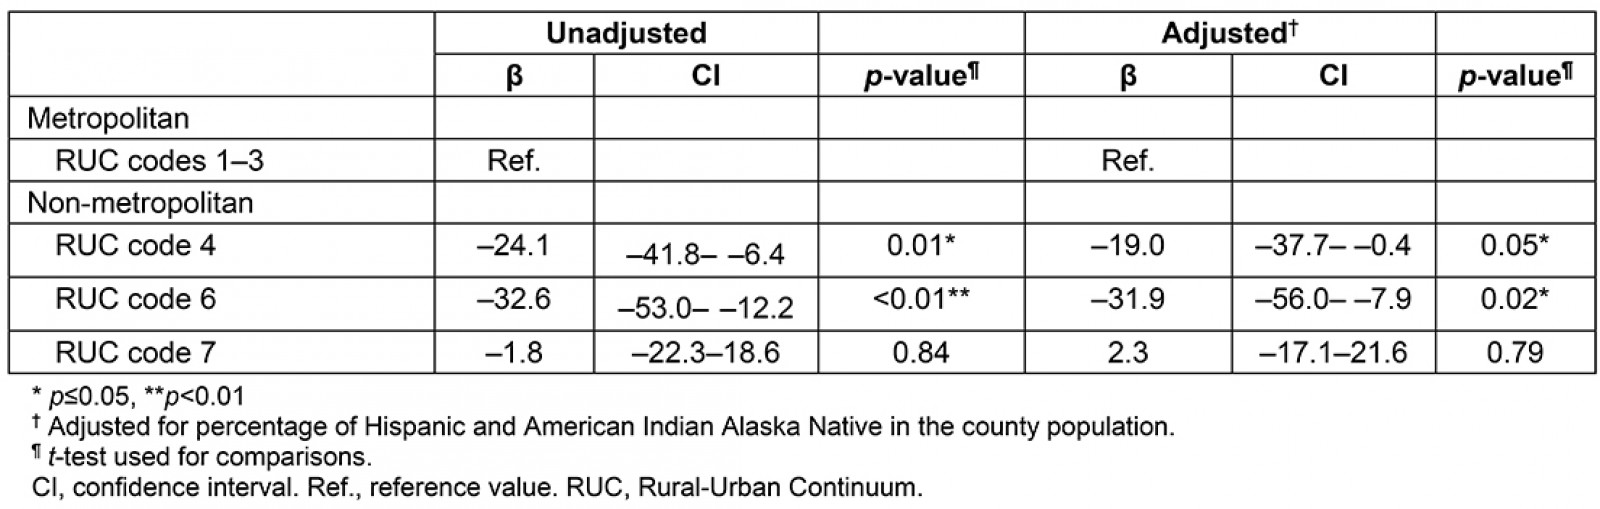
Discussion
The purpose of this study was to assess breast cancer capacity and resources in rural Arizona and evaluate the association with breast cancer incidence and mortality at the county level. There were two times as many clinical organization sites per capita in non-metropolitan counties than in metropolitan counties on average. Arizona’s decision to expand Medicaid may explain this availability of clinical sites in non-metropolitan counties since Medicaid expansion under the ACA has been associated with reductions in closures of rural healthcare facilities23. There were no medical oncologists or medical pathologists in the non-metropolitan counties. Although differences were not statistically significant, non-metropolitan counties had higher per capita rates of physician assistants and nurses, which could indicate that these professionals comprise a significant portion of professionals delivering health care in rural areas. Rural county status was associated with lower breast cancer incidence rates than urban counties, which may be due to factors beyond site and personnel capacity.
The findings from this study related to lower rural vs urban per capita physician specialists are consistent with other research. A 2004 survey studying colorectal cancer screening capacity in Arizona found that there were no gastroenterologists and colorectal cancer surgeons in six out of the state’s seven non-metropolitan counties13. The findings from this 2019 study highlight rural healthcare provider shortages that still persist 15 years later. The American Society of Clinical Oncology estimates that only 3% of medical oncologists work in rural areas14. Other studies have found a rural–urban disparity in the number of gastroenterologists, general surgeons, and radiation oncologists15. Due to increases in the number of insured Americans as a result of the ACA and resulting demand for cancer services, this oncology provider shortage is expected to continue to worsen in the coming years24.
The findings from this study on the greater availability of non-physician healthcare providers in rural areas than in urban areas is consistent with other research. Previous studies have shown that physician assistants are more likely than physicians in non-primary care specialties to serve rural areas25. Medicare beneficiaries living in rural areas are more likely to seek primary care services from a physician assistant compared to those living in urban areas26. Rural patients with cancer are also more likely to receive cancer care from a nurse practitioner or physician assistant instead of a physician compared to urban patients27. Further training and integration of non-physician clinicians into oncology care delivery may represent an opportunity to reduce rural cancer disparities in screening, prevention, treatment and follow-up care28.
Previous research on rural–urban differences in breast cancer incidence has had mixed results. US studies have found lower breast cancer incidence rates in rural areas than in urban areas nationally29,30. In a regional analysis, this same trend of lower rural breast cancer incidence was observed in the West US Census Region where Arizona is located30. However, other studies found that rural Appalachians had higher breast cancer incidence rates than urban Appalachians31. While the reasons for these mixed research findings are unclear, the presence of breast cancer screening programs is generally associated with increases in breast cancer incidence rates32.
Health insurance reform under the ACA improved access to cancer care through several mechanisms, including increased health insurance coverage and coverage of no-cost preventive services33. Medicaid expansion under the ACA has been shown to increase health insurance coverage for both rural and urban areas with the greatest reductions in uninsured numbers in rural areas34. While this study adjusted for the uninsured rate in the analyses, insurance type may explain observed differences in breast cancer incidence rates. Women with public insurance (eg Medicaid) are less likely to meet follow-up guidelines for diagnostic mammography than those with private insurance35. Since individuals in rural areas are more likely to have public health insurance, differences in insurance type may better explain lower reported breast cancer incidence rates in non-metropolitan versus metropolitan counties.
The US Preventive Services Task Force updated their breast cancer screening guidelines in 2009 to remove the recommendation for mammograms every 1–2 years for women 40 and older. The updated guidance recommends mammograms every other year for women aged 50–74 years and individual screening decisions for women aged 40–49 years36. Despite this reduction in recommended frequency of breast cancer screening, some women may undergo mammography in excess. Previous research has shown that abundant access to primary care, patient desire for breast cancer screening, and physician type (obstetricians and gynecologists) are associated with mammography overuse37. Barriers to primary care in rural areas, including primary care physician shortages, have been well documented38. This study found more per capita obstetricians and gynecologists in the metropolitan counties (10.9) than in the non-metropolitan counties (7.2). Ample access to primary care and a greater number of obstetricians and gynecologists could result in higher mammography use in metropolitan counties than in non-metropolitan. It is possible that higher frequency of mammograms in metropolitan counties versus non-metropolitan counties could result in increased early detection, explaining observed differences in breast cancer incidence rates.
There were no statistically significant differences in breast cancer incidence rates between urban and the most rural counties (RUC code 7) in this study, which was a surprising finding. After looking at the two rural counties with RUC code 7 separately, this finding was driven by Graham County. Reasons for breast cancer incidence rates similar to urban counties in this rural county may include a rural hospital with mammography and a general surgeon on staff, mobile mammography and a cancer center that offers comprehensive cancer services, including a robust imaging program. Mobile mammography programs can improve cancer screening rates among women who lack access to traditional mammography facilities, including those living in rural areas39,40. These Graham County factors may contribute to higher breast cancer detection and therefore reported incidence in the rural county category41. Most cancer centers are located in urban areas42.
While non-metropolitan county status was associated with lower breast cancer incidence compared to metropolitan counties, this study did not find an association between breast cancer incidence and per capita sites providing breast cancer services across the cancer care continuum or per capita healthcare providers. In the rural counties with significantly different breast cancer incidence rates from urban counties, other factors beyond the number of sites and personnel may contribute to lower incidence rates. Distance or travel time to mammography facilities has been associated with lower screening rates43. Although screening services may exist in rural counties, it’s possible that distance to services creates a barrier, resulting in lower incidence rates. For example, Coconino County is the second largest county in the USA44. At more than (46 620 km2) 18 000 square miles (almost the size in land area of Pima and Maricopa counties combined), it takes several hours to drive across the entire county. Mammography existence in Coconino County may not equal proximity and easy access to breast cancer screening services.
Racial differences in breast cancer screening have been documented and show that White women are more likely to get screened than women from other racial backgrounds45. Data from the National Health Interview Survey show that American Indian and Alaska Native women have lower breast cancer screening rates than White women. Hispanic women have lower breast cancer screening rates than non-Hispanic women46. Another study evaluated a mobile mammography intervention in the Northern Plains. It found that the majority of American Indian women had not had a mammogram within the last two years and had lower screening guideline adherence rates than the national average47. The invasive nature of mammography, lack of breast cancer knowledge, cost, and distance to care have been shown to contribute to low screening rates among American Indian and Alaska Native women48,49. Hispanic women reported cost, transportation, lack of health insurance, immigration status, and translation issues as barriers to breast cancer screening50. Although this survey analysis adjusted for the percentage of the county population that are Hispanic, American Indian and Alaska Native, it is unclear if racial or ethnic differences across counties contribute to the observed disparities without breast cancer incidence rates for each racial/ethnic group.
Although these data showed no rural–urban differences in breast cancer mortality rates, previous studies demonstrated higher breast cancer mortality rates for women in rural areas than in urban areas. A study using Utah cancer registry data found women in urban areas had higher survival rates than those living in rural areas51. It is unclear why the present study did not detect a difference in county-level breast cancer mortality rates between Arizona’s rural and urban counties. Previous research has shown that patient navigators or community health workers may be effective in coordinating cancer follow-up and treatment after an abnormal mammogram52. Community health workers are prevalent in Arizona, with more than 1000 currently working across the state53. Compared to other states, Arizona’s State Office of Rural Health has more staff working with rural clinical sites to improve and ensure healthcare service availability in rural Arizona54.
While there were no statistically significant urban–rural Arizona county-level differences in breast cancer mortality rates in this study, disparities have been well documented in specific populations in other studies. Women with low socioeconomic status have lower rates of breast cancer survival across all races and ethnicities, which may be driven by differences in access to preventive care55. Racial and ethnic differences in breast cancer mortality exist by geographic area56. It is unclear if such differences exist in Arizona without breast cancer mortality rate data specific to socioeconomic status and racial/ethnic groups.
This study is the first rural assessment of breast cancer capacity and resources across the cancer care continuum. The electronic survey response rate of 43% was consistent with other studies surveying similar organizations57. This study did not survey the two major metropolitan Arizona counties, which may diminish the ability to detect rural–urban differences in this survey. Including these two metropolitan counties, which have significantly more resources, may have brought the survey data for Arizona’s other metropolitan counties closer to the non-metropolitan counties. This study excluded mobile mammography since mobile services were found to be infrequent if they were offered at all, and difficult to find from publicly available information, such as organization websites. This study used the Centers for Medicare and Medicaid Services National Provider Identifier database to capture county-level provider numbers and was unable to estimate the per capita telehealth providers or clinical full-time equivalents. Lastly, this study used county-level data for the unit of analysis, resulting in a small sample size (n=13), which may have limited statistical power. Furthermore, the use of county-level data and RUC codes in Arizona poses a challenge. Out of the top ten largest counties in the USA, three are in Arizona44. Conducting research using the small number of counties in Arizona, the sixth largest state in land area, with large county land areas, may fail to capture more granular, local level disparities in cancer capacity and resources. Designating rural–urban status with county-level RUC codes may miss rural areas within metropolitan counties.
Conclusion
While Arizona’s rural counties may have more physical infrastructure clinical sites per capita for delivering cancer care than urban counties, its rural counties span vast geographic areas, have physician and health provider shortages or a complete lack of specialists integral to providing cancer services. Non-physician clinical providers (eg advanced practice nurses and physician assistants) may be more prevalent in rural areas and represent an opportunity for improving rural cancer prevention, treatment and follow-up care. Compared to urban counties, rural county status was associated with lower breast cancer incidence rates but not associated with higher breast cancer death rates. The number of sites delivering breast cancer services and physicians was not associated with breast cancer incidence or mortality at the county level. Other factors may contribute to rural–urban differences in breast cancer incidence. Future research should explore the association between cancer capacity and resources at a more local level. Using county-level data represents a challenge in Arizona, where counties span a vast geographic area.