
Introduction
General practice services in urban and rural areas, while overlapping in many respects, diverge in several important ways1. Patients attending rural and remote practices are, for example, likely to be served by a smaller clinical team that provides a greater range of clinical services than urban practices, which are more likely to be located close to hospitals2. Scotland’s National Health Service (NHS) provides health care that is free at the point of use and almost all Scottish citizens are registered with an NHS general practice. In this article, the differences between satisfaction levels expressed by NHS patients in urban and rural areas are examined.
In Scotland, the Health and Care Experience (HACE) survey has been run every 2 years since 2009 and aims to provide local and national information on the quality of health and care services from the perspective of users. The survey is sent to a random sample of patients registered with a general practitioner (GP) in Scotland, and asks about personal experiences of GP practice; out-of-hours health care; care, support and help with everyday living; and caring responsibilities. The HACE survey is mandated by the Scottish Government and run by Public Health Scotland.
The aim of the study was to determine if there is a systematic difference between urban and rural patient experience within Scottish general practices.
Methods
The research was a secondary analysis of data from the HACE survey of patient satisfaction. The complete details of the survey have been published elsewhere3-7. The survey was sent to a random sample of those who were registered with a GP in Scotland and aged 17 years or more. The number of surveys sent out varied between years, ranging from 485 380 for 2009–10 to 711 159 surveys for 2015–16.
The results of the survey between 2009–10, 2011–12 and 2013–14 were obtained from the Scottish Government website, while the 2015–16 and 2017–18 results were provided by Public Health Scotland on request.
The Scottish eightfold urban–rural classification (UR8) provides a standard definition of the rurality of areas and is updated every 2 years to incorporate the most recent ‘small area population estimates’ produced by National Records of Scotland and the Royal Mail postcode address file. Table 1 shows each UR8 classification and its code definitions. Further information regarding the methodology used for the population estimates for settlements can be found on the Scottish Government website8. The GP practice names obtained from Public Health Scotland were given a marker of ‘rurality’ using the Scottish Government UR8 classification.
The HACE survey responses were presented by GP practice name, while the information regarding the UR8 classification of each practice was allocated based on the practice code. Each GP practice result from the HACE survey was matched up with its UR8 classification based on its practice code. The UR8 classification allocation was based on the modal urban/rural category of the patients in each practice. Because the UR8 classifications are updated every 2 years, each year of survey results was matched up to the corresponding list of UR8 classifications to ensure the accuracy of ‘rurality’ based on the year of the release of the survey results (Table 2).
Patient-centred care and continuity of care were assessed based on a selection of questions from the 2017–18 survey, where respondents were asked to indicate their level of agreement with the following statements: ‘I was listened to’, ‘I was given enough time’, ‘I was treated with compassion and understanding’, ‘I was given the opportunity to involve the people that matter to me’, ‘I understood the information I was given’, ‘I was in control of my treatment/care’, ‘I knew the healthcare professional well’, and ‘my treatment/care was well coordinated’. The response alternatives were ‘very positive’, ‘positive’, ‘neutral’ and ‘negative’. Responses of ‘very positive’ and ‘positive’ were aggregated to give ‘percentage satisfied’.
The wording of the questions did not remain consistent for every survey. To facilitate appropriate longitudinal comparison, suitable alternative questions were identified from the previous surveys and then matched up with those selected from the 2017–18 questions (Appendix I). These questions were matched only when the meaning of the question was undoubtedly the same, and upon agreement between the co-authors. Some questions from the recent survey could not be compared over time due to a lack of consistency.
A total of 1008 GP practices participated in the 2009–10 HACE survey. A proportion of these practices could not be identified on the 2017–18 survey list, and some practices changed UR8 classification between 2010 and 2018.
Table 1: Scottish eightfold urban–rural classification and its definition for each code, settlement size and driving time9 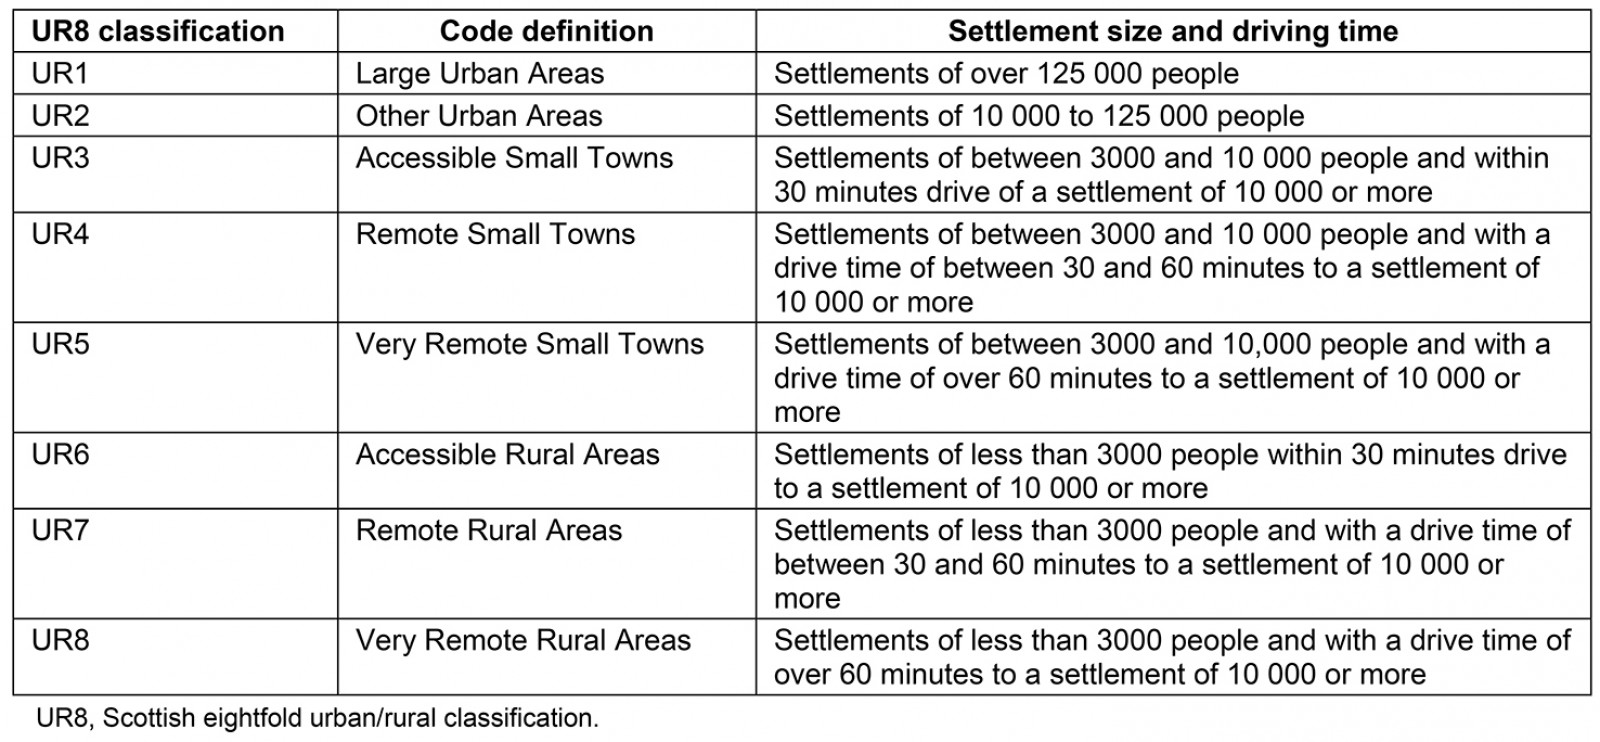
Table 2: Scottish eightfold urban–rural classification list years by which the general practice were matched up to their corresponding classification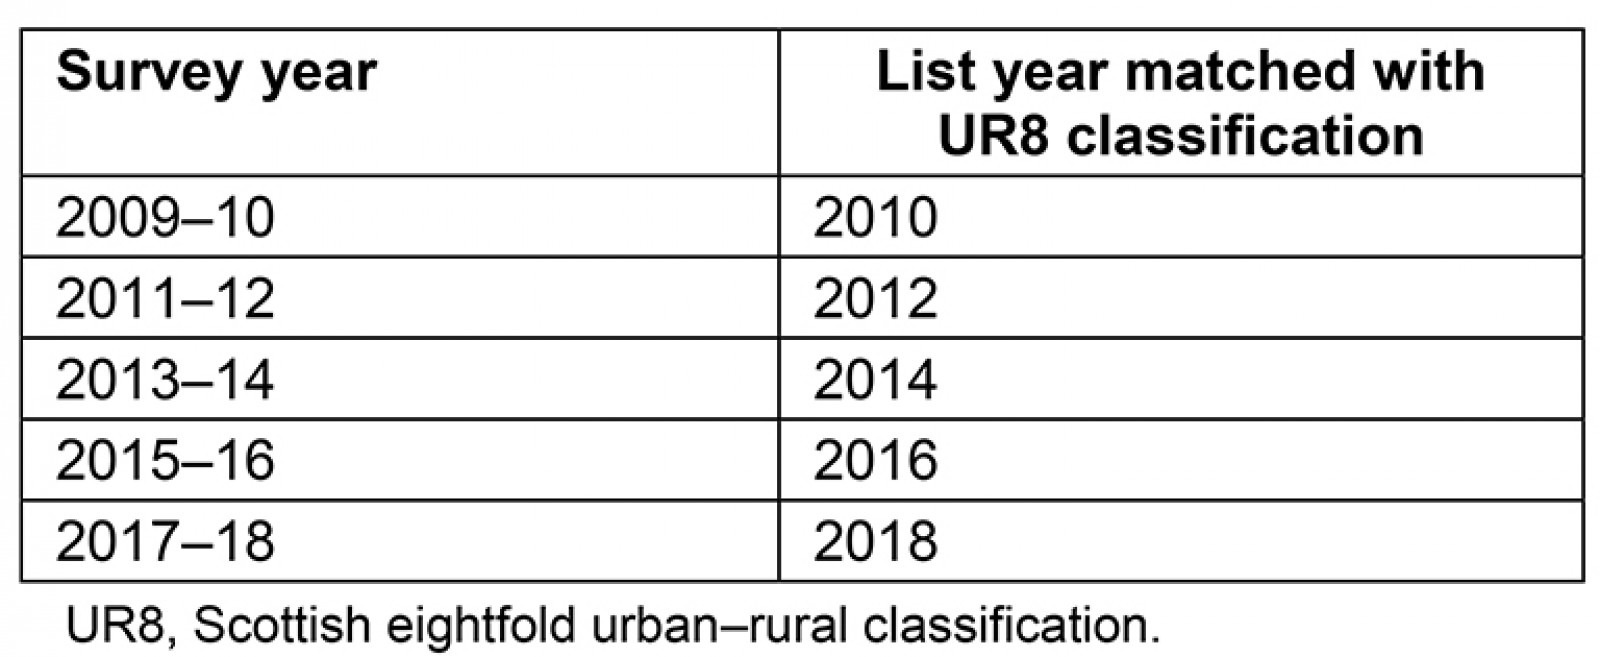
Data analysis
A database was constructed to show GP practice name, practice code, HACE survey result as a percentage of positive responses for each question analysed and UR8 classification. Averages were then calculated to give the mean percentage positive result for each survey year based on the UR8 classification. These data are available from the authors on request. Data were analysed utilising the Statistical Package for the Social Sciences v26 (IBM; http://www.spss.com). One-way analysis of variance (ANOVA) was used to assess change over time. Mauchly’s test of sphericity, Greenhouse–Geisser statistics and Tukey’s post-hoc analysis were applied to validate the measures for ANOVA.
Ethics approval
Ethics approval was not required as all data were available in the public domain.
Results
The response rates to the HACE survey were generally low. For example, for the 2017–18 survey results, there was a 22% response rate overall in Scotland7. Details of overall response rates for each survey year are shown in Appendix II. The response rate ranged from 18% of people living in large urban areas to 31% of people living in remote rural areas. This trend was also seen for all years of the survey analysed (Appendix III).
The respondents varied with regards to their gender and age. In every year of the survey analysed, females consistently had a higher response rate compared to males. Furthermore, the highest response rates were seen for those aged 65 years or more, and the lowest rates were seen in the youngest group of respondents. The exact response rates for each gender and age group are shown in Appendixes IV and V.
A total of 1008 GP practices participated in the 2009/10 HACE survey. Of these, 166 could not be identified on the 2017–18 survey list, possibly due to closures or mergers. Out of the remaining 842 practices existing in 2017–18, 71 (8.4%) changed UR8 classification between 2010 and 2018, therefore 771 practices remained consistent. Out of these, five practices had fewer than 100 patients, which were excluded as these were considered likely to offer services to atypical populations, for example specialist violent patient practices. Hence data relating to 766 practices were analysed for this study.
Due to the low number of GP practices in some UR8 classifications, categories (UR3–5 and UR6–8) were merged for some analyses.
The parameters of each collapsed UR8 category are described in Table 3. The maximum practice list size was 46 086 and the minimum 132. The largest number of practices was observed in UR1 (most urban), with the fewest observed in categories UR3–5. The highest mean practice patient list size was observed in the UR2 category, and the smallest mean list size was observed in UR6–8.
Table 3: Total number of practices in Scotland classified using Scottish eightfold urban–rural classification, mean, median, maximum and minimum practice patient list size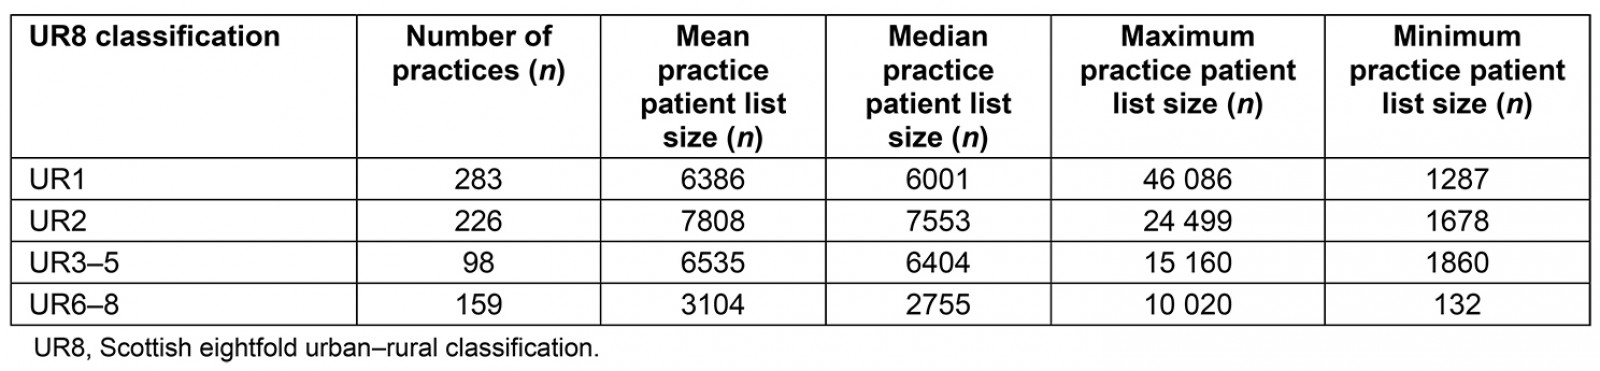
Cross-sectional data (2017–18 only)
There were significant differences in percentage positive responses by collapsed UR6–8 category for all questions (all p<0.001). Tukey’s post-hoc analysis showed that the UR6–8 practices were significantly more satisfied for all questions analysed. For some questions, such as ‘I was listened to’, UR1 was significantly different from UR2 and UR3–5, but there was no significant difference between UR2 and UR3–5. For all questions, patients in UR3–5 practices reported having the lowest satisfaction.
Overall satisfaction was lowest for the questions ‘I was given the opportunity to involve the people that matter to me’ and ‘I knew the healthcare professional well’, and these questions also elicited the largest differences according to rurality (Fig1).
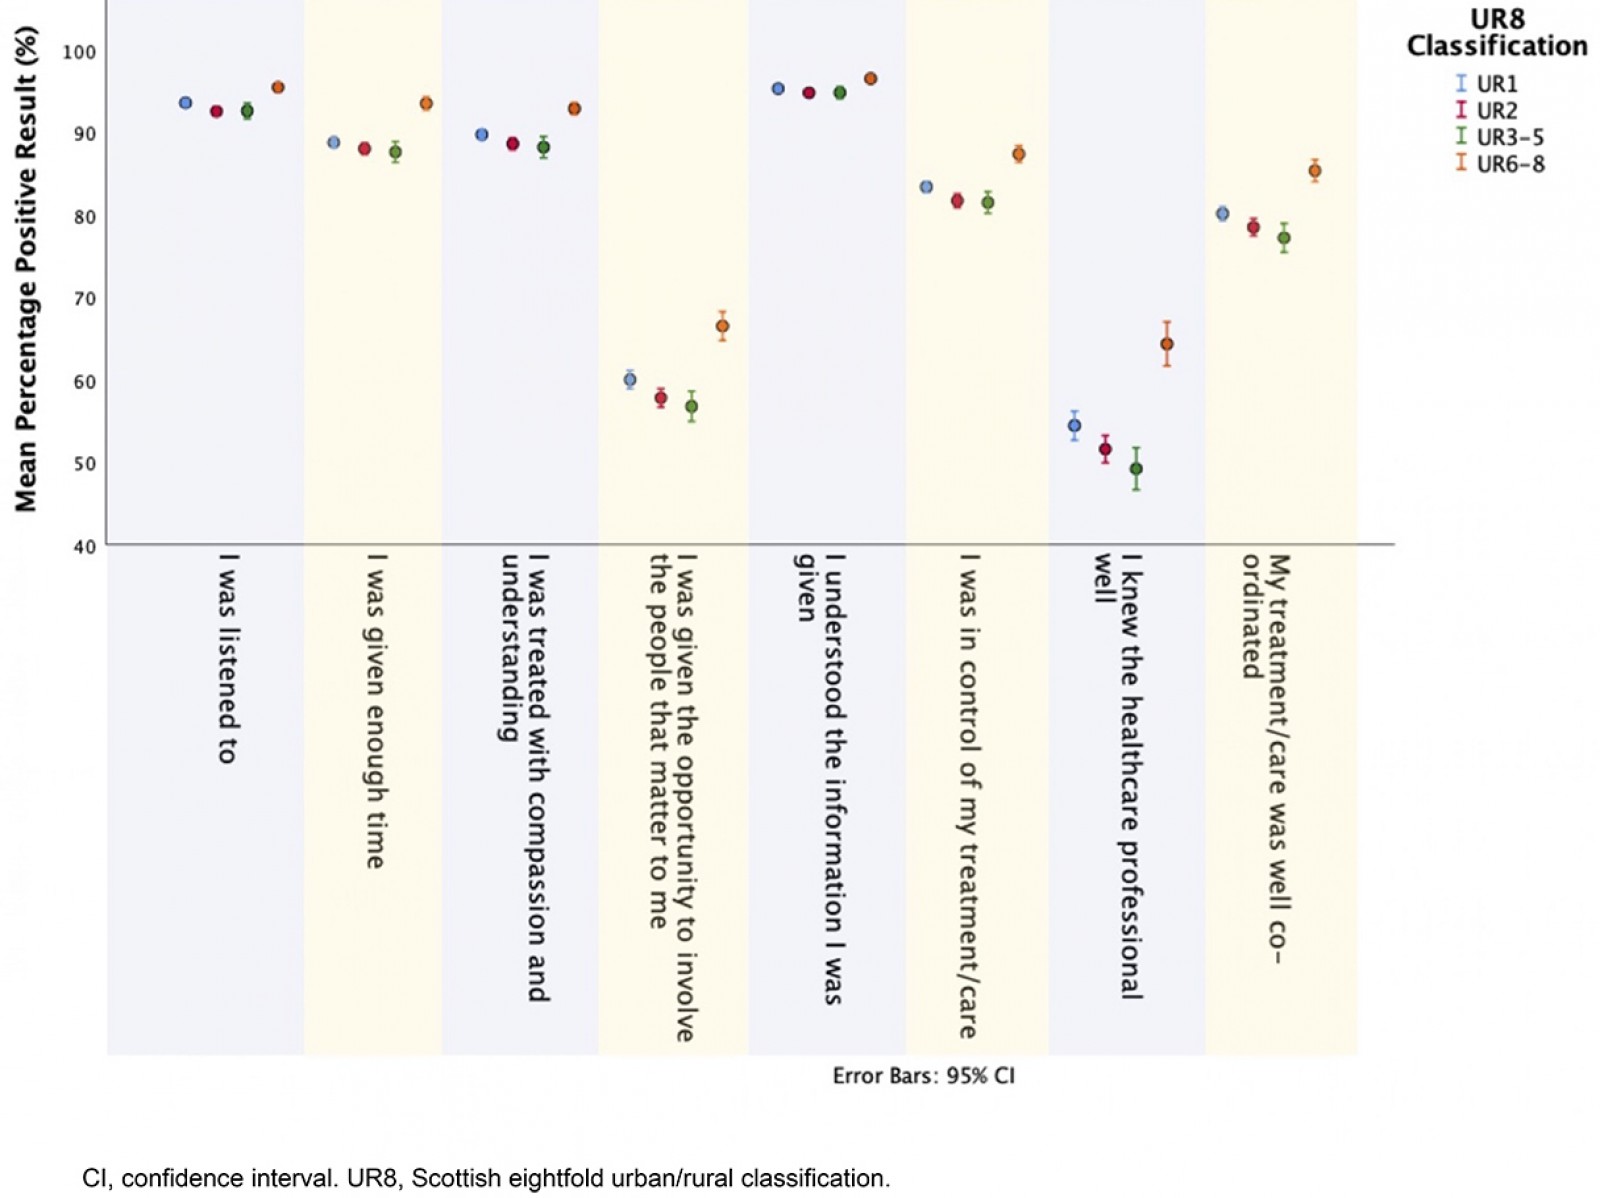 Figure 1: Cross-sectional data for 2017–18 survey results based on the Scottish eightfold urban–rural classification for each satisfaction question analysed.
Data trends over time (2010–18)
Patients within the UR6–8 classifications tend to be most satisfied, and this trend has stayed consistent over time. In particular, ‘I was given enough time’ showed a statistically significant difference across all years for UR6–8, compared to the other UR8 categories, which did not show any significant differences between themselves (Fig2).
Mauchly’s test of sphericity was violated for all questions analysed (p<0.05), hence it can be concluded that there are significant differences between the variance of differences.
Figure 2: Data change over time based on the Scottish eightfold urban–rural classification for each satisfaction question analysed.
Discussion
The findings suggest that, while Scottish patients generally have high levels of satisfaction when seeing a GP, those living in more remote rural areas (UR6–8) are most satisfied, while those residing in suburban and small town areas (mainly UR2 and UR3–5) are least satisfied. Given previous reports of lower levels of satisfaction among affluent patients10,11, it may be that this difference is due to socioeconomic differences in expectations of the health service. Patients desire their doctor to communicate well, provide clear information and display appropriate attitudes in consultations12, and this may be more likely to be possible in longer consultations, which may be more feasible in rural general practice given rural patients responded more positively to the question ‘I was given enough time’.
Personal continuity of care may be more characteristic of the small practices found in rural areas; more rural patients expressed satisfaction with this aspect of care in the 2017–18 survey for the question ‘I knew the healthcare professional well’. This finding suggests that levels of continuity of care are more limited in urban and suburban areas compared to rural areas. However, compared to all the questions analysed, it was this question that showed the lowest satisfaction levels across all UR8 classifications. This in turn may be detrimental to population health because it is known that increased continuity of care by doctors is associated with lower mortality rates13-18. The overall higher satisfaction in Scotland’s rural areas could also relate to perceptions of relatively good access to primary care services; for example, previous studies have shown that those in rural areas can obtain more timely appointments19. Future surveys could explore this further.
There may be other influences contributing to greater patient satisfaction in rural areas relating to the demands and opportunities facing rural clinicians. First, these clinicians may feel that they have a greater accountability to their patients as they are often more present and visible within the community. Second, rural clinicians are obliged to implement a wider range of practice due to the lack of other non-GP health services. For example, a GP who works in a practice during the day is also likely to be the same doctor who responds to the out-of-hours services overnight, during weekends or for emergency call-outs.
A third possible explanation for the large difference between rural and urban patient satisfaction is the greater access and availability of multidisciplinary teams available in urban areas. For example, a patient visiting their GP regarding mental health issues in an urban setting may be referred on to see a specialised multidisciplinary team, while in a rural setting this may be more difficult and the patient may be dealt with only by the GP. In addition to the greater fragmentation of urban primary care, the fragmentation of secondary care through subspecialisation may also contribute to lower patient satisfaction in urban areas: the associated loss of personal continuity in hospital care may be mitigated by greater continuity in rural primary care.
This study has several strengths. First, a major strength is that this study looked at 766 GP practices across Scotland. This provided a very large and extensive data set, increasing the reliability and validity of the study. Second, the results were obtained from a publicly accessible database provided by the Scottish Government, on behalf of NHS Scotland; almost all Scottish residents are NHS patients. The HACE survey provides a valid method for comparing urban and rural practices since they operate under a unified structure – this would not have been possible in countries where patients are provided with health care across diverse systems. Third, the results were obtained from a large-scale national survey, hence the entire sample of patients received exactly the same questions administered across all GP practices in Scotland. Fourth, longitudinal data were available to allow the observation of change in results over time, which allowed the differences from 2010 to 2018 to be analysed.
Several limitations are also evident. First, the response rates to the HACE survey were generally low and inconsistent across the sample; response rates were particularly low in urban areas. It is possible that demographic factors other than rurality may have affected response rates. The particularly low response rates from younger people and from males, possibly attributable to the extent of primary care service use, may have biased the results. The socioeconomic status of the respondents was not explored in this project, and could reveal further information regarding the representativeness of the data material. Another possibility is that residents of rural areas may feel more dependent on their practices because they have more limited alternative options for care from other practices or hospital emergency departments. This might translate into increased expressions of loyalty to their GP practice compared with patients in more urban areas.
Furthermore, 8.4% of practices changed UR8 classification between 2010 and 2018, and results from these practices were not included in the analysis, which may have slightly altered the results of the study. Also, some practices had merged, while others could not be identified between 2010 and 2018, hence these were not included in the analysis. Finally, despite longitudinal data being available from 2010 to 2018, the questions asked in the HACE survey varied slightly over the years, making it difficult to compare all questions exactly. This required a comparison of questions based on similarity, which may have affected result validity.
A confounding factor related to these results could be practice sizes; since rural practices tend to be smaller, they have fewer doctors on average. Hence smaller practices may have patients with higher levels of satisfaction due to having an increased likelihood of continuity of care20. For example, if there were only two doctors to choose from then it is more likely that the patient could see their desired doctor, whom they usually visit. On the other hand, if a practice had 15 doctors then it would be less likely for the patient to see the same doctor during every visit to the GP practice. This trend has also been highlighted in a project carried out in England that studied the predictors of patient survey results in primary care21.
This work aligns with findings in other studies in Scotland: satisfaction with local doctors and hospital services has been reported to be higher in rural locations22. International studies such as research carried out in Portugal have shown a similar trend23. On the other hand, work carried out in Ghana reported no difference in satisfaction in primary health care between urban and rural areas24.
Patient satisfaction is a crucial and commonly used indicator for measuring the quality of health care, and it is a key analytical concept directly related to the quality of health services25,26; it reflects to a large extent the gap between patient expectations and care received11. Patient-centred care improves both patient satisfaction and clinical outcomes27-30. It would be valuable to take this study further. First, qualitative research with patients from diverse urban and rural communities examining reasons for their degrees of satisfaction would help to gain a more in-depth understanding of these results and could generate ideas to improve satisfaction, especially in suburban areas. Second, further quantitative research could establish the contribution of confounding factors such as socioeconomic status.
Conclusion
Those living in remote and rural areas of Scotland tend to have the highest satisfaction with their GP practice in terms of patient-centred care and continuity of care. Those in suburban populations, however, tend to be least satisfied in the same domains. Further work is needed to understand the mechanisms underlying these findings.
Acknowledgements
The authors thank Dr Mary Kynn, lecturer in Medical Statistics at University of Aberdeen, for statistical support and guidance during this study. The authors also thank Euan Smith of the Care Experience Survey Team for assisting with access to survey data.
References
appendix I:
Appendix I: Questions from 2009-10, 2011-12, 2013-14 and 2015-16 surveys matched to 2017-18 survey based on similarity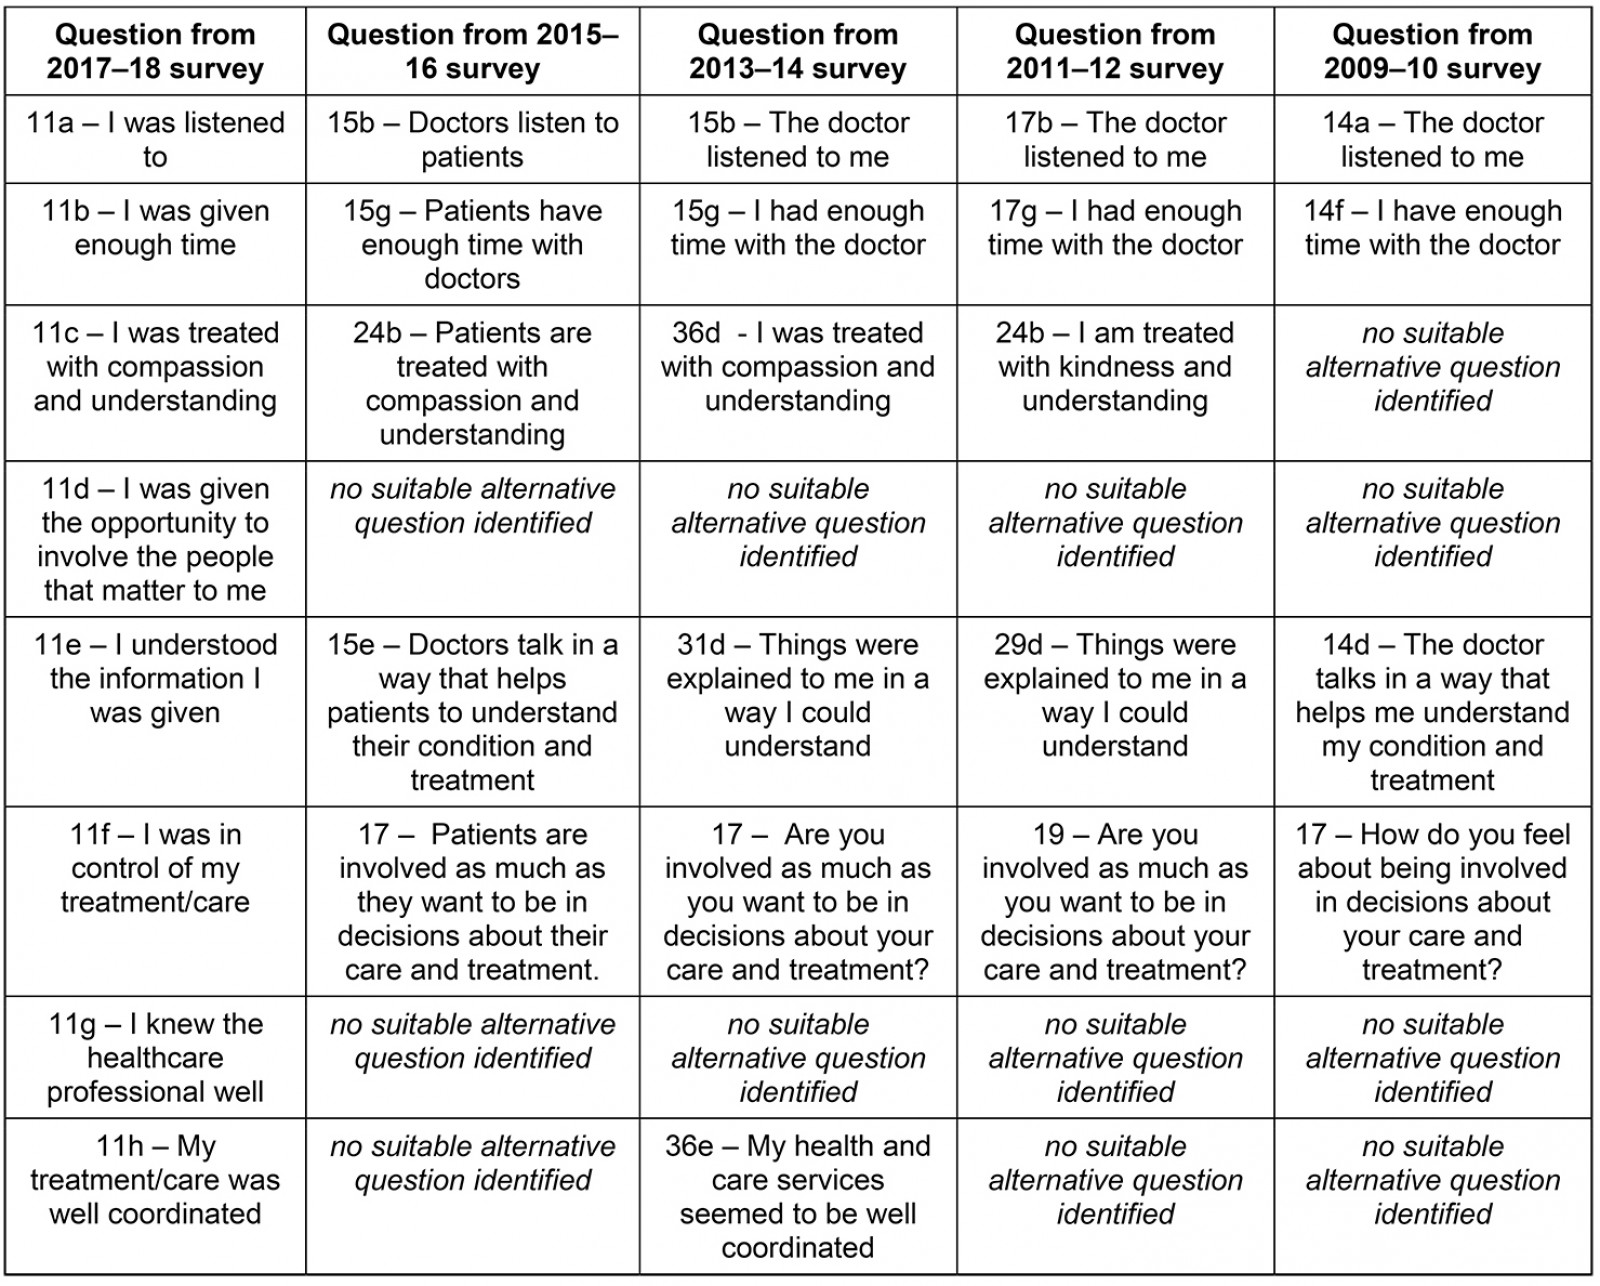
Appendix II: Number of surveys sent out, surveys returned completed and percentage of overall response rates based on survey year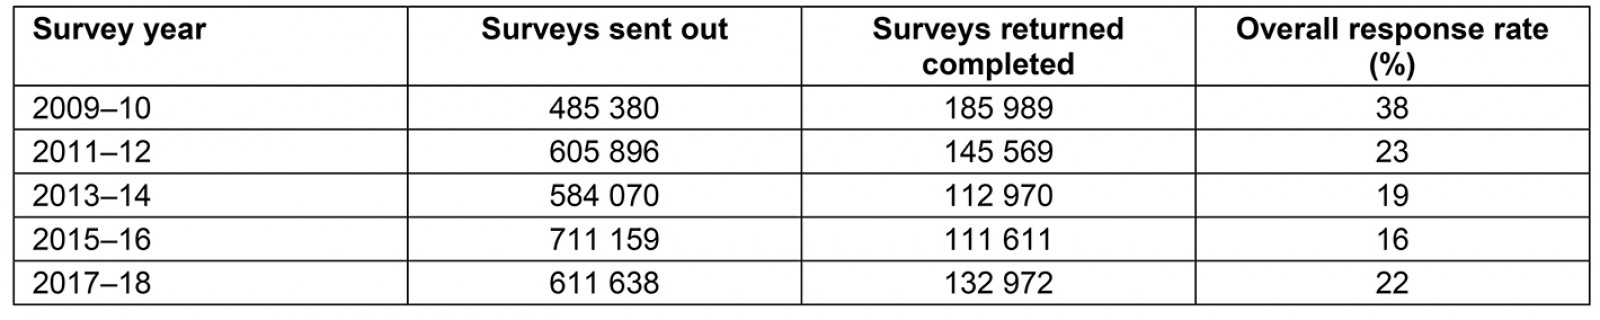
Appendix III: Percentage of response rates for each survey based on Scottish sixfold urban/rural (UR6) classification†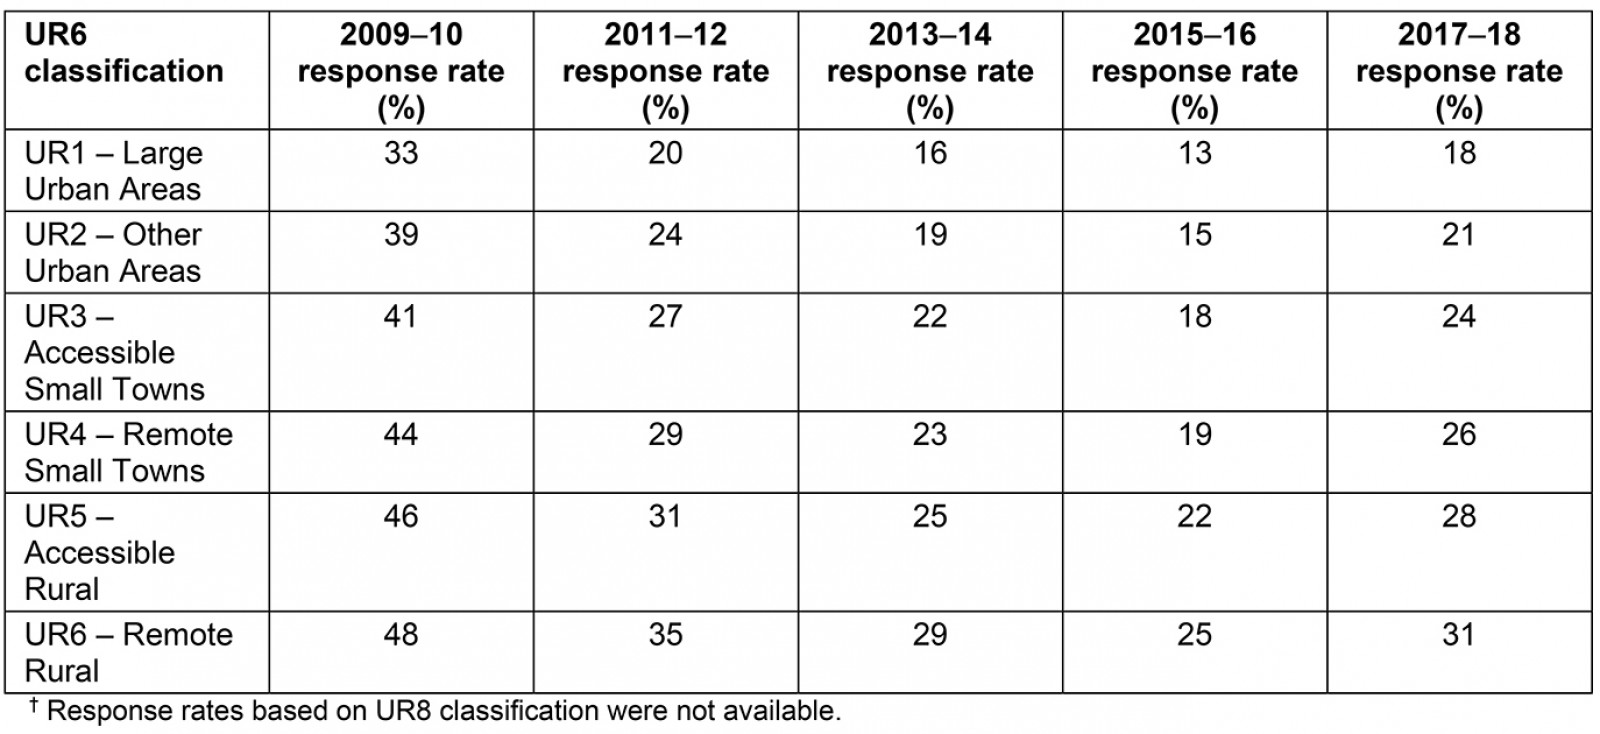
Appendix IV: Questions from 2009-10, 2011-12, 2013-14 and 2015-16 surveys matched to 2017-18 survey based on similarity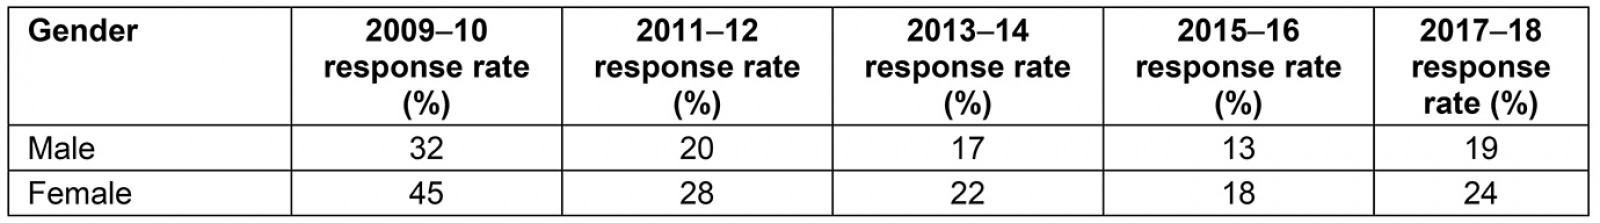
Appendix V: Percentage of response rates for each year of survey based on age group†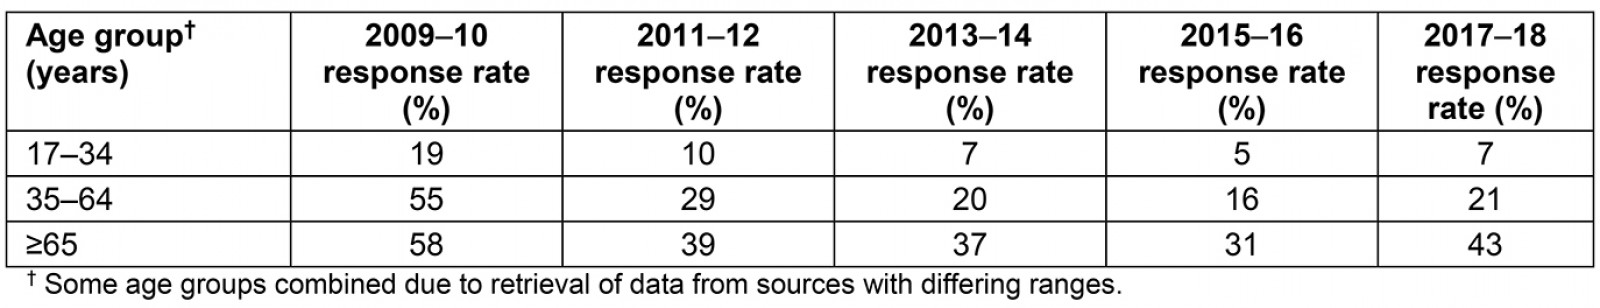
You might also be interested in:
2019 - Satisfaction and limitation of primary health care nurses' work in rural areas
2005 - Rural nursing unit managers: education and support for the role