Introduction
'Men's health' has not shared the same high public profile as the women's health movement has enjoyed since the 1970s. In fact, no clear definition of 'men's health' exists. Existing discourses around men's health refer to greater risk-taking behaviour, the social construct of masculinity and differences between men's and women's rates of death and disease1. These ways of describing 'men's health' may be inadequate, but many men, particularly rural men, experience health disadvantage1.
'Rurality' can be described by using the 'Remoteness Structure', which is based on the Accessibility/Remoteness Index of Australia (ARIA), developed by the Australian Department of Health and Ageing. ARIA measures the remoteness of a point, based on the road distances to the nearest town (service centre) in each of five population size classes. The principles underpinning ARIA are that larger towns have more services than small towns, and that remoteness is a factor of distances travelled to obtain services2.
Overall standardized death rates are higher in rural, regional and remote areas than in metropolitan areas, and more people outside metropolitan areas are hospitalised for diabetes and its complications3. Rural dwellers in Tasmania, especially men, have been shown to have a much higher prevalence of risk factors for cardiovascular disease, than those living in urban areas4.
The social experiences of men and women influence health attitudes, beliefs and behaviours, which in turn impact on health outcomes and longevity5,6. There is evidence to suggest that males who adopt more traditional masculine roles are less receptive to health promotion messages and more involved in health-risk behaviours5. Men attend doctors less often and are less likely than women to report efforts aimed at improving their health7-9. Hegemonic masculinity requires men to deny vulnerability, to be in emotional and physical control and to dismiss any need for help6. O'Hehir et al10 speculate that the myths of masculinity, such as 'men don't cry', the mateship myth and 'she'll be right mate', are stronger among rural men than their city counterparts, as they are expected to be tougher, given the problems of social and physical isolation and the financial pressures from unemployment and recurrent poor seasons. Symptoms have to be life threatening before rural men utilise health services11.
Positive body image has been established as important in women's health and well-being12, while comparable data on male body image is limited. Body image has been investigated in male triathletes, surf lifesavers and body builders, all of whom express a need to have a physical presence13. Drummond suggests that men of larger physical size are perceived as strong and powerful, traditional masculine qualities13. If men wish to be large, efforts to reduce weight to conform to healthy weight ranges could be wasted. However, it is first necessary to investigate the perceptions of body image among other populations of men; in this instance, rural men.
No published studies exclusively examine the eating behaviours of Australian rural men. Woodward and colleagues' Tasmanian study did not establish any rural-urban differences14, while the NSW Health survey of 200415, Queensland Cancer Risk Study16 and National Nutrition Survey (NNS)17 each found men had lower fruit and vegetable intakes than women, and that the intake of fruit by rural NSW men was even lower than that of urban males. The 2004 NSW Health Survey found that the proportion of men who drank alcohol daily was 5% higher in rural areas compared with urban areas15. There are no Australian data specifically on the physical activity habits of rural men. It is commonly believed, despite a paucity of evidence, that rural men, particularly farmers, do more physical activity than those living in metropolitan areas.
This study aims to determine the reported eating, drinking and exercise behaviours of rural men, and the extent to which identified attitudes to health and body image were held by men from rural south western New South Wales. It also aims to assess the relationships between lifestyle behaviours and attitudes to health and body image, and the demographic variables, age and occupation.
Method
Overview of study design
Qualitative and quantitative methods were used to examine the attitudes of a sample of Australian rural men to health and body image and their eating and physical activity behaviours. Focus group discussions with rural men were recorded, summarised, and the data used to develop a survey instrument to assess rural men's attitudes to health and lifestyle behaviour18. The level of significance for the quantitative analyses was 5%.
Procedure
A self-administered questionnaire was mailed to 2000 Australian men randomly selected from the electoral roll for the Farrer and Riverina federal electorates in rural New South Wales (NSW) in June 2004. There were no incentives or reminder notifications. The electorates cover much of south western NSW, including the Murray and Murrumbidgee River regions, and the cities of Albury, Griffith, and Wagga Wagga. The major employers for men are the agricultural, manufacturing, retail and wholesale trade, construction, government administration, defence and service industries19. The vast majority of people living in these two electorates are close to major centres and live in inner and outer regional areas20.
The names and addresses of 250 men from each of the five-year age categories between 25 and 64 years were supplied by The Australian Electoral Commission. The instrument was pilot tested with 12 men within the required age group prior to mail out.
Measures
Demographics: The survey requested details of year of birth, marital status, postcode of residence, and self described occupation. The Australian Standard Classification of Occupations (ASCO), a skill-based system, was used to classify occupations. ASCO has nine major occupation groups, ranging from 'managers and administrators' (with farmers classified as managers) to 'labourers and related workers'21.
Current health behaviours: Men were asked to indicate their alcohol consumption and physical activity habits. The questions about alcohol used a quantity-frequency method as described in A guide to Australian alcohol data22 and the physical activity questions were adapted from the Pilot Survey of Fitness of Australians23.
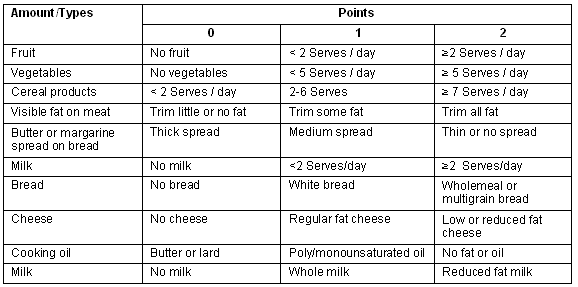
The men were also asked to report their average food intake over the past 6 months using an adaptation of the Food Habit Score of Milligan24. This instrument combines 10 food consumption variables into a numerical measure of diet quality (Table 1). Each variable was scored from 0 to 2, giving a possible total of between 0 and 20. A higher score indicated a more desirable eating pattern. The Food Habit Score allowed for half points; when two categories were ticked, the score was the average of the two (eg eating both white and wholegrain breads gave a score of 1.5).
Although this measure of diet quality has not been validated, similar designs have been used by the Australian Institute of Health and Welfare25 and by Kennedy et al in the USA26, and it conforms to the Australian Dietary Guidelines27. The men were provided with sample serving sizes in accordance with the Australian Guide to Healthy Eating to assist with accuracy28.
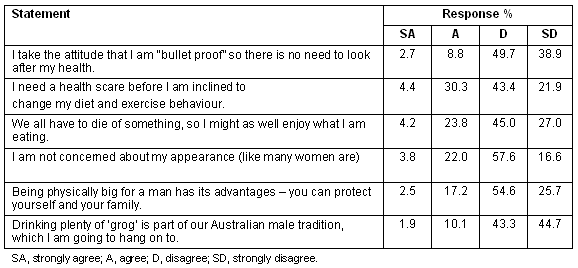
Attitudes to health and body image: The questionnaire used a forced response 4 point scale ranging from 'strongly agree' to 'strongly disagree', for a series of attitudinal statements on health and body image. These statements, given in Table 6, were adapted from responses in the focus groups, wherever possible using their exact phrasing18.
Table 1: The Food Habit Score system
Analysis
Current alcohol consumption and physical activity behaviours were determined from reported frequency counts, and eating behaviours from the Food Habit Score. Each food group within the food habit table was also analysed separately. Statements about attitudes to health and body image, age and occupation was then cross-tabulated against the Food Habit Score (in two groups, ≤10 and ≥10.5-20), types of physical activity and quantity and frequency of alcohol use to test for relationships between health behaviours and attitudes and demographic variables, using the Pearson's c2 test for statistical significance.
Test-retest reliability of survey components
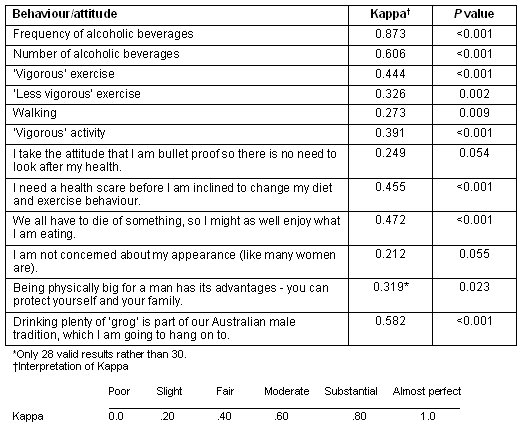
A second survey was sent to a subset of 50 men, 3 weeks after the initial survey mail out, to assess the test-retest reliability of the Food Habit Score, alcohol consumption, the physical activity measures and attitudes to health and body image. Cronbach's alpha was used for the normally distributed values in the Food Habit Score, and Kappa for the categorical data in the alcohol consumption, physical activity and attitudinal measures.
Ethics approval
Ethics approval was obtained from the Charles Sturt University Human Ethics Committee and ratified by the University of NSW Human Ethics Secretariat.
Results
Respondent profile
The response rate was 27%, based on the return of 529 completed questionnaires. Twenty of the questionnaires were ineligible because the recipient's age was outside the defined age range. An additional 43 questionnaires were returned because the addressee was no longer at the address.
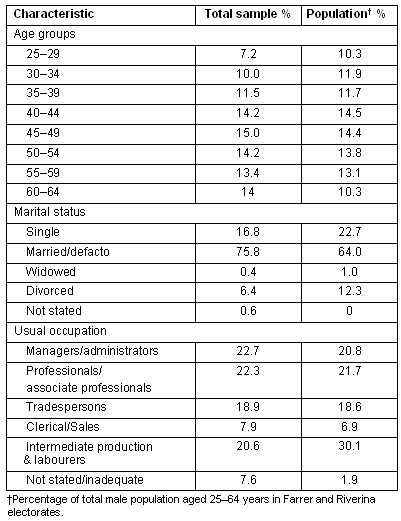
A profile of the survey respondents is presented in Table 2. They appear reasonably representative of the Farrer and Riverina electorates' adult male population, with the exception that younger men were under-represented in the study sample, while the oldest age group was over-represented29. There were also more married men and fewer divorced men than could be expected, and the occupational category of intermediate production and labourers was under-represented in this study30.
Table 2: Profile of survey respondents (n = 529)
Current health behaviours
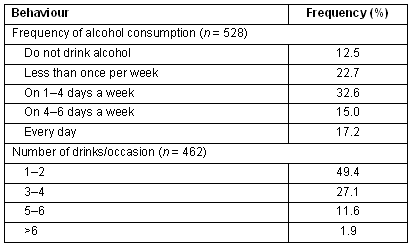
Drinking alcohol: One-eighth of the group reported themselves to be non-drinkers of alcohol. Among the 462 who stated they drank alcohol, almost half consumed only one or two alcoholic drinks at each session. However, almost a quarter of the men reported that they had more than four drinks on each drinking occasion. There was a trend indicating that those who drank more frequently also had more alcohol at each session, but this did not reach significance (p = 0.055). Information about these behaviours can be found in Table 3.
Table 3: Current drinking behaviours of survey respondents. Frequency of alcohol consumption (n = 528)
Physical activity: Physical activity habits are recorded in Table 4. Almost half the respondents reported no vigorous activity, a similar number did none or very little physical activity for recreation or sport, however almost 42% of the men reported doing vigorous activity three or more times per week, including heavy gardening, labouring work or chopping wood. Overall, 3.2% of men reported doing no physical activity, and a further 13% of men reported participating in physical activity less than three times per week.
Table 4: Current average physical activity behaviours over the previous 6 months by survey respondents

Eating habits: Eating behaviours of the respondents were examined in two ways. First, the types and frequency of major food groups consumed were recorded as a point score (Table 5). Second, the individual Food Habit Scores were totalled to provide an overall score of each man's diet.
Table 5: Current food habits of survey respondents: scores for each section of the Food Habit Score
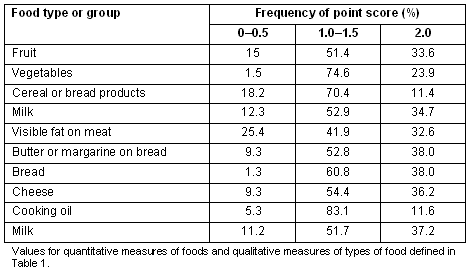
Over one-third of the men consumed little or no margarine or butter on their bread. However, low fat milk or cheese, were unpopular options, and only one-quarter removed the fat from their meat. The men were more likely to consume vegetables than fruit, with 70% of the men having at least 2 to 4 serves of vegetables per day, but approximately 15% stating they consumed no fruit (Table 5). Almost 70% of the men 'passed' (>10/20) on the Food Habit Score, but less than 10% scored over 15. The mean Food Habit Score across all age groups was 12.
Attitudes to health and body image
Only 12% of the men agreed that 'drinking plenty of "grog" [alcohol] is an Australian male tradition'. However, almost 35% of the respondents stated they needed a health scare to change their diet and exercise behaviours; and more than a quarter felt they 'had to die of something, so they might as well enjoy what they are eating'. According to almost 20% of the men, there were advantages in being physically big, 'because they could protect themselves and their family'. Most of them, however, were concerned about their appearance, with approximately 75% of the respondents disagreeing or strongly disagreeing with the statement, 'I am not concerned about my appearance (like many women are)' (Table 6). There were 8 men (1.5%) who strongly agreed/agreed with each attitudinal statement, and no men who disagreed/strongly disagreed with every statement.
Table 6: Attitudes of survey respondents to matters of health and body image (n = 522)
Cross tabulations were performed to assess associations between the respondents' health behaviours and attitudes to health and body image. Those with lower Food Habit Scores were significantly more likely to: (a) consider themselves as 'bullet-proof' (p < 0.001); (b) need a health scare before changing lifestyle (p < 0.001); (c) be content to enjoy themselves 'as we all have to die of something' (p < 0.001); (d) be unconcerned about their appearance (p < 0.001); (e) see 'bigness' as advantageous (p = 0.036); and (f) consider heavy grog consumption as part of the male tradition (p < 0.001).
All levels of physical activity showed a significant inverse association with the attitude 'you have to die of something, so might as well enjoy eating' (vigorous exercise p = 0.04; less vigorous exercise, p = 0.03; walking, p = 0.014; vigorous activity p = 0.021). Those who considered themselves 'bullet-proof' were significantly less likely to do any form of recreational physical activity (vigorous exercise, p = 0.021; less vigorous exercise, p = 0.038; walking, p = 0.004) although this attitude was not significantly related to the frequency with which they engaged in heavy lifting or labouring work. Whether or not they believed in the Australian male drinking tradition and the advantages of being physically large did not have a significant association with physical activity habits.
There was a statistically significant relationship between the attitude 'drinking plenty of grog is part of our Australian male tradition, which I am going to hang on to' and the frequency with which the men consumed alcohol (p< 0.001). The association between this same attitude to health and the number of alcoholic beverages consumed was also highly significant (p< 0.001). There was also a significant association between the number of drinks consumed and the attitude 'I need a health scare before I am inclined to change my eating and exercise behaviour' (p = 0.040).
Associations between the respondents' health behaviours and the two demographic variables of age and occupation were also assessed. There were no significant differences between the older and younger men in terms of diet quality (p = 0.160). However, with increasing age, the men were less likely to do vigorous exercise (p<0.001) and older men were significantly more likely than younger men to drink more frequently (p = 0.005), but to drink fewer alcoholic drinks at each session (p = 0.009). There was a strong and positive association between the men's occupation and the quality of their diet, with managers and professional men (including farmers), significantly more likely to have a healthy diet than men involved in labouring or transport (p = 0.003). Men in higher skilled occupations were also significantly more likely to drink fewer alcohol drinks at a session (p<0.001), but did not drink alcohol less frequently. For physical activity, the only significant and negative association was between the men's occupation and vigorous activities, such as labouring or heavy gardening. In this instance, the higher skilled workers were less likely to be involved in regular vigorous activity than the less skilled workers (p = 0.001).
Test-retest reliability
Test-retest reliability of a subset of 30 men (60% response rate) was 0.87 (p<0.001) for the Food Habit Score. The results of the categorical data can be found in Table 7. There was excellent agreement for drinking frequency; substantial agreement for the number of alcoholic drinks consumed; moderate agreement for vigorous exercise and half of the attitudinal statements. For the remainder of the behaviours and attitudes, there was only fair agreement for the test-retest reliability31. Ten of the 12 items were significant to at least p<0.05.
Table 7: Test-retest reliability of alcohol, physical activity and attitude questions
Discussion
This study aimed to assess the current eating, drinking and physical activity behaviours of a sample of rural men, and to ascertain their attitude towards matters of health and body image. The findings suggest that these rural men have relatively poor eating, drinking and physical activity habits.
Comparing the eating, drinking and physical activity behaviours of this sample with similar studies is not possible, due to the lack of data within Australia and beyond on the lifestyle habits of rural men. Hence, comparisons can only be made with studies that combine data from rural and urban men, or a distillation of surveys that combine data for men and women residing in both urban and rural areas.
The Riverina men received a mean Food Habit Score of 12/20, close to that achieved by urban and rural men in the Western Australia (WA) study (Food Habit Score of 12.4/20)32. However, nearly half the men in the WA survey ate seven or more serves of breads and cereals; while approximately 11% of the men in the current study ate this quantity. The men from the WA study were more likely trim their meat, with over half of the men eating lean meat, while only one-third of the men in this study reported this practice31. Overall, the vegetable intake of the respondents in this survey was comparable with the men from the 2001 National Health Survey33 (NHS), but better than that achieved by men in the Queensland Cancer risk study, where only 10.2% met recommended intakes16. However, proportionally fewer men in the current study ate two or more serves of fruit (34%) than those men in the cancer risk study (40.2%)16 and the NHS study (47%)33. Rates of consumption of alcohol were similar to those reported in the Queensland survey16, but double those in the NNS17. Age was not significantly associated with diet quality in this survey, but older men drank significantly more frequently than the younger men, although fewer alcoholic beverages at each session. The men in higher skilled occupations had a better diet quality than those from lower skilled occupations. Crawford and Baghurst's study found that those from 'low occupational status' tend to be less worried about their nutrient intakes, which is congruent with these findings34.
Physical activity levels of the respondents were unsatisfactory, with 16.2% of men doing insufficient activity to confer any health benefit; that is, less than at least 30 min moderate physical activity on 5 days per week35. However, this was a better result than that achieved in the Queensland cancer risk study, where 38.1% of men had insufficient levels of physical activity16. Further, a much higher percentage of men in the current survey did vigorous activity (eg heavy gardening/labouring work) at least three times per week, compared with approximately 13% of men in the national physical activity study of 199935. This may reflect the type of work rural men undertake, compared with urban men. However, there is a need for caution in making direct comparisons between the current survey and the national survey because over 20% of men in this study were lower skilled workers, compared with 8.5% in the national physical activity study33. The higher participation in vigorous activity may simply reflect the higher proportion of lower skilled workers represented in this study.
The men in this study held a number of less desirable attitudes to health and body image. Not one respondent disagreed with all of the attitudinal statements. Approximately one-third of them needed a health scare before they were inclined to change diet and physical activity patterns; approximately one in four cared little about their appearance and thought that they have 'to die of something, so they might as well enjoy what they are eating'; and 20% held the view that 'being physically big for a man has its advantages'. About 12% of the men intended to continue 'drinking plenty of grog' and a similar proportion took the attitude that they were 'bullet-proof' and did not need to look after their health. Incorporating attitudes to food and exercise into this survey was based on the hypothesis that attitudes can affect behaviour. This survey found that the men who held these attitudes were significantly more likely to have a poorer diet. The associations between attitudes and physical activity were less clear, but in some cases the men who agreed with many of the attitudes described were less likely to be active.
The finding that only a quarter of the men are not concerned about their appearance is not consistent with other findings. Harris, cited in Lee and Owens36, maintains that while men recognise a discrepancy between actual and ideal appearance, they are not concerned about it. There were also 20% of the men in this study who agreed that 'being physically big for a man has its advantages', supporting the cultural norm that men, especially rural men, are supposed to be large and strong. Interestingly, work done by Raudenbush and Zellner37 found that almost 42% of men in the healthy weight range wanted to be heavier. It would have been interesting to know the weight range of the men in this survey who agreed with the above statement.
A major strength of this study was the initial use of qualitative methods to allow rural men to construct their own meaning of attitudes to health and body image18. Using the men's own words contributed to the content validity of the survey instrument38. The test-retest reliability of the survey instrument showed moderate agreement and statistically significant results in most areas, even though the physical activity measures and some of the attitudinal measures did not show strong agreement for test-retest reliability. Burns and Grove38 suggest that it may not always be justifiable with attitudinal factors to assume that an attitude does not change between the two measurement periods. Perhaps the very receipt of this survey prompted a change in attitude in some respondents. However, the change in attitude was not reflected in all attitudinal statements, so there may be factors peculiar to these statements that set them apart from the others.
Another strength of the study was the stratified random sampling used for the questionnaire distribution. Stratified random sampling ensured that adequate numbers of participants in each age group were sampled. Similar to this study, Gannon39 found that the younger age-groups had a higher proportion of non-responders, as did those who were single. It would be reasonable to assume that more of the younger men in this study were also single, contributing to the poorer response rate.
Limitations
The low response rate (27%) limits the findings. However, this response rate is typical for survey instruments mailed to strangers, especially with no reminders or incentives. Even when there is at least one follow-up request, response rates are usually 30-40%40. It is acknowledged that, follow up with survey recipients using the Dillman method, with postcards and then a further complete survey set, would have been preferable41. Therefore, there are reservations in generalising these results to the overall male population in the Riverina and Farrer federal electorates in south-western NSW. However, the sample was reasonably representative of this population and this research exclusively of rural men's eating, drinking and physical activity behaviours, their beliefs about their adherence or otherwise to healthy lifestyle behaviours and their attitudes to matters of health, is unique in Australia.
A reasonable assumption is that respondents to this survey have a greater interest in health than non-responders. Given that the diet, drinking and physical activity habits of the respondents were well short of ideal, and their attitudes to health were cause for concern, this is a likely to be an underestimation of even poorer results. This suggests there is urgent need to find ways to improve the dietary and physical activity habits of rural men.
A further limitation was the presentation of the attitudinal statements with the 'virtuous' attitudes requiring a verdict of disagree or strongly disagree each time. A better questionnaire design would have alternated 'virtuous' responses between strongly agree/agree and disagree/strongly disagree.
While it could be argued that further statistical analyses could have been conducted, this was a descriptive study with no attempt to draw inferences. However, most p values were highly significant (p<0.001). There was no Bonferroni correction undertaken to control for the multiple comparisons but given the level of significance was 5%, this was not an issue for most comparisons.
Useful information from this preliminary study can provide direction for further, more comprehensive studies of rural men's eating, alcohol use and physical activity habits. Future research also needs to gain a deeper understanding of their attitudes to health and body image, and whether these attitudes impact on lifestyle behaviours as this study suggests. This information will assist health professionals to deliver improved health promotion messages and education for this hard to reach group.
Conclusions
The current study has provided a rare insight into the lifestyle behaviours of a sample of rural men and their attitudes to health. It has highlighted that these rural men have poor dietary habits and do little vigorous physical activity, but are more likely to participate in heavy labouring activity. Nearly a quarter of the men reported that they had more than four drinks on each drinking occasion. It also examined some of the attitudes to diet and physical activity that are predictive of poor lifestyle behaviours. For instance, one-third of the participants believed that they need a health scare to initiate change in their eating and physical activity behaviours; they like to maintain the Australian male drinking tradition, and see advantages in being physically big.
Acknowledgements
The research team acknowledges the support of a Charles Sturt University seeding grant to undertake this project. Thanks to Dr Rodney Pope of CSU for his encouragement and suggestions on improving the manuscript.
References
1. Schofield T, Connell RW, Walker L, Wood JF, Butland DL. Understanding men's health and illness: a gender-relations approach to policy, research and practice. Journal American College Health 2000; 48: 247-256.
2. Australian Bureau of Statistics. National regional profile: explanatory notes. Canberra, ACT: ABS, 2006. Available: http://www.abs.gov.au/AUSSTATS/abs@.nsf/Latestproducts/1379.0.55.001Explanatory+Notes12000-2004?opendocument&tabname=Notes&prodno=1&issue=2000-2004&num=&view=& (Accessed 13 August 2007).
3. National Rural Health Policy Forum. Healthy horizons: a framework for improving the health of rural, regional and remote Australian. Canberra, ACT: Australian Government Publishing Service, 1999.
4. Thomson A, Rundle S, Singh BB, Watts R, Sexton P, Woodward D. Regional differences in cardiovascular risk factor prevalence in Tasmania: are they consistent with the increased cardiovascular mortality? Australian & New Zealand Journal Medicine 1995; 25: 290-296.
5. Milligan R, Huggins A. Men's health - the forgotten issue? Australian Nutrition Foundation's Pabulum Newsletter 1997; 30: 1-2.
6. Courtenay WH. Constructions of masculinity and their influence on men's well-being: a theory of gender and health. Social Sciences and Medicine 2000; 50: 1385-1401.
7. Egger G. Intervening in men's nutrition: lessons for the GutBuster men's 'waist loss' program. Australian Journal of Nutrition and Dietetics 2000; 57: 46-49.
8. Pease B. Men and gender relations. Melbourne, VIC: Tertiary Press, 2002; 60: 108, 116.
9. Australian Medical Association. AMA's position statement on men's health. 2005. (Online) 2005. Available: http://www.ama.com.au/web.nsf/doc/WEEN-6B56JJ (Accessed 20 December 2005).
10. O'Hehir B, Scotney E, Anderson G. Healthy life styles - are rural men getting the message? In: Proceedings: Second National Men's Health Conference. October 1997, Perth, Western Australia. Curtin University of Technology, 1997; 314-315.
11. Buckley D, Lower T. Factors influencing the utilisation of health services by rural men. Australian Health Review 2002; 25: 11-15.
12. O'Dea JA. Self-concept, self esteem and body weight in adolescent females: a three-year longitudinal study. Health psychology 2006; 11: 599-611.
13. Drummond M. Body Image: A Men's Health Issue. In: Proceedings: Second National Men's Health Conference. October 1997, Perth, Western Australia. Curtin University of Technology, 1997; 331-335.
14. Woodward DR, Shaw KN, Rathbone MC, Cumming FJ, Ball PJ, Thomson A et al. Socio-demographic correlates of the consumption of specific foods in a non-metropolitan area of Tasmania. Nutrition & Dietetics 1999; 56: 31-38.
15. Centre for Epidemiology and Research, Population Health Division. NSW Population Health Survey 2004. Sydney, NSW: NSW Department of Health; 2005.
16. DiSipio T, Rogers C, Newman B, Whiteman D, Eakin E, Fritschi L, Aitken J. The Queensland Cancer Risk Study: behavioural risk factor results. Australian & New Zealand Journal Public Health 2006; 30: 375-382.
17. Australian Bureau of Statistics. National Nutrition Survey, Foods Eaten, Australia, Cat no. 4804.0. Canberra, ACT: ABS, 1999.
18. O'Kane G, Craig P, Sutherland D. Riverina Men's Study: an exploration of rural men's attitudes to health and body image. Nutrition & Dietetics 2008; 65: 66-71.
19. Australian Bureau of Statistics. 2001 Census of Population and Housing, (Farrer and Riverina Commonwealth electorates) NSW, Industry of Employment by Age by Sex. Canberra, ACT: ABS; 2006.
20. Australian Bureau of Statistics. National Regional profile: NSW, Murrumbidgee and Murray Statistical Region. Canberra, ACT: ABS; 2006. (Available: http://www.abs.gov.au/AUSSTATS/abs@.nsf/nrpbygeogtype!OpenView&Start=1&Count=1000&Expand=1.1&RestrictToCategory=Main%20Areas#1.1 (Accessed 3 August 2007).
21. Australian Bureau of Statistics. Australian Standard Occupation Classifications, 2nd edn. Canberra, ACT: ABS; 1997.
22. Department of Health and Aging. A guide to Australian alcohol data. Canberra, ACT: AIHW; 2004.
23. Department of the Arts, Sport, the Environment and Territories. Pilot Survey of Fitness of Australians. Canberra, ACT: Australian Government Publishing Service, 1992.
24. Milligan R. Health risk factor profile of Western Australians, the 1995 Western Australian Health Survey, no 11. Perth, WA: Epidemiology and Analytical Services Health Information Centre, Health Department of Western Australia, 1998.
25. Coles-Rutishauser IHE, Penm R. Monitoring food habits and food security: Australia 1995-1996. Canberra, ACT: Australian Institute of Health and Welfare, 1996.
26. Kennedy ET, Ohls J, Carlson S, Fleming K. The Health Eating Index: design and applications. Journal of American Dietetic Association 1995; 95: 1103-1105.
27. National Health and Medical Research Council. Dietary Guidelines for Australian Adults. Canberra, ACT: National Health and Medical Research Council; 2003.
28. Kellett E, Smith A, Schmerlaib Y. The Australian guide to healthy eating. Canberra: ACT: Commonwealth Department of Health and Family Services, 1998.
29. Australian Electoral Commission. AEC roll management system - NSW-production. Age statistics as at 30 November 2004. Canberra, ACT: AEC, 2004.
30. Australian Bureau of Statistics. 2001 Census of Population and Housing Riverina and Farrer (Commonwealth Electoral Divisions) NSW, Occupation - males by age. Canberra, ACT: ABS, 2006.
31. Altman DG. Practical statistics for medical research. London: Chapman & Hall, 1991; 404, 405.
32. Milligan R, Daly A, Codde J. Food habits and diet attributable hospitalisation costs in Western Australia: 1995. WA Health Survey 1995 no.7. Perth, WA: Health Department of WA, 1997.
33. Australian Institute of Health and Welfare. Rural, regional and remote health: Indicators of health. Canberra: AIHW; 2005.
34. Crawford DA, Baghurst KI. Diet and health: a national survey of beliefs, behaviours and barriers to change in the community. Australian Journal of Nutrition and Dietetics 1990; 47: 97-104.
35. Armstrong T, Bauman A, Davies J. Physical activity patterns of Australian adults: results of the 1999 National physical activity survey. AIHW cat. no CVD 10. Canberra, ACT: AIHW; 2000.
36. Lee C, Owens RG. The psychology of men's health. Berkshire, UK: Open University Press, 2002; 58, 59.
37. Raudenbush B, Zellner DA. Nobody's satisfied: effects of abnormal eating behaviours and actual and perceived weight status on body image satisfaction in males and females. Journal of Society Clinical Psychology 1997; 16: 95-116.
38. Burns N, Grove SK. The practice of nursing research: conduct, critique & utilization, 3rd edn. Pennsylvania: WB Saunders, 1997; 327.
39. Gannon MJ, Mothern JC, Carroll SJ. Characteristics of non-respondents among workers. Journal of Applied Psychology 1971; 55: 586-588.
40. Yegidis BL, Weinbach RW. Research methods for social workers, 5th edn. Boston, MA: Allyn and Bacon, 2006; 167.
41. Dillman DA. Mail and internet surveys: the tailored design method, 2nd edn. New York: J Wiley, 2000.
Abstract
Introduction: Discourses around men's health refer to greater risk-taking behaviour, the social construct of masculinity and differences between men's and women's rates of death and disease. These ways of describing 'men's health' may be inadequate, but many men, particularly rural men, experience health disadvantage.
Method: A written postal survey was used to collect demographic data, eating behaviours using the Food Habit Score, alcohol use, physical activity behaviours using an adaptation of the Pilot Study of the Fitness of Australians and attitudes to health and body image. Subjects and Setting: The survey was sent to 2000 randomly selected men in two New South Wales Riverina federal electorates in June 2004, with 529 returns (27% response). Main outcome measures: Food Habit Scores; regularity of physical activity; frequency and amount of alcohol use; degree of agreement with statements about attitudes to health and body image. Statistical analyses: Descriptive statistics using frequencies and cross tabulations were performed with further univariate analyses conducted at a level of significance of 5%.
Results: Approximately one-third of the men achieved a poor Food Habit Score (≤10 out of 20). Age was not significantly associated with diet quality, but those in higher skilled occupations had a better diet, compared with those in less skilled occupations (p<0.01). Eighty-seven percent of the respondents drank alcohol and of those, almost half consumed only one or two alcoholic drinks at each session. Nearly a quarter of the men reported that they had more than four drinks on each drinking occasion. Almost half the men did no 'vigorous' exercise, but 42% did heavy labouring/gardening at least three times a week. The men with poor dietary habits were more likely to agree with less desirable attitudes to health, such as needing a health scare before changing lifestyle behaviours (p<0.001). The low response rate (27%) limits the ability to generalise these results to the whole male population in the Farrer and Riverina federal electorates.
Conclusion: This study describes the eating and physical activity behaviours of a sample of rural men and highlights the attitudes that are associated with poor lifestyle behaviours among this hard to reach group. Implications: Health promotion programs targeting men, especially rural men, should address existing attitudes to health which may impact on lifestyle behaviours.
Key words: Australia, attitudes, food habits, health beliefs, men's health, physical activity, rural men.
You might also be interested in:
2005 - Retaining rural medical practitioners: Time for a new paradigm?

