


Introduction
Approximately one-fifth of the population of Aotearoa New Zealand (NZ) population lives in rural areas1. When people who live in these rural areas require hospital treatment, roughly half will present to a rural hospital in the first instance2. An agreed international definition of a rural hospital does not exist; however, geographical location, long travel distance to urban hospitals, generalist practice and limited access to specialist services are factors used to identify NZ rural hospitals2-4. Compared with hospitals in major urban areas, rural hospitals tend to include catchments that have higher proportions of Māori (NZ’s Indigenous population), people who are older, and people who have higher levels of socioeconomic deprivation2. There is considerable variation in the size, models of care used and resource availability between rural hospitals in NZ1,3-5. Interhospital transfers from rural to urban hospitals are essential and required largely to access diagnostic investigations or specialist care that is unavailable rurally1. All NZ rural hospitals are geographically distant from their urban referral hospitals, requiring 45 minutes to 4.5 hours of road travel to reach the nearest referral hospital1,5. While interhospital transfers are vital for safe and effective patient care, there are many associated challenges including cost and time constraints, multiple or out-of-region transfers, separation of patients from their community and social supports, transport difficulties and the potential for patient harm1,5.
The Geographic Classification for Health (GCH) categorises geographical areas of NZ into one of five rural–urban categories (U1, U2, R1, R2 and R3), from major urban areas (U1) to the most rural areas (R3), for health research and policy purposes. The use of this taxonomy has recently unmasked worse health outcomes for rural NZ6,7. Higher rates of amenable mortality (potentially preventable deaths given effective healthcare delivery in people younger than 75 years) and lower rates of healthcare utilisation for rural dwellers compared with those who live in urban areas have been demonstrated, particularly for Māori, who are more likely than non-Māori to live in NZ’s most rural areas2,4,8. These findings rely on clinical information within NZ’s routinely collected datasets. NZ has a single public healthcare system that assigns a unique identifier to every health service user, allowing NZ’s well-maintained national administrative health datasets to be linked. Clinical information is coded using the International statistical classification of diseases and related health problems, 10th revision, Australian modification (ICD-10-AM)9, and then stored in the datasets. Accurate clinical coding is essential for the interpretation and validity of analyses, including rural–urban differences in health outcomes2,4,8. Anecdotally, clinical coding is often performed by clinicians or reception staff without formal coding training in many NZ rural hospitals10. However, in urban NZ clinical coding is performed by a designated hospital clinical coding team with university or subtertiary coding training who read patient discharge notes and assign corresponding ICD-10-AM diagnosis codes11,12. No NZ literature was found comparing the accuracy of clinical coding between rural and urban hospitals, and studies from comparable international health systems are scarce, dated or inconclusive2,4,8,13-22. This study aimed to determine whether any discrepancies existed between the primary diagnosis codes assigned in the National Minimum Dataset (hospital events) (NMDS) for patients who underwent an interhospital transfer from a rural to an urban hospital.
Methods
This was a retrospective observational study of all patients who underwent an interhospital transfer from a publicly funded NZ rural hospital to an urban hospital between 1 January 2015 and 31 December 2019.
Setting
Publicly funded NZ hospitals were classified into three hospital categories: rural hospitals, hospitals in small urban centres and hospitals in large urban centres (Table 1). The classification is consistent with recent NZ literature2,10.
Rural hospitals were categorised based on the Medical Council of New Zealand definition: features of NZ rural hospitals include substantial geographical distance to reach urban and specialist healthcare services, a generalist workforce, and offering acute and inpatient care with limited specialist care1-3,5. Hospitals in small urban centres were grouped due to their location in smaller regional cities (U2), and their ability to offer some specialist-level care while still experiencing resource constraints. Hospitals in large cities (U1), typically with ready access to tertiary or subspecialist level care, were classified as hospitals in large urban centres6,10.
Table 1: Classification of New Zealand publicly funded hospitals into rural hospitals, hospitals in small urban centres and hospitals in large urban centres
| Group | Hospitals | |
|---|---|---|
| Rural hospitals | Ashburton; Bay of Islands; Buller Health (Westport); Clutha Health First; Dannevirke Community; Dargaville; Dunstan; Golden Bay Community Health; Gore; Hawera; Hokianga Health – Rawene Clinic; Kaikoura; Kaitaia; Lakes District; Maniototo Health Services; Oamaru; Reefton Health Services; Taumarunui Community; Taupo; Te Kuiti Community; Te Nikau Grey; Te Whare Hauora O Ngati Porou – Te Puia Springs; Thames; Tokoroa; Wairoa Hospital and Health Centre | |
| Urban hospitals | Hospitals in small urban centres | Gisborne; Hawkes Bay; Nelson; Palmerston North; Pukekohe; Rotorua; Southland (Kew); Taranaki Base; Timaru; Wairarapa (Masterton); Wairau (Blenheim); Wanganui; Whakatane; Whangarei |
| Hospitals in large urban centres | Auckland City; Auckland Spinal Rehabilitation Unit; Burwood; Christchurch; Dunedin; Ellesmere; Hutt; Kenepuru; Middlemore; North Shore; Tauranga; Waikato; Waitakere; Wakari; Wellington | |
Participants
All patients who presented to a rural hospital and were transferred to a publicly funded urban hospital in NZ between 1 January 2015 and 31 December 2019 were included. Patients were excluded if they presented to or were transferred to a primary birthing unit, private hospital, mental health facility, aged care or inpatient palliative care unit, or if no facility was assigned. Additionally, patients were excluded if clinical discharge information from either the rural or the urban hospital was unavailable. A formal sample size was not obtained and a power calculation was not performed as all patient records in the allotted time period were included.
Data sources and data collected
The NMDS of hospital discharges, which is maintained by Te Whatu Ora (Health NZ) and Manatū Hauora (NZ Ministry of Health) was used as the data source for this project. The NMDS is a routinely collected administrative dataset that records patient discharge information from both NZ public and private hospitals23. Demographic information and clinical data (coded using the ICD-10-AM) are stored for each patient discharge event. Each discharge event has a primary (principal) diagnosis code relevant to the presenting complaint, and up to 98 secondary diagnosis codes for associated findings24. The primary diagnosis is defined as ‘the diagnosis established after study to be chiefly responsible for the episode of care’24. Only the ICD-10-AM codes for the primary diagnosis were used for this study.
Transfers were identified by bundling related discharge events in the NMDS into healthcare encounters25. Consecutive events where the discharge and admission dates were less than one day apart were grouped together. NZ’s publicly funded hospitals were identified in the NMDS using their New Zealand Ministry of Health (Manatū Hauora) assigned facility code (Appendix I). Hospitals were subsequently categorised based on the groupings defined in Table 1: rural, small urban and large urban.
Patient demographic information collected from the NMDS included date of birth, sex at birth (male or female), prioritised ethnicity, domicile code, and event end date and time for health encounters. Age at discharge as both a continuous variable and a 5-year group was derived using each patient’s date of birth and discharge date24. In the NMDS, patients can identify as more than one ethnicity, so a prioritisation process was used26. Where a patient’s recorded ethnicity in any of the three fields included Māori, they were categorised as Māori. All other patients, including those with missing data in all three ethnicity fields, were categorised as non-Māori26.
Patients were assigned to one of five GCH categories: three rural categories (R1, R2, R3) and two urban categories (U1, U2). The domicile:GCH concordance file was used to match each patient’s domicile code (a small area measure associated with the patient’s National Health Index and address) to the GCH category6. The NZDep2013 is a composite measure of socioeconomic deprivation ranging from decile 1 to decile 10. It combines variables from the 2013 Census to reflect relative socioeconomic deprivation per geographic area of the NZ population. Decile 1 reflects the 10% of the NZ population who live in areas classified as having the least relative socioeconomic deprivation, and decile 10 reflects the areas with the highest levels of socioeconomic deprivation27. Each patient’s domicile code was used to determine the NZDep2013 decile using a concordance file27. NZDep2013 was further categorised into quintiles, with quintile 1 containing the areas with the least socioeconomic deprivation (deciles 1 and 2) and quintile 5 the most (deciles 9 and 10).
The ICD-10-AM primary diagnosis codes assigned at the rural and urban hospitals for the same patient health encounter were also collected from the NMDS. One of 15 corresponding diagnosis groups such as ‘respiratory system’ or ‘musculoskeletal and rheumatological’ based on the WHO chapter definitions was assigned to each ICD10-AM code28. The ‘other’ category was used where an ICD-10-AM category did not map to a diagnosis group and largely contained the code prefixes R (‘symptoms, signs and abnormal clinical and laboratory findings, not elsewhere classified’), U (‘codes for special purposes’), and Z (‘factors influencing health status and contact with health services’). A list of the ICD-10-AM codes included for each diagnosis group is provided in Appendix II.
Outcomes
The primary outcome measure was the percentage of discrepancies between the clinical diagnosis codes assigned in the NMDS for patients who underwent an interhospital transfer from a rural to an urban hospital. A secondary objective was to identify the clinical conditions in which these discrepancies occurred.
Data analysis
All data management and analysis was performed in R v4.3 (R Foundation for Statistical Computing; https://www.R-project.org) using the R-Studio Integrated Development Environment29,30.
Where the facility codes in the first event of an encounter matched that of a rural hospital, and the subsequent event contained a facility code for an urban hospital, the primary diagnosis codes were compared. Where multiple interhospital transfers occurred, only the first transfer between a rural and urban hospital was considered.
The number and percentage (with a 95% confidence interval (95%CI)) of encounters where there was a discrepancy between the primary diagnosis codes from the rural and urban hospitals were calculated. Analysis was performed separately for clinical codes and within the broader diagnosis groups. Subgroup analysis was performed for transfers between rural hospitals and hospitals found in small urban (U2) and large urban (U1) areas.
The frequency and percentage of the common conditions that contributed to the discrepancies between the rural and urban hospitals were also calculated. The 95%CIs were estimated using the ‘exact’ method in the ‘prop.tests’ package in the R package31.
Uncertainty was assessed using 95% confidence intervals rather than formal statistical tests (eg χ2 or Mann–Whitney U-test). This approach provided a more intuitive measure of precision that clearly communicates the plausible range of values.
Ethics approval
Ethics approval for this study was sought and approved by the University of Otago Human Ethics Committee (reference HD19/069).
Results
There were 260,525 admissions to rural hospitals for 146,623 patients between 1 January 2015 and 31 December 2019. Of these admissions, 31,691 (12.2%), for 27,264 patients, resulted in an interhospital transfer from a rural to an urban hospital. There were 18,326 (57.8%) transfers to a hospital in a large urban centre, and 13,365 (42.2%) transfers to a hospital in a small urban centre. The mean age of transferred patients was 53.6 years (standard deviation (SD) 25.2 years), approximately half of the patients were female (51.9%), and one-quarter were Māori (25.8%). Most patients who were transferred lived in GCH categories R1 and R2 (86.6%), and areas considered to have high levels of socioeconomic deprivation (quintiles 4–5, 65.0%) as shown in Table 2.
Table 2: Characteristics of patients who presented to a rural hospital and were transferred to an urban hospital†
| Characteristic |
Overall |
Referral hospital classification | ||
|---|---|---|---|---|
|
Large urban |
Small urban |
|||
| (31,691 admissions) | (18,326 admissions, 57.8%) | (13,365 admissions, 42.2%) | ||
| Age (years) | Mean±SD | 54±25 | 56±24 | 51±26 |
| <5 |
1747 (5.5) |
810 (4.4) | 937 (7.0) | |
| ≤16 |
2859 (9.0) |
1394 (7.6) | 1465 (11.0) | |
| 17–64 |
15,348 (48.4) |
8556 (46.7) | 6792 (50.8) | |
| ≥65 |
13,484 (42.5) |
8376 (45.7) | 5108 (38.2) | |
| Sex | Female | 16,438 (51.9) | 9228 (50.4) | 7210 (53.9) |
| Male |
15,253 (48.1) |
9098 (49.6) | 6155 (46.1) | |
| Ethnicity | Māori | 8161 (25.8) | 3311 (18.1) | 4850 (36.3) |
| Non-Māori |
23,530 (74.2) |
15,015 (81.9) | 8515 (63.7) | |
| Geographical Classification for Health | U1 | 1359 (4.4) | 976 (5.4) | 383 (2.9) |
| U2 |
556 (1.8) |
189 (1.0) | 367 (2.8) | |
| R1 |
12,890 (41.4) |
7659 (42.3) | 5231 (40.1) | |
| R2 |
14,103 (45.2) |
8617 (47.6) | 5486 (42.0) | |
| R3 |
2263 (7.3) |
675 (3.7) | 1588 (12.2) | |
| (Missing) |
520 |
210 | 310 | |
| NZDep2013 measure | Quintile 1 | 2429 (7.8) | 1626 (9.0) | 803 (6.2) |
| Quintile 2 |
2965 (9.5) |
1749 (9.7) | 1216 (9.4) | |
| Quintile 3 |
5494 (17.7) |
3625 (20.1) | 1869 (14.4) | |
| Quintile 4 |
8322 (26.8) |
5619 (31.1) | 2703 (20.8) | |
| Quintile 5 |
11,850 (38.2) |
5438 (30.1) | 6412 (49.3) | |
| (Missing) |
631 |
269 | 362 | |
† Over the study period, 3289 patients had at least two admissions that resulted in an interhospital transfer. Each admission was included and therefore these patients may appear more than once. SD, standard deviation.
Results by clinical code
Overall, there were discrepancies in 64.1% (20,303/31,691; 95%CI 63.5–64.6%) of the primary diagnosis codes assigned between the rural and urban hospitals (Table 3). Discrepancies existed in 67.5% (9021/13,365; 95%CI 66.7–68.3%) of the primary diagnosis codes assigned for patients who were transferred to a hospital in a small urban centre, and in 61.6% (11,282/18,326; 95%CI 60.9–62.3%) of the primary diagnosis codes assigned for patients who were transferred to a hospital in a large urban centre.
Results by diagnosis group
There were discrepancies in 32.1% (10,168/31,691; 95%CI 31.6–32.6%) of the assigned diagnosis groups between rural and urban hospitals (Table 3). For transfers to hospitals in small urban centres, there were discrepancies in 34.2% (4576/13,365; 95%CI 33.4–35.1%) of the diagnosis groups, and in 30.5% (5592/18,326; 95%CI 29.8–31.2%) of the diagnosis groups for transfers to hospitals in large urban centres.
Table 3: Discrepancies in primary diagnosis clinical codes and diagnosis groups assigned in the National Minimum Dataset at rural hospitals compared to all urban, small urban centre and large urban centre hospitals
| Code/group | For transfers to all urban hospitals (31,691 admissions) | For transfers to hospitals in small urban centres (13,365 admissions) | For transfers to hospitals in large urban centres (18,326 admissions) | |
|---|---|---|---|---|
| Primary diagnosis clinical codes |
Discrepancies, n, %, 95%CI |
20,303 64.1 (63.5–64.6) | 9021 67.5 (66.7–68.3) | 11,282 61.6 (60.9–62.3) |
|
Concordance, n, %, 95%CI |
11,388 35.9 (35.4–36.5) | 4344 32.5 (31.7–33.3) | 7044 38.4 (37.7–39.1) | |
| Diagnosis groups |
Discrepancies, n, %, 95%CI |
10,168 32.1 (31.6–32.6) | 4576 34.2 (33.4–35.1) | 5592 30.5 (29.8–31.2) |
|
Concordance, n, %, 95%CI |
21,523 67.9 (67.4–68.4) | 8789 65.8 (64.9–66.6) | 12,734 69.5 (68.8–70.2) | |
CI, confidence interval.
Secondary outcome
Figure 1 depicts the diagnosis groups that were coded at discharge from the rural hospitals (y-axis) and those groups coded at discharge from the urban hospitals (x-axis) after transfer. The highest rates of clinical coding concordance between rural and urban hospitals occurred for the following diagnosis groups assigned at discharge from the rural hospital: ‘pregnancy, childbirth and the puerperium’ (97.9%), ‘injury related diagnoses’ (92.0%), ‘circulatory diseases’ (82.4%), and ‘digestive system’ (80.3%). Conversely, the diagnosis groups with the highest clinical coding discrepancies were ‘other’ (65.5%), ‘infection’ (56.5%), and ‘nervous system’ (50.2%).
The most frequently assigned diagnosis group at discharge from rural hospitals was ‘other’, constituting 24.4% of all diagnosis groups assigned by a rural hospital. When this was assigned by a rural hospital, it was discordant with the diagnosis group assigned by the urban hospital in 65.5% of healthcare encounters, with 14.5% reassigned to a ‘digestive system’ code and 10.5% to ‘circulatory diseases’.
In 4.8% of all healthcare encounters, a specific diagnosis group assigned on discharge from the rural hospital was subsequently changed to ‘other’ at the urban transfer hospital. For example, 12.7% of encounters coded as ‘nervous system’ by the rural hospitals were reclassified as ‘other’ following transfer to an urban hospital.
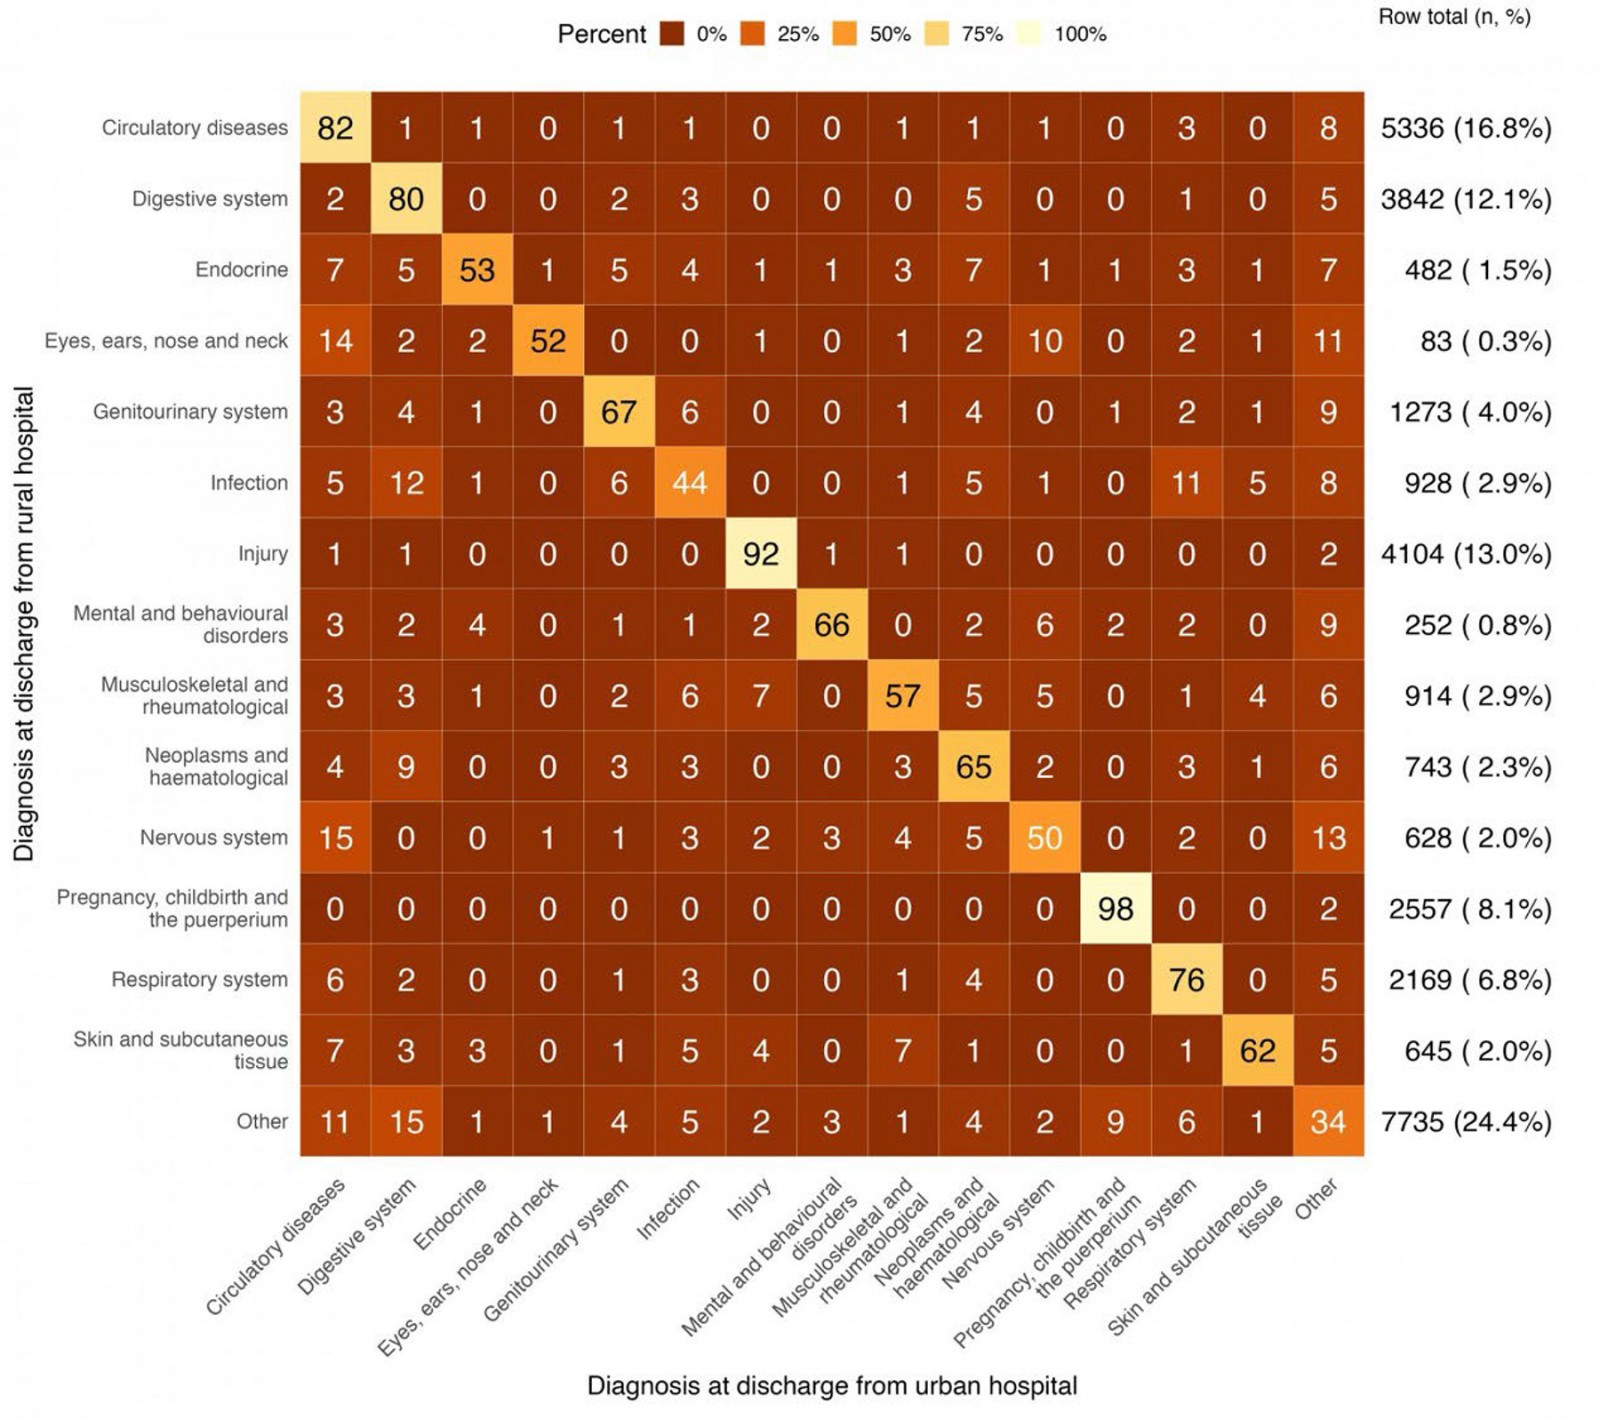 Figure 1: Clinical coding discrepancies by assigned discharge diagnosis groups at publicly funded hospitals in Aotearoa New Zealand between 1 January 2015 and 31 December 2019.
Discussion
Main findings
This study identified discrepancies in approximately two-thirds (64.1%) of the ICD-10-AM primary diagnosis codes assigned in the NMDS between the rural and urban hospitals following interhospital transfer. Discrepancies were found for slightly more patients who were transferred to a hospital in a small urban centre (67.5%) than for patients who were transferred to a hospital in a large urban centre (61.6%). When considered by the broader diagnosis groups, which cluster related ICD-10-AM codes together, 32.1% of the diagnosis groups were different between rural and urban hospitals. Again, there was a higher percentage of discrepancies for transfers to hospitals in small urban centres (34.2%) compared to transfers to hospitals in large urban centres (30.5%).
The diagnosis groups with the lowest rates of clinical coding discrepancies were for ‘pregnancy, childbirth and the puerperium’ (97.9%), ‘injury’ (92.0%), ‘circulatory diseases’ (82.4%) and ‘digestive system’ (80.3%). In these instances, this may be due to the presentation and mechanism of illness being more obvious, earlier in the health encounter, increasing the consistency of the clinical coding between rural and urban hospitals12.
The most frequent primary diagnosis codes assigned by a rural hospital were the group assigned as ‘other’. This group comprised non-specific codes including those attributed to symptoms, signs, and abnormal clinical and laboratory findings. In two-thirds of cases (65.5%) where a primary diagnosis code fell into this group after discharge from a rural hospital, it was reassigned to a more specific diagnosis at the urban hospital. Conversely, a small percentage (4.8%) of admissions were initially assigned to a specific diagnostic group at discharge from a rural hospital and subsequently reassigned to the non-specific ‘other’ at discharge from the urban hospital. While this phenomenon was persistent across all diagnostic groups, this occurred in 13% of patients discharged from a rural hospital with ‘neurological disorders’ and 8% of ‘circulatory diseases’.
Some variability between the primary diagnosis codes assigned at discharge from a rural hospital before transfer and that assigned at discharge from an urban hospital is expected. Compared with urban hospitals, NZ’s rural hospitals have a relative shortage of resources and diagnostic investigations1,9,32. Most lack access to CT scanning and some do not have on-site laboratory services1. In these settings, a non-specific diagnostic code that falls within the ‘other’ group may be used by the rural hospital, which is then changed to better represent that illness or injury after reassessment with the required investigations and the passage of time. Alternatively, a working diagnosis is assigned that is then updated on further review. Variation may also be attributed to a patient’s clinical condition changing over the course of the health encounter13.
No examples in the NZ literature that we were aware of compared the diagnostic codes between rural and urban hospitals using administrative datasets, and only a few studies examined the accuracy of the coding, with mixed results. Clinical audits in Canada and at six small rural hospitals in Australia have shown high levels of accuracy12,14. No significant associations in clinical coding error rates between rural and metropolitan hospitals were demonstrated in Australia, or in North America, with rural hospitals shown to have higher coding accuracy than major urban hospitals13,15,16. In contrast, high levels of coding errors and omissions have been demonstrated in multiple clinical settings within NZ and internationally17-19. High work volume, tight time constraints, inadequate training and workforce shortages may affect coding quality9. These are issues currently faced by NZ rural hospitals, and ICD-10-AM coding that would normally be completed by a dedicated and trained workforce in urban hospitals may be performed by administrative staff that have other duties and lack formal coding training in the rural setting1,6. A lack of trained clinical coders may contribute to the differences between rural and urban hospitals. Intercoder variability has also been demonstrated, even among well-trained clinical coders20,21.
Strengths and limitations
All interhospital transfers from a rural to a publicly funded urban hospital in NZ over 5 years were included in this study, resulting in a large sample size. The use of the NMDS is a particular strength of this study. The NMDS is one of NZ’s largest routinely collected administrative datasets and contains information on all hospital discharge events22,23.
As this was a retrospective observational study and there was no access to the clinical record, the reason for the discrepancies in clinical coding between rural and urban hospitals cannot be determined. The accuracy of clinical coding at NZ rural hospitals is therefore unknown. A study that audits clinical notes to determine the accuracy of coding at both rural and urban hospitals is required to understand this. It is also possible that there was variation in the clinical coding practice within each of the three hospital groups, with larger variation expected in rural hospitals, especially where different clinical groups (eg midwives and doctors) might independently code clinical events.
Only interhospital transfers were considered in this study. It is possible that this unique subset of patients that are managed by both rural and urban hospitals is, by nature, a group with higher degrees of diagnostic uncertainty and might be subject to different coding practices. It is also possible that discrepancies are different across different age groupings, sex and ethnicities. These factors also need further investigation.
This study only used data from the NMDS up to 2019, so it does not account for clinical coding practices at NZ public hospitals since then. Also, any patients who did not have full clinical records or were seen at private hospitals, birthing units, aged care, or mental health facilities were excluded, so important data may have been missed. The effect is probably minimal as, anecdotally, there are few transfers from rural hospitals to these facilities.
Only the first interhospital transfer was examined in this study. Further diagnosis code changes in subsequent intra- or interhospital transfers may have occurred. Additionally, only primary diagnosis codes were considered; using all secondary diagnosis codes, such as is recommended when acute coronary syndrome is the diagnosis of interest, may result in different findings33.
Policy implications
Many population level rural–urban health analyses depend on quality clinical coding within administrative datasets, even though these datasets are rarely collected for research purposes34. If the clinical coding within these datasets is inaccurate, especially if it is more inaccurate at one type of facility, the magnitude and direction of any disparities might be incorrectly reported. This has implications for rural health funding and policy, which often rely on data derived from administrative datasets.
It is important that researchers carefully consider which discharge event the diagnostic code of interest should be taken from. Our study found that in 32.1% of cases, the diagnosis chapter or group changed completely after interhospital transfer. Which event (initial, final or any occurrence of the code(s) of interest within the encounter) is the best or correct might depend on the research questions being asked.
While a focus in NZ has been on improving the rural clinical workforce, it is clearly important to ensure a well-trained administrative workforce (including clinical coders) so that the correct information is entered into administrative datasets35.
A study that includes reviewing the clinical record to determine the accuracy of clinical coding for both rural and urban hospitals is required to understand the findings of this study.
Conclusion
This study demonstrated discrepancies in nearly two-thirds of the primary diagnosis codes assigned between the NZ rural and urban hospitals, and in approximately a third when analysed by broader diagnosis groups. Further investigation is needed into why these differences in clinical coding are occurring.
Funding
This study was supported by a Hauora Taiwhenua Rural Student Research Scholarship and a University of Otago Rural Section Scholarship.
Conflicts of interest
The authors declare no conflicts of interest.
References
appendix I:
Appendix I: New Zealand’s publicly funded hospitals with their Ministry of Health (Manatū Hauora) assigned facility code
| Hospital name | Category | Facility code |
|---|---|---|
| Auckland City | Large Urban | 3260 |
| Christchurch | Large Urban | 4011 |
| Dunedin | Large Urban | 4211 |
| Hutt | Large Urban | 5812 |
| Middlemore | Large Urban | 3214 |
| Nelson | Large Urban | 3911 |
| North Shore | Large Urban | 3215 |
| Tauranga | Large Urban | 4911 |
| Waikato | Large Urban | 5311 |
| Waitakere | Large Urban | 3216 |
| Wellington | Large Urban | 5811 |
| Gisborne | Small Urban | 3411 |
| Hawkes Bay | Small Urban | 3612 |
| Palmerston North | Small Urban | 4311 |
| Rotorua | Small Urban | 5312 |
| Southland (Kew) | Small Urban | 4511 |
| Taranaki Base | Small Urban | 4711 |
| Timaru | Small Urban | 4411 |
| Wairarapa (Masterton) | Small Urban | 5511 |
| Wairau (Blenheim) | Small Urban | 3811 |
| Wanganui | Small Urban | 5711 |
| Whakatane | Small Urban | 3311 |
| Whangarei | Small Urban | 4111 |
| Ashburton | Rural | 3111 |
| Bay of Islands | Rural | 4114 |
| Buller Health (Westport) | Rural | 5918 |
| Clutha Health First | Rural | 8569 |
| Dannevirke Community | Rural | 8561 |
| Dargaville | Rural | 4113 |
| Dunstan | Rural | 5111 |
| Golden Bay Community Health | Rural | 3918 |
| Gore | Rural | 8597 |
| Hawera | Rural | 4712 |
| Hokianga Health - Rawene Clinic | Rural | 4115 |
| Kaikoura | Rural | 4021 |
| Kaitaia | Rural | 4112 |
| Lakes District | Rural | 4513 |
| Maniototo Health Services | Rural | 3722 |
| Oamaru | Rural | 5611 |
| Taumarunui Community | Rural | 4811 |
| Taupo | Rural | 5329 |
| Te Kuiti Community | Rural | 5313 |
| Te Nikau Grey | Rural | 5911 |
| Te Whare Hauora O Ngati Porou – Te Puia Springs | Rural | 8629 |
| Thames | Rural | 5011 |
| Tokoroa | Rural | 5323 |
| Wairoa Hospital and Health Centre | Rural | 3613 |
Codes available from https://www.tewhatuora.govt.nz/for-health-professionals/data-and-statistics/nz-health-statistics/data-references/code-tables/common-code-tables#facility-code-table-download
appendix II:
Appendix II: The ‘chapters’ and their International Statistical Classification of Diseases and Related Health Problems 10th edition (ICD-10) used to classify the primary diagnosis for each admission
| Chapter | ICD code range |
|---|---|
| Infection | A00-B99 |
| Neoplasms | C00-C96, D00-D49 |
| Haematological | D50-D89 |
| Endocrine | E00-E99 |
| Mental and behavioural disorders | F01-F99 |
| Nervous system | G00-G99 |
| Eyes, ears, nose and neck | H00-H99 |
| Circulatory diseases | I00-I99, R074, R073 |
| Digestive system | K00-K00 |
| Skin and subcutaneous tissue | L00-L99 |
| Musculoskeletal and rheumatological | M00-M99 |
| Genitourinary system | N00-N99 |
| Pregnancy, childbirth and the puerperium | O00-P99 |
| Injury† | S00-Y99 |
| Respiratory system | J00-J99 |
| Other | All codes not otherwise assigned |
†Codes associated with injury, poisoning and external causes of morbidity and mortality.
You might also be interested in:
2015 - Free open access medical education can help rural clinicians deliver 'quality care, out there'