


Introduction
Child malnutrition remains a critical global health challenge, disproportionately affecting low- and middle-income countries, where it contributes significantly to morbidity and mortality among children less than age 5 years1. According to recent estimates, approximately 150 million children worldwide suffer from stunting, 50 million from wasting, and 38 million are underweight due to inadequate nutrition and dietary deficiencies2. Malnutrition manifests as undernutrition (stunting, wasting, and underweight) or overnutrition, which is linked to obesity and non-communicable diseases3,4.
In Africa, the burden of child malnutrition remains high, with approximately 61.4 million children aged less than 5 years experiencing stunting and 13.8 million affected by wasting5. The prevalence of undernutrition varies widely across the continent, with Sub-Saharan Africa being the most affected region, where one in three children suffer from stunting. Nigeria bears one of the heaviest burdens of child malnutrition globally, ranking among the top 10 countries with the highest rates of stunting and wasting6. The problem is particularly pronounced in Northern Nigeria, where nearly half of all children aged less than 5 years are affected by chronic malnutrition7. Factors contributing to this crisis include food insecurity, poverty, inadequate maternal nutrition, infectious diseases, and suboptimal feeding practices8. The prevalence of malnutrition varies significantly across regions, with stunting rates exceeding 60% in some northern states, while some southern states report rates as low as 7%2.
Northern Nigeria presents a unique case of child malnutrition due to its complex socioeconomic and geopolitical challenges. The region shares similarities with rural South Asia, parts of Central America, and the Middle East, where malnutrition persists due to a combination of poverty, food insecurity, limited access to health care, and cultural feeding practices9,10. For instance, rural India and Pakistan exhibit high rates of stunting and wasting, exacerbated by gender disparities in nutrition and healthcare access11,12. Similarly, in Afghanistan and Yemen, ongoing conflicts have contributed to food crises, impacting child growth outcomes13. Understanding these parallels is crucial in positioning Northern Nigeria's malnutrition burden within a broader global context.
The emergency nutritional support and short-term interventions have contributed to a reduction in wasting (acute malnutrition). Still, the increase in stunting (chronic malnutrition) suggests that long-term structural issues such as poverty, low maternal education, weak healthcare infrastructure, food insecurity, poor sanitation, and conflict-related displacement remain unresolved. Wasting, characterized by low weight-for-height, is often caused by short-term food shortages, disease, or conflict and can be addressed through immediate feeding programs and medical interventions14. However, stunting, which results from prolonged nutritional deficiencies and socioeconomic disparities, cannot be easily reversed. Studies show that maternal education, food security, and long-term economic stability play crucial roles in reducing stunting15. In countries like Pakistan, Ethiopia, and Guatemala, research indicates that children of illiterate and impoverished mothers are more likely to experience chronic malnutrition despite receiving emergency food aid16. Thus, while short-term nutritional support helps alleviate immediate hunger, addressing stunting requires sustained investments in maternal education, healthcare access, poverty alleviation, and food system improvements17. Without these structural changes, chronic malnutrition will persist, impacting child development and long-term health outcomes.
Recent studies highlight the adverse effects of malnutrition on child health, including impaired cognitive development, increased susceptibility to infectious diseases, and a heightened risk of chronic illnesses in adulthood18. The long-term consequences extend to economic productivity and intergenerational health, as malnourished mothers are more likely to give birth to underweight infants19. Armed conflicts and environmental shocks further exacerbate food insecurity and malnutrition in Northern Nigeria, limiting access to essential health services and nutritious food20. Understanding the evolving trends in child malnutrition, along with its determinants, is critical for formulating effective policies and interventions to combat this crisis21.
This study, therefore, aimed to explore the trends and determinants of child malnutrition in Northern Nigeria from 2013 to 2018. By analyzing data from the Nigeria Demographic and Health Survey (NDHS), the research sought to provide insights into the prevalence of stunting, wasting, and underweight among children aged less than 5 years and to identify the underlying factors contributing to these conditions. Additionally, the study intended to position its findings within the broader context of rural malnutrition in low-resource settings, drawing comparisons with similar contexts to inform internationally relevant interventions.
Methods
Research design
This study employed a cross-sectional design to examine the evolving trends and determinants of child malnutrition among children aged less than 5 years in Northern Nigeria. By analyzing secondary data from the 2013 and 2018 NDHS, the study captured changes over this period.
Sampling technique and population
The study focuses on children aged less than 5 years residing in Northern Nigeria, encompassing the North Central, North East, and North West regions. The NDHS utilizes a two-stage stratified cluster sampling method. Initially, each state (including the Federal Capital Territory) is stratified by urban and rural areas. Subsequently, clusters (enumeration areas) are selected using the latest census data, followed by systematic household selection within each cluster. This approach yielded a representative sample for the region. Detailed descriptions of the sampling procedure are available in the NDHS reports22,23.
Data source and collection
Data for this research were obtained from the NDHS datasets for 2013 and 2018. These nationally representative datasets provide extensive information on child health, including anthropometric measurements and household characteristics such as regional area, place of residence, education level, mother's occupation, wealth index, household number of children, child’s sex, child’s age, child’s size at birth, birth type (single or multiple) and birth order. Anthropometric data, such as weight, height, and age, were collected using calibrated instruments and processed into Z-scores for weight-for-age, height-for-age, and BMI-for-age according to WHO standards. In this study, stunting, underweight, and wasting are defined as Z-scores less than –2 for height-for-age, weight-for-age, and BMI-for-age, respectively. Additionally, household data were extracted from the datasets for further analysis.
Data analysis
Data analysis was performed using Statistical Package for the Social Sciences v28 (IBM Corp; https://www.ibm.com/products/spss-statistics). Summary measures, including mean Z-scores for weight-for-age, height-for-age, and BMI-for-age, were computed to assess the overall nutritional status of the child population. Logistic regression analyses were conducted to evaluate the associations between independent variables (eg maternal education, child's age, socioeconomic status) and the dependent variable (child malnutrition). The relationships are presented as odds ratios (OR) with 95% confidence intervals (CI), and statistical significance was established at p<0.05.
Handling of missing data
The analysis was conducted on a complete-case basis for each variable. For variables with missing observations, such as mother's occupation and child size at birth, the denominators used for percentage calculations were based on the number of valid (non-missing) responses. This approach is noted in the footnotes of the corresponding tables.
Ethics approval
This study utilized secondary data from the NDHS. Authorization to access and use the NDHS dataset was sought from and granted by the DHS Program. All analyses strictly adhered to ethical guidelines for secondary data usage, ensuring confidentiality, data integrity, and compliance with established research ethics standards.
Results
Sociodemographic characteristics of mother–child pairs in Northern Nigeria
The sociodemographic characteristics of the 39,720 mother–child pairs are shown in Table 1. The data were drawn from two survey years: 2013 (47.6%) and 2018 (52.4%). The study population was distributed across three major regions: North Central (24.4%), North East (31.1%), and North West (44.5%). A significant majority (75.8%) of participants resided in rural areas. Educational levels among mothers were low, with 63.4% having no formal education. Among the 32,262 mothers who provided information on their occupation, the most common category was clerical & sales (45.3%), followed by not working (20.3%). The wealth index showed notable disparities, with 31.7% of households classified as poorest. Most families had one or two children (62.0%). The sex distribution of children was nearly equal (50.2% male). Among the 39,509 children with available data on birth size, 44.7% were reported as average size. Regarding multiple births, 97.5% were single births. Birth order analysis showed that 65.7% of children were firstborns.
Table 1: Household characteristics of mother–child pairs in Northern Nigeria, 2013 and 2018 Nigeria Demographic and Health Survey (N=39,720)
| Characteristic | Variable |
Frequency (N=39,720) |
Percentage (%) |
|---|---|---|---|
| Year | 2013 | 18,902 | 47.6 |
| 2018 |
20,818 |
52.4 | |
| Region | North Central | 9689 | 24.4 |
| North East |
12,337 |
31.1 | |
| North West |
17,694 |
44.5 | |
| Place of residence setting | Urban | 9620 | 24.2 |
| Rural |
30,100 |
75.8 | |
| Education level | No formal education | 25,175 | 63.4 |
| Primary |
6068 |
15.3 | |
| Secondary |
6802 |
17.1 | |
| Higher |
1675 |
4.2 | |
| Mother’s occupation† | Not working | 6541 | 20.3 |
| Professional |
1024 |
3.2 | |
| Clerical or sales |
14,632 |
45.3 | |
| Agriculture |
5478 |
17 | |
| Manual work |
3184 |
9.9 | |
| Others |
1403 |
4.3 | |
| Wealth index | Poorest | 12,587 | 31.7 |
| Poorer |
11,203 |
28.2 | |
| Middle |
7750 |
19.5 | |
| Richer |
5122 |
12.9 | |
| Richest |
3058 |
7.7 | |
| Household number of children | 1 or 2 | 24,623 | 62.0 |
| 3 or 4 |
12,089 |
30.4 | |
| ≥5 |
3008 |
7.6 | |
| Child’s sex | Male | 19,956 | 50.2 |
| Female |
19,764 |
49.8 | |
| Child’s current age (years) | <1 | 8500 | 21.4 |
| 1–2 |
15,339 |
38.6 | |
| 3–4 |
15,881 |
40.0 | |
| Child’s size at birth† | Don’t know | 267 | 0.7 |
| Small |
5915 |
15.0 | |
| Average |
17,662 |
44.7 | |
| Large |
15,665 |
39.6 | |
| Birth type (single or multiple) | Single | 38,711 | 97.5 |
| Multiple |
1009 |
2.5 | |
| Birth order | First | 26,108 | 65.7 |
| Second |
11,996 |
30.2 | |
| Third or more |
1616 |
4.1 |
† Data were missing for the variables of mother’s occupation (n=7458; 18.8% missing) and child’s size at birth (n=211; 0.5% missing). Percentages for these variables were calculated based on the number of valid responses and adjusted for rounding where necessary. All other variables had complete data.
Patterns of nutritional status among children in Northern Nigeria (2013 and 2018)
Figure 1 shows the trends in malnutrition patterns among children in Northern Nigeria between 2013 and 2018. The prevalence of stunting increased significantly from 39.4% in 2013 to 44.7% in 2018 (χ²=59.613; p<0.001). Conversely, wasting had a marked decline from 17.0% in 2013 to 8.1% in 2018 (χ²=326.743; p<0.001). Similarly, underweight malnutrition decreased from 30.0% in 2013 to 27.5% in 2018 (χ²=14.939; p<0.001).
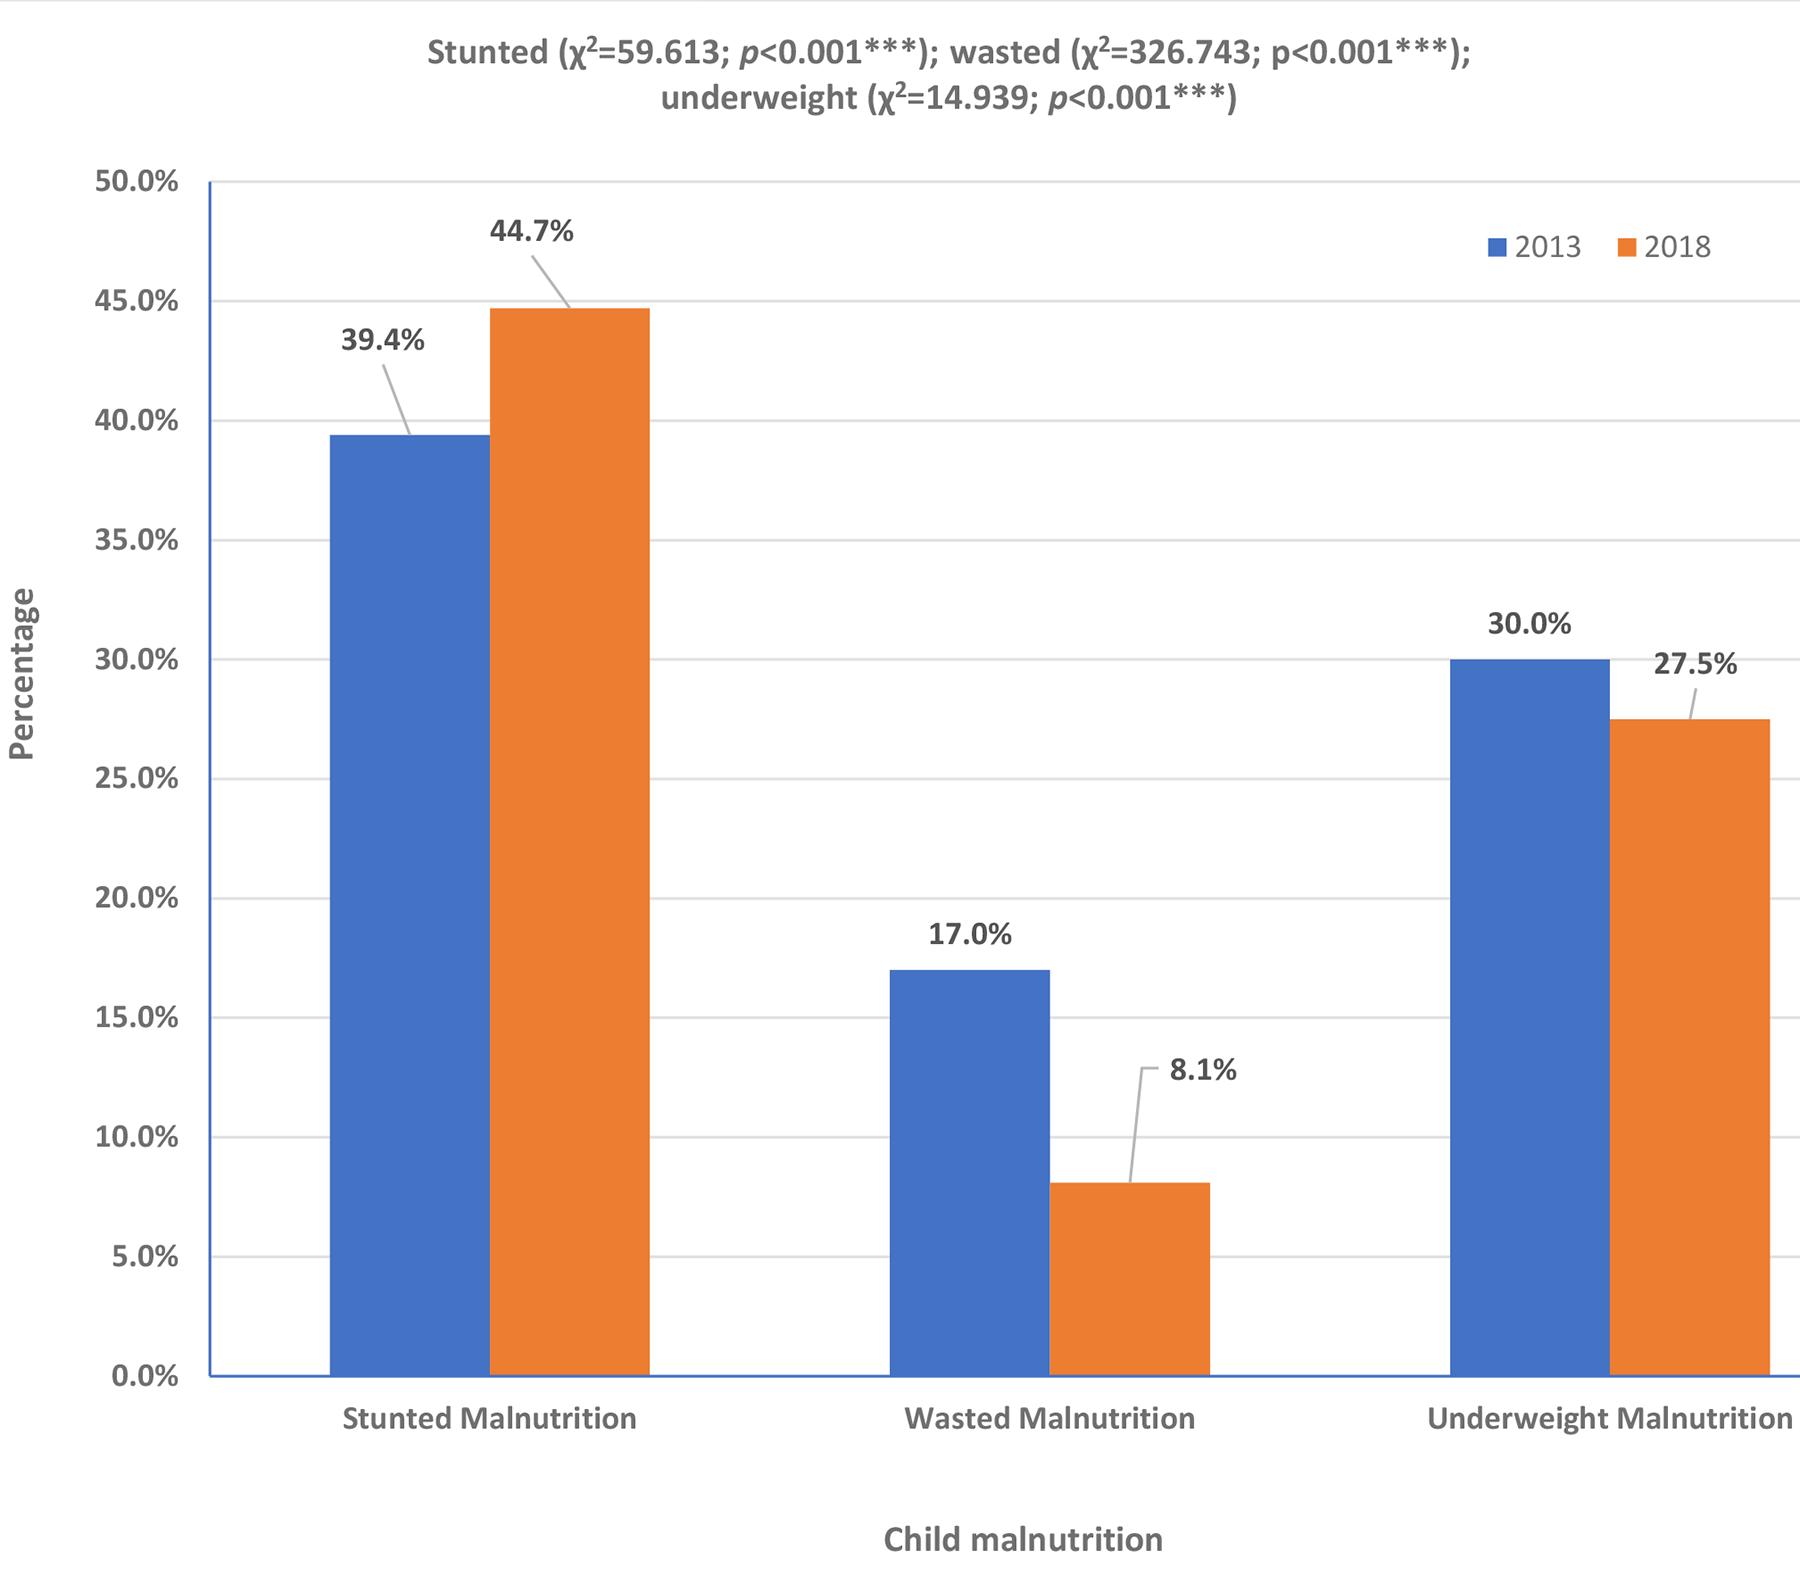 Figure 1: Pattern of nutritional status/malnutrition among children in Northern Nigeria, 2013 and 2018 Nigeria Demographic and Health Survey. (***p<0.001)
Prevalence of stunting, wasting and underweight malnutrition among children in Northern Nigeria (2013 and 2018)
Figure 2 illustrates the prevalence of three types of malnutrition among children in Northern Nigeria for the years 2013 and 2018. Regarding stunting, a marker of chronic malnutrition, 59.2% of children were classified as normal, while 40.8% were stunted. In terms of wasting, which indicates acute malnutrition, 85.5% of children were within the normal range, with 14.5% experiencing wasting. Similarly, for underweight malnutrition, reflecting general malnutrition, 70.7% of children were considered normal, and 29.3% were malnourished.
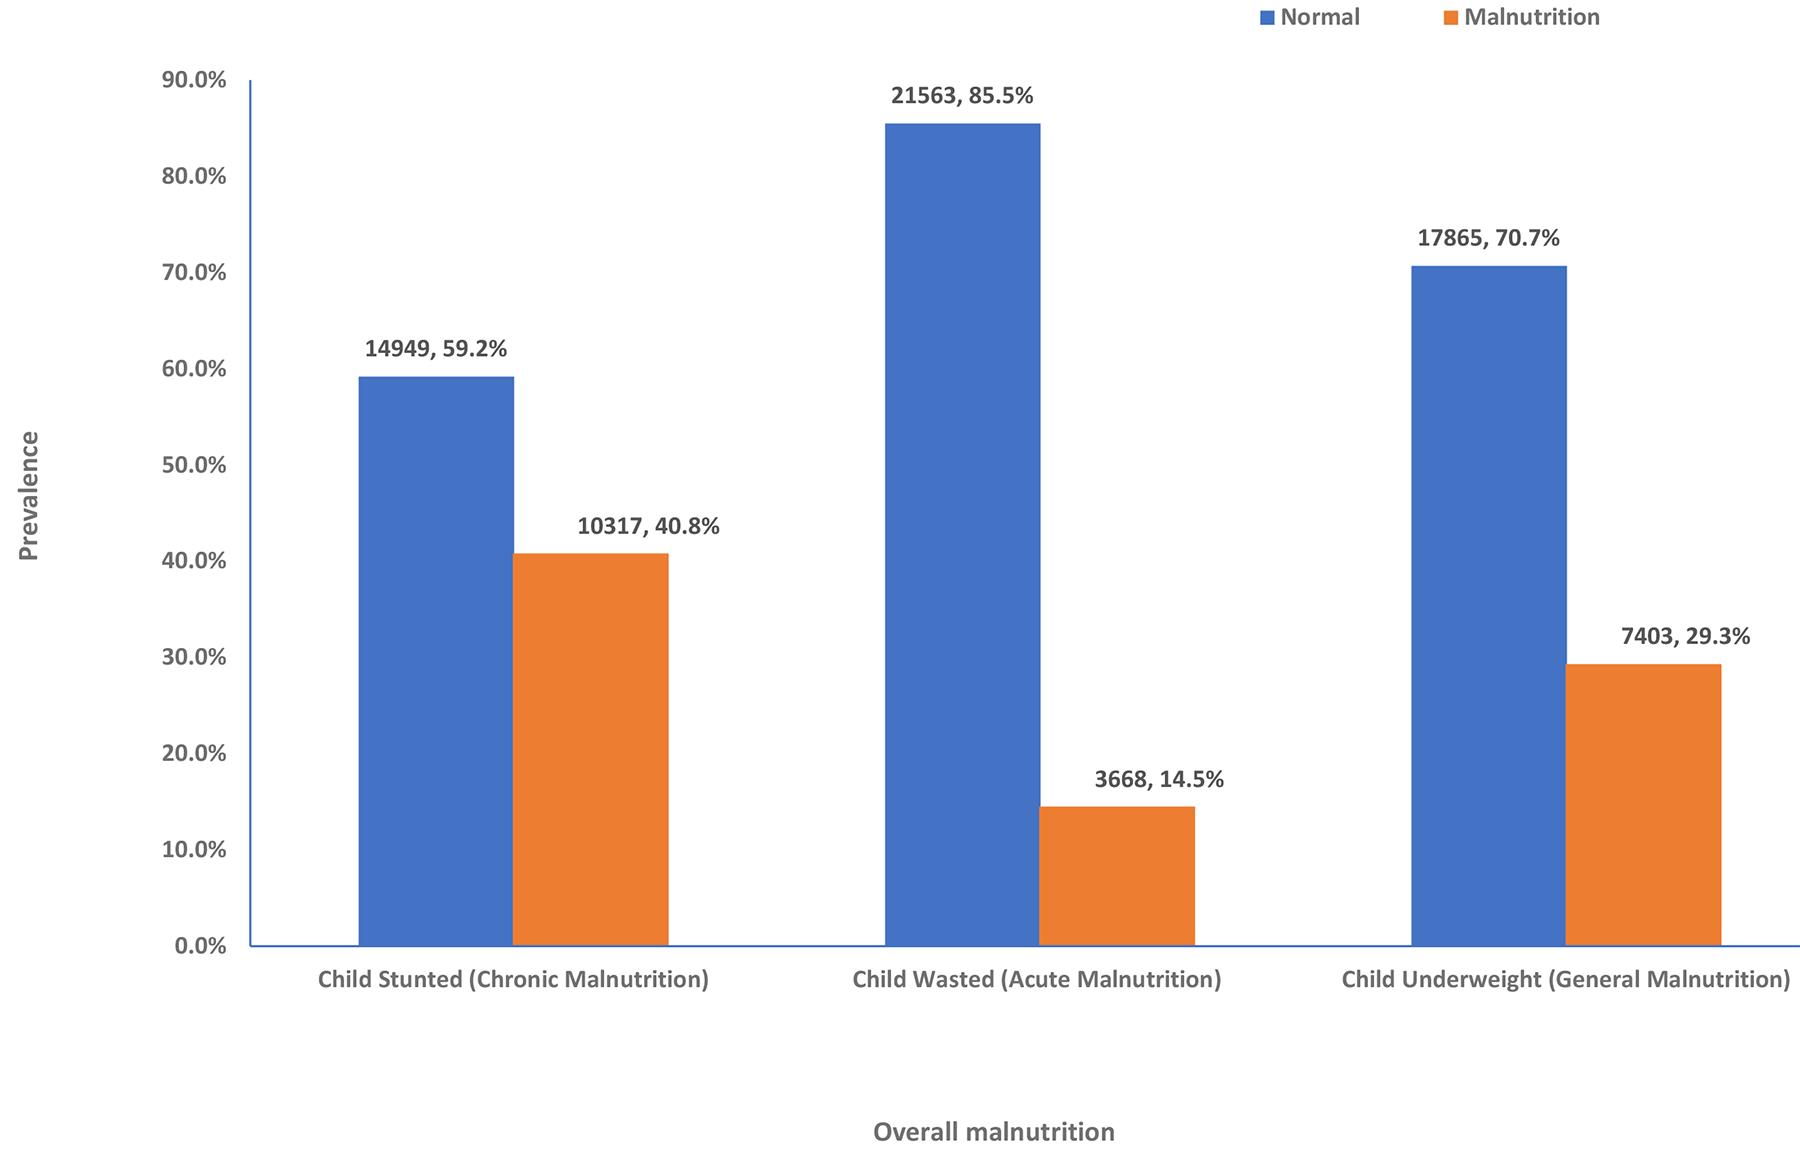 Figure 2: Prevalence of stunting, wasting and underweight malnutrition among children in Northern Nigeria, 2013 and 2018 Nigeria Demographic and Health Survey.
Factors associated with malnutrition among children in Northern Nigeria
Table 2 shows the factors associated with malnutrition. The prevalence of child malnutrition in Northern Nigeria was high, with 40.8% of children classified as stunted, 14.5% as wasted, and 29.3% as underweight. These figures indicated widespread malnutrition. Significant regional disparities were found, with the North West exhibiting the highest burden across all three indicators (p<0.001). Children in rural areas exhibited a higher prevalence of stunting (43.8%) and underweight (30.8%) compared to their urban counterparts (p<0.001). Maternal education level was strongly associated with nutritional outcomes: among mothers with no formal education, 46.1% of children were stunted, compared to 16.4% of children with mothers with higher education (p<0.001).
The household wealth index was another significant determinant. Children from the poorest households experienced the highest prevalence of stunting (48.9%), wasting (16.0%), and underweight (31.2%) (p<0.001 for all). As wealth status improved, malnutrition rates declined. Sex differences in malnutrition were significant, with male children being more affected by stunting, wasting, and underweight than females (p≤0.001). Age was a critical factor: stunting rates increased from 21.7% in infants aged less than 1 year to 46.3% in children aged 3–4 years. Birth size was also strongly associated with nutritional status: children born small exhibited the highest rates of stunting (44.6%), wasting (18.4%), and underweight (36.3%) (p<0.001).
Table 2: Factors associated with malnutrition among children in Northern Nigeria, 2013 and 2018 Nigeria Demographic and Health Survey
| Characteristic | Variable | Stunting | Wasting | Underweight | |||
|---|---|---|---|---|---|---|---|
|
n (%) |
2 (p-value) |
n (%) | χ2 (p-value) | n (%) | χ2 (p-value) | ||
| Child malnutrition | 10,317 (40.8) | – | 3668 (14.5) | – | 7403 (29.3) | – | |
| Year | 2013 | 7187 (39.4) | 59.613 (<0.001***) | 3105 (17.0) | 326.743 (<0.001*) | 5477 (30.0) | 14.939 (<0.001***) |
| 2018 |
|
563 (8.1) | 1926 (27.5) | ||||
| Regional area | North Central | 1661 (26.9) | 781.130 (<0.001***) | 542 (8.8) | 289.591 (<0.001***) | 968 (15.7) | 947.144 (<0.001***) |
| North East |
|
1062 (13.7) | 2150 (27.8) | ||||
| North West |
|
2064 (18.2) | 4285 (37.7) | ||||
| Place of residence setting | Urban | 1931 (31.6) | 283.011 (<0.001***) | 912 (15.0) | 1.131 (0.288) | 1499 (24.6) | 87.137 (<0.001***) |
| Rural |
|
2756 (14.4) | 5904 (30.8) | ||||
| Mother’s education level | No education | 7442 (46.1) | 743.559 (<0.001***) | 2567 (15.9) | 89.718 (<0.001***) | 5483 (34.0) | 571.341 (<0.001***) |
| Primary |
|
542 (13.3) | 1031 (25.3) | ||||
| Secondary |
|
478 (11.9) | 783 (19.4) | ||||
| Higher |
|
81 (7.9) | 106 (10.3) | ||||
| Mother’s occupation | Not working | 2492 (39.4) | 86.169 (<0.001***) | 1119 (17.7) | 166.32 (<0.001***) | 1898 (30.0) | 174.603 (<0.001***) |
| Others |
|
85 (10.9) | 204 (26.3) | ||||
| Professionals |
|
55 (8.9) | 108 (17.4) | ||||
| Clerical or sales |
|
1419 (15.3) | 2823 (30.4) | ||||
| Agriculture |
|
271 (9.1) | 647 (21.6) | ||||
| Manual work |
|
490 (18.1) | 933 (34.5) | ||||
| Wealth index | Poorest | 3886 (48.9) | 778.129 (<0.001***) | 1268 (16.0) | 31.829 (<0.001***) | 2222 (31.2) | 429.028 (<0.001***) |
| Poorer |
|
1043 (14.7) | 1234 (25.1) | ||||
| Middle |
|
635 (13.0) | 748 (23.1) | ||||
| Richer |
|
471 (14.6) | 348 (17.0) | ||||
| Richest |
|
251 (12.3) | 2222 (31.2) | ||||
| Household number of children | 1 or 2 | 6084 (39.2) | 327.964 (<0.001***) | 2200 (14.2) | 92.409 (<0.001***) | 4324 (27.8) | 429.339 (<0.001***) |
| 3 or 4 |
|
1178 (15.0) | 2498 (31.6) | ||||
| ≥5 |
|
290 (15.8) | 581 (31.6) | ||||
| Child’s sex | Male | 5406 (42.5) | 29.219 (<0.001***) | 1942 (15.3) | 11.620 (0.001***) | 3857 (30.3) | 12.976 (0.001***) |
| Female |
|
1726 (13.8) | 3546 (28.3) | ||||
| Child’s current age (years) | <1 | 1216 (21.7) | 1083.055 (<0.001***) | 1089 (19.5) | 271.687 (<0.001***) | 1273 (22.7) | 180.151 (<0.001***) |
| 1–2 |
|
1589 (16.0) | 3280 (32.9) | ||||
| 3–4 |
|
990 (10.2) | 2850 (29.3) | ||||
| Child’s size at birth | Don’t know | 62 (41.1) | 70.948 (<0.001***) | 13 (8.6) | 60.750 (<0.001***) | 29 (19.2) | 202.936 (<0.001***) |
| Small |
|
706 (18.4) | 1397 (36.3) | ||||
| Average |
|
1521 (14.4) | 3279 (31.0) | ||||
| Large |
|
1404 (13.4) | 2631 (25.1) | ||||
| Birth type (single or multiple) | Single | 9996 (40.6) | 27.383 (<0.001***) | 3555 (14.5) | 6.008 (0.014*) | 7153 (29.0) | 33.637 (<0.001***) |
| Multiple |
|
113 (17.9) | 250 (39.7) | ||||
| Birth order | First | 6450 (38.2) | 171.347 (<0.001***) | 2813 (16.7) | 190.308 (<0.001***) | 4966 (29.4) | 9.995 (0.007**) |
| Second |
|
763 (10.3) | 2201 (29.6) | ||||
| Third or more |
|
92 (9.7) | 236 (24.7) | ||||
Source: Demographic Health Survey dataset.
Discussion
This study provided a detailed analysis of the evolving patterns of child malnutrition in Northern Nigeria from 2013 to 2018. By examining a large, representative sample, the research highlighted significant shifts in the prevalence of stunting, wasting, and underweight. The findings elucidated the complex interplay of sociodemographic, economic, and biological factors influencing these nutritional outcomes.
The household profile of the study population reveals several critical insights. A majority of mothers reside in rural areas (75.8%), and a substantial proportion (63.4%) lack any formal education. Such characteristics underscore the challenges related to access to health care, nutritional knowledge, and economic opportunities in the region. Similar patterns have been reported in rural Pakistan, Ethiopia, and Afghanistan, where maternal education and economic status strongly influence child malnutrition rates14,17,24. The distribution of the study sample across the three major regions, North Central (24.4%), North East (31.1%), and North West (44.5%), further emphasizes the diverse socioeconomic contexts within Northern Nigeria. Additionally, the wealth index distribution, with nearly 60% of households falling within the poorest and poorer categories, points to economic constraints that are likely to exacerbate the risk of malnutrition. For example, Yemen and Syria have seen rising malnutrition due to prolonged conflict and financial collapse, similar to the situation in insurgency-affected areas of Northern Nigeria13. Furthermore, the impact of armed conflict in Northern Nigeria, particularly in the North East, mirrors experiences in Afghanistan and Yemen, where displacement, food shortages, and healthcare system disruptions as a result of conflict have significantly worsened child nutrition25,26. The combination of economic instability, insecurity, and weak healthcare systems continues to place children in these regions at a disproportionately high risk of malnutrition.
Over the study period, marked changes in nutritional outcomes were observed, which indicates divergent trends in acute versus chronic malnutrition. While improvements in emergency nutritional support or short-term interventions may have contributed to the reduction in wasting, the increase in stunting, a marker of chronic malnutrition, indicates that long-term dietary deficiencies and structural issues such as poverty, low maternal education, weak healthcare infrastructure, food insecurity, poor sanitation, and conflict-related displacement remain unresolved. This dichotomy highlights the need for sustained long-term nutritional interventions that address the underlying causes of chronic malnutrition. The observed trends in Northern Nigeria align with patterns seen in other rural, resource-limited settings globally. Studies in South Asia, Latin America, and the Middle East report persistently high rates of chronic malnutrition despite reductions in acute malnutrition, underscoring the inadequacy of short-term interventions in addressing structural determinants of malnutrition12,27. In rural India, for example, stunting remains prevalent due to inadequate maternal education, poor sanitation, and limited healthcare access28. Similarly, in Guatemala and Honduras, child malnutrition is exacerbated by economic instability, food insecurity, and climate shocks29. In Northern Nigeria, collaboration between humanitarian agencies, government, and local communities can facilitate the development of mobile health and nutrition units that serve internally displaced populations.
The findings have specific implications for rural and remote health. The greater vulnerability observed in rural areas, where 75.8% of the study population resided, points to systemic disadvantages that transcend simple geographic location. For practitioners, this highlights the inadequacy of deploying urban-centric health models in rural settings without significant adaptation. Interventions must account for greater travel distances, limited access to formal healthcare facilities, and a heavier reliance on informal community support systems. For example, the success of community-based nutrition programs in other rural contexts suggests that leveraging local health workers and community leaders is a necessary strategy for improving nutritional outcomes in Northern Nigeria. Furthermore, the stark increase in stunting, a marker of chronic deprivation, suggests that rural health policies must move beyond emergency food aid and focus on long-term structural determinants, including improving maternal education, ensuring sustainable food security through local agriculture, and strengthening primary healthcare infrastructure.
One key finding of this study is the stark regional disparities within Northern Nigeria. The findings of this study align with reports by UNICEF in 2021, which stated that the prevalence of malnutrition varies significantly across Nigeria, with stunting rates exceeding 60% in some northern states, while some southern states report rates as low as 7%2. These disparities mirror patterns observed in other crisis-prone regions, such as Afghanistan and Syria, where instability disrupts food supply chains and limits access to healthcare services13. The Nigerian government, in collaboration with international organizations, has implemented various interventions to address malnutrition, including the National Strategic Plan of Action on Nutrition and targeted feeding programs such as the Community-Based Management of Acute Malnutrition. Despite these efforts, malnutrition remains a significant challenge, particularly in conflict-affected and food-insecure regions. The findings of this study contribute to the existing literature by highlighting the urgent need for region-specific strategies that account for security challenges, infrastructural gaps, and sociocultural barriers that hinder effective nutritional interventions in Northern Nigeria.
The study also highlights the crucial role of maternal education and socioeconomic status in determining child nutritional outcomes. Similar findings have been reported in Bangladesh, where maternal education significantly influences child-feeding practices and nutritional status11. In rural Peru and Bolivia, interventions targeting maternal empowerment and economic stability have demonstrated positive effects on child nutrition30. These parallels underscore the importance of policies that enhance maternal education and economic opportunities to mitigate child malnutrition in Northern Nigeria.
Given these findings, policy implications must extend beyond short-term nutritional interventions. Strategies should prioritize improving maternal education, enhancing economic opportunities for women, and strengthening healthcare systems in rural, underserved areas. Drawing from successful models in Ethiopia and Mexico, community-based nutrition programs incorporating maternal education and microfinance initiatives could serve as sustainable approaches to addressing chronic malnutrition31,32. These models have successfully reduced malnutrition by empowering women through financial literacy programs, vocational training, and direct cash transfers, which have led to improved child-feeding practices and food security. A similar approach tailored to the sociocultural context of Northern Nigeria could improve child health outcomes in the long term and yield significant benefits.
Additionally, interventions should be age-specific, targeting critical periods of growth. Evidence from Nepal and Indonesia showed that integrated early childhood nutrition programs led to reductions in stunting and improved cognitive outcomes 33,34. Implementing similar models in Northern Nigeria, alongside community-driven approaches, could yield positive long-term nutritional and developmental outcomes. Engaging local leaders in promoting beneficial feeding practices could also enhance intervention acceptance and sustainability.
Conclusion
This study analyzed child malnutrition trends in Northern Nigeria from 2013 to 2018 and revealed significant, diverging shifts in stunting, wasting, and underweight. While wasting decreased, stunting increased, highlighting the persistent challenge of chronic malnutrition. The findings showed that this was driven by a combination of poverty, low maternal education, and food insecurity, compounded by the broader context of conflict and instability discussed in the literature. These trends mirrored global patterns in crisis-affected regions, which emphasized the limitations of short-term interventions. Regional disparities, maternal education, and socioeconomic status were identified as important determinants of child nutrition. Therefore, a varied approach is essential to combat malnutrition effectively. Long-term strategies should focus on poverty alleviation, improved healthcare, and maternal empowerment. As demonstrated by initiatives like the National Strategic Plan of Action on Nutrition and the Community-Based Management of Acute Malnutrition, community-based programs and region-specific strategies are needed to address the root causes of malnutrition and improve child health outcomes.
Limitations and mitigation strategies
Data availability
The study was initially intended to include the 2021 NDHS data to capture more recent trends; however, malnutrition-related data were unavailable in the 2021 survey. To mitigate this, the analysis focused on the available 2013 and 2018 NDHS datasets, which still offer valuable insights into trends in child malnutrition in Northern Nigeria. In addition, findings were contextualized using supplementary data from reputable sources such as UNICEF and WHO reports.
Cross-sectional design
The cross-sectional nature of the study restricts the ability to infer causality between sociodemographic factors and malnutrition outcomes. To mitigate this, logistic regression analyses were employed to control for potential confounders, thereby strengthening the observed associations. Comparisons with existing longitudinal studies in similar contexts were also used to support and validate the findings.
Reliance on secondary data
The exclusive use of NDHS secondary data may not fully capture local nuances, such as detailed cultural dietary practices or comprehensive household food security measures. To mitigate this, the study utilized standardized anthropometric indicators (eg Z-scores for stunting, wasting, and underweight) to ensure consistency. Triangulation with findings from other studies and reports provided additional context to enrich the analysis.
Regional variability
While the study covers the three major regions of Northern Nigeria (North Central, North East, and North West), it does not capture subregional variations that might exist at the state or local government area levels. Regional disparities were addressed through stratified logistic regression models that highlighted differences across the three zones. Future research is recommended to disaggregate data further to explore intraregional differences.
Funding
This research received no specific grant from any funding agency in the public, commercial, or not-for-profit sectors.
Conflicts of interest
The authors declare that they have no known competing financial interests or personal relationships that could have influenced the work reported in this article.
AI disclosure statement
During the preparation of this work the author(s) did not use artificial intelligence (AI) or AI-assisted technologies to formulate questions or hypotheses or to design and conduct experiments, draft parts of the paper, or to summarize, paraphrase and/or significantly revise or synthesis textual content, translate parts or the entirety of the paper, collect, analyze, interpret or visualize data, extract data for review of the literature (in a systematic or any other kind of review) and/or identify knowledge gaps or generate synthetic data and images reported in the paper or used in research.
References
You might also be interested in:
2013 - Ophthalmological disorders in rural areas of Crete: a geospatial analysis
2011 - Earthquake, tsunami, radiation leak, and crisis in rural health in Japan