


Introduction
Issues associated with the recruitment and retention of health professionals outside of metropolitan locations in Australia remains largely intractable1, despite various national initiatives to improve rural workforce retention, like the Rural Health Multidisciplinary Training program2 and the Allied Health Rural Generalist Pathway3. High turnover leads to increased costs to the healthcare system. In 2009, the estimated costs of prematurely replacing an allied health professional were between $23,000 for regional areas and $47,000 for remote areas4. Given the age of this study, these costs are likely to have increased5. High turnover within a location also leads to reduced continuity and effectiveness of care to a population already relatively poorly serviced and having lower overall health and higher levels of chronic disease than their metropolitan counterparts1. Stabilising this workforce remains a national priority6.
The allied health workforce comprises people from a diverse range of professions. While definitions vary, allied health professionals are described by Allied Health Professions Australia as providing ‘a broad range of diagnostic, technical, therapeutic and direct health services to improve the health and wellbeing of the consumers they support’, referring to outcomes outside of the boundaries of emergency, medical, dental and nursing care7. Allied health professionals hold tertiary qualifications, which allow eligibility for membership of the relevant national self-regulating professional association or registration with the relevant national board.
In Australia, many but not all allied health professionals are registered with the National Registration and Accreditation Scheme. In 2022 there were 180,900 allied health professionals working in nationally registered allied health disciplines1. Examination of allied health clinical full-time equivalents per 100,000 residents revealed relative allied health workforce shortages outside metropolitan areas that are poorest in very remote areas1. Additionally, at least half of rural allied health professionals in Australia are employed in the public sector8-11. Thus, retention issues specific to public sector allied health positions in rural and remote locations will have a marked effect on patient care in those locations compared to metropolitan and regional locations, where a greater proportion of services are provided by the private sector.
When examining evidence related to retaining the allied health workforce in regional, rural and remote areas, allied health professions are often placed in the same basket and contrasted with other sectors of the health workforce such as nursing and medicine5. This occurs despite recognition that the term allied health encompasses disparate professions that are more ‘apples and oranges’, differing markedly in their background, training, scope of practice and client populations. While this diversity represents a strength of the allied health workforce, it also represents a challenge when examining workforce behaviour outcomes such as retention. Grouping allied health professions together risks missing professions and/or geographic differences that could be targeted for the development of specific retention strategies5.
Low sample numbers of those employed in rural and remote allied health positions appears to be a primary reason for combining professions in the allied health catch-all. Russell and colleagues, for example, analysed data from a sample of 20 Australian rural and remote primary healthcare services, comparing retention of medical, nursing and allied health professionals12. Median retention periods for allied health professionals was about 2 years in both rural and remote areas, with allied health professionals being 78% more likely to leave employment than nurses12. The study design, however, lacked sufficient power to examine retention across different allied health professions.
Chisholm and colleagues examined retention of a group of allied health professions (dietitians, occupations therapists, physiotherapists, social workers, podiatrists and speech pathologists) working in regional, rural and remote health services in Victoria in a 6-year observation window (2004–2009)4. Retention data for 901 allied health professionals were provided by 11 health services. Differences were observed between regional, rural and remote retention that emerged around 12 to 24 months from starting a position, though there was no overall significant effect of geographic region. Differences in retention were observed for profession and employee age at commencement. Social workers, occupational therapists and physiotherapists had the longest median retention times (4, 3 and 3 years, respectively), with podiatrists and dietitians having the shortest median retention times (18 months for each profession). Retention times for speech pathologists and psychologists were between these extremes (2.6 and 2.5 years, respectively). Overall, those aged over 35 years were less at risk of leaving health services than those aged 30 years or less.
The results from these two studies showed the potential value of utilising employment records to provide useful information on allied health professional retention that can be used for purposes like providing expected retention benchmarks by region and profession, identifying periods during employment when intervention to increase retention might be most effective, and determining potential factors that influence employee retention. The Chisholm study findings also provided initial data that retention is not uniform across all allied health professions. Findings from these studies, though, are now quite dated. The Russell study focused on retention in primary healthcare services and did not separate allied health professions. The Chisholm study gathered data from the Australian state of Victoria, where distances to the capital city of Melbourne are not great compared to other areas of Australia, such as the state of Queensland. Their study sample was also small, limiting insight into the ‘apples and oranges’ in the retention basket. Indeed, the authors recommended further research on allied health professions to consolidate knowledge on professional and geographic differences that may have reached significance had their study possessed more power.
This study aimed to take a closer look at the allied health retention basket by assessing the retention patterns of allied health professionals employed in regional, rural and remote regions of Southern Queensland. Using employee records for two public sector health services in this geographic footprint, which includes a regional city and rural, remote and very remote communities, we sought to answer the following questions:
- Are there significant differences in retention between different allied health professions? Are all the allied health retention ‘eggs’ the same, or, retention-wise, do they contain a mixture of ‘apples and oranges’?
- How does retention in allied health professions compare to previously observed findings and designated allied health benchmarks?
- Are key workforce exit points evident in the data and do these exit points differ across professions?
- Is there evidence of the previously observed 12-month lag before differences in retention across geographic areas emerge?
- What demographic and employment-related factors present in the employee data (eg geographic remoteness, starting age, starting pay grade) are predictive of retention risk?
Methods
A retrospective quantitative longitudinal design was employed for this study, using de-identified employee records from allied health professionals working in the public sector.
Setting
Two public health services in Southern Queensland, Australia, were chosen as the study setting. The combined footprint of these services of approximately 400,000 km2 stretches north from the Great Dividing Range to the Northern Territory border. According to the Modified Monash Model (MMM) of classifying geographic regions in Australia13, the setting encompassed a regional city (MM 2) as well as rural (MM 4–5) and remote and very remote (MM 6–7) locations. As of June 2023, Service 1 encompasses an area of 90,000 km2 and includes the regional city (population of 142,000) and outlying rural and remote communities (population of 160,000). This service employs approximately 5150 full-time equivalent staff. Service 2 encompasses a rural hub and outlying remote and very remote communities. It employs approximately 830 full-time equivalent staff, servicing a vast, sparsely populated area (>310,000 km2 with a population of around 26,000)14,15.
Employee records
All allied health professionals were employed under the Queensland Health HP (health professional) pay stream. To this end, all records in the HP stream from an allied health profession and with employment commencement on or after 1 January 2010 were included in the dataset. Only those employed more than 50% of the time in the footprint of the health services were included. Those employed prior to 1 January 2010 and those identified as filling locum positions were excluded from the data.
Derived data
De-identified data from employee records were collected from a 12-year observation period between January 2010 and December 2021. The critical time-based variable derived from employee records was years employed in location (ie town or city). This definition was chosen as it most closely relates to consistency of care provision, particularly in smaller communities. If a person moved locations but stayed with the health service, consistency of care in the community they left would be compromised and a new employee would need to fill the role the initial employee vacated. The consequence of this decision was that one employee could have multiple records across the observation window. Thus, a new record for an employee was created if an employee moved location or had an absence of 6 months or more before returning to employment with the health service.
If an employee worked in one or more locations at the same time, their employment location in the earliest employee record was used as work location until they left that location, after which a new record was created for the next location. If they retained employment in that location throughout their tenure, that location was maintained until they ceased employment with the health service. If the employee was still working in a location with the health service on 31 December 2021, the record was regarded as continuing and was therefore right-censored (see Data analysis).
Covariates associated with each employee record were generated from available information. The main covariates of interest were allied health profession and work location. Work location was classified according to the MMM geographic classification system13. Profession, to the extent possible, was classified according to the profession required to fulfil the role (eg speech pathologist, physiotherapist). When attempting to code mental health positions, the underlying profession could not be always discerned from the employee record information, as some mental health roles could be filled by several professions (psychology, occupational therapy, social worker). The decision was made during coding, therefore, to include psychology and mental health clinician records in a single category.
Employee age at the start of a position was calculated and categorised into ‘under 30 years’, ‘between 30 and 45 years’ and ‘over 45 years’, and sex of employee was also coded. Starting pay grade was coded according to whether the employee started a position in location at HP 1–2, HP 3, HP 4 or HP 5 and greater, with higher numbers indicating more seniority.
Position type was classified according to whether employment in the role was casual, permanent part-time, permanent full-time or temporary. Position role was classified as being either clinical or non-clinical, and employment sector was classified as either working in the hospital or community sectors.
A predominance rule was applied to the position type, position role and employment sector variables, such that the record was categorised according to largest percentages of time. For example, if an employee record in a location included a mixture of permanent part-time, permanent full-time and casual work, the record would be coded according to the largest percentage of time the employee spent in a particular position type.
Data analysis
Descriptive data, in the form of medians, 95% confidence intervals (CIs) and proportions, were prepared using Microsoft Excel.
Survival analysis measures time-to-event outcomes and considers whether an event occurred or did not occur through a process known as censoring16. Data analysis was carried out using RStudio v4.3.0 (Posit Software; https://posit.co/download/rstudio-desktop) using the ‘survival’ library17. Kaplan–Meier survival functions for strata within each of the seven covariates were prepared. The robust version of the log–rank test (to account for multiple records being contributed by some employees) was used to determine significant differences in median retention times across covariate strata. Kaplan–Meier survival curves, measuring retention time in this instance, for each stratum of the profession and work location covariates were prepared, after adjusting for covariates with significant crude relationships with retention time.
Cox proportional hazards regression was then used to gain estimates of crude hazard ratios (and 95%CIs). Covariates possessing univariate relationships of p<0.05 with median retention time were then selected for entry into a multivariate Cox regression model to determine covariates that impacted the risk of leaving a location after adjusting for other covariates in the model. The Andersen–Gill version of the Cox regression model18 was used as it adjusts for dependence of records brought about by recurrent events in a dataset. Estimated adjusted hazard ratios, with 95%CIs, from this model were then used to describe the strength and direction of the relationship between covariate strata and risk of leaving employment in a location.
A minimum of 20 events per variable is required for a stable Cox regression model19. Given seven covariates in the design, the potential for correlation from recurrent events, and the a priori assumption that events would occur in 65% of observed records, the minimum required sample size for this overall analysis was set at 216.
Ethics approval
The project received ethics approval and the associated waiver of consent from the Darling Downs Health Human Research Ethics Committee (approval no: EX/2022/QTDD/81938) and was ratified by the University of Queensland (ref:2022/HE000313) and University of Southern Queensland (ref: H22REA044). Site-specific approvals were received from each of the participating health services.
Results
Data records
Table 1 shows the breakdown of records for each covariate for which data were collected, the number of records per employee and event status for each profession. The analysis contained 1711 records from 1454 employees. More than one record was contributed by 199 (13.7%) of employees, with six being the highest number of records per individual. Events (ie the employee completed their employment in a location) occurred in 71.8% of records. Sampled employees were predominantly female (81.4%), employed permanently (90.3%), in a clinical role (97.2%) and in the public hospital sector (81.4%). Patterns of note included that over 90% of records were from females in the dietetics, occupational therapy, social work and speech pathology professions; and over 30% of records in the psychology/mental health, social work and radiation/sonography/medical imaging professions were from employees aged 45 years or more.
Table 1: Summary of covariates and their strata, records per employee and event status collected from employee records for each profession
|
Covariate |
Category |
Total records (N=1711) |
Profession |
||||||||||
|---|---|---|---|---|---|---|---|---|---|---|---|---|---|
|
n (%) |
Oral health/ dentistry (N=53) |
Psychology/ mental health clinician (N=226) |
Dietetics (N=108) |
Occupational therapy (N=236) |
Social work (N=217) |
Physiotherapy (N=295) |
Speech pathology (N=123) |
Pharmacy (N=146) |
Radiography/ sonography/ medical imaging (N=146) |
Anaesthetic technician (N=45) |
Other allied health (N=118) |
||
|
n (%) |
n (%) |
n (%) |
n (%) |
n (%) |
n (%) |
n (%) |
n (%) |
n (%) |
n (%) |
n (%) |
|||
| Work location | MM 2 | 888 (51.9) | 14 (26.4) | 116 (51.3) | 52 (48.1) | 133 (56.4) | 112 (51.6) | 120 (41.0) | 45 (36.6) | 85 (58.2) | 97(66.4) | 45 (100.0) | 69 (58.5) |
| MM 4 – MM 5 |
632 (36.9) |
36 (67.9) | 80 (35.4) | 42 (38.9) | 84 (35.6) | 89 (41.0) | 120 (41.0) | 68 (55.3) | 52 (35.6) | 22 (15.1) | 0 (0.0) | 39 (33.1) | |
| MM 6 – MM 7 |
191 (11.2) |
3 (5.7) | 30 (13.3) | 14 (13.0) | 19 (8.1) | 16 (7.4) | 53 (18.1) | 10 (8.1) | 9 (6.2) | 27 (18.5) | 0 (0.0) | 10 (8.5) | |
| Sex | Male | 316 (18.5) | 12 (22.6) | 50 (22.1) | 4 (3.7) | 19 (8.1) | 21 (9.7) | 79 (27.0) | 6 (4.9) | 44 (30.1) | 40 (27.4) | 12 (26.7) | 30 (25.4) |
| Female |
1393 (81.4) |
41 (77.4) | 176 (77.9) | 104 (96.3) | 217 (91.9) | 196 (90.3) | 214 (73.0) | 117 (95.1) | 102 (69.9) | 106 (72.6) | 33 (73.3) | 88 (74.6) | |
| Other |
2 (0.1) |
0 (0.0) | 0 (0.0) | 0 (0.0) | 0 (0.0) | 0 (0.0) | 2 (0.7) | 0 (0.0) | 0 (0.0) | 0 (0.0) | 0 (0.0) | 0 (0.0) | |
| Position type | Casual | 96 (5.6) | 1 (1.9) | 3 (1.3) | 3 (2.8) | 6 (2.5) | 17 (7.8) | 14 (4.8) | 9 (7.3) | 17 (11.6) | 17 (11.6) | 7 (15.6) | 2 (1.7) |
| Permanent full-time |
1162 (67.9) |
34 (64.2) | 160 (70.8) | 67 (62.0) | 163 (69.1) | 132 (60.8) | 231 (78.8) | 78 (63.4) | 96 (65.8) | 99 (67.8) | 32 (71.1) | 70 (59.3) | |
| Permanent part-time |
383 (22.4) |
15 (28.3) | 57 (25.2) | 36 (33.3) | 60 (25.4) | 59 (27.2) | 32 (26.0) | 27 (22.0) | 31 (21.2) | 30 (20.5) | 6 (13.3) | 30 (25.4) | |
| Temporary |
70 (4.1) |
3 (5.7) | 6 (2.7) | 2 (1.9) | 7 (3.0) | 9 (4.1) | 16 (5.5) | 9 (7.3) | 2 (1.4) | 0 (0.0) | 0 (0.0) | 16 (13.6) | |
| Starting age (years) | <30 | 907 (53.0) | 16 (30.2) | 68 (30.1) | 79 (73.1) | 174 (73.7) | 53 (24.4) | 231 (78.8) | 98 (79.7) | 77 (52.7) | 58 (39.7) | 15 (33.3) | 38 (32.2) |
| 30 – <45 |
467 (27.3) |
26 (49.1) | 81 (35.8) | 21 (19.4) | 51 (21.6) | 64 (29.5) | 45 (15.4) | 22 (17.9) | 46 (31.5) | 41 (28.1) | 21 (46.7) | 49 (41.5) | |
| ≥45 |
337 (19.7) |
11 (20.8) | 77 (34.1) | 8 (7.4) | 11 (4.7) | 100 (46.1) | 17 (5.8) | 3 (2.4) | 23 (15.8) | 47 (32.2) | 9 (20.0) | 31 (26.3) | |
| Role | Clinical | 1668 (97.5) | 53 (100.0) | 226 (100.0) | 105 (97.2) | 235 (99.6) | 214 (98.6) | 293 (100.0) | 123 (100.0) | 137 (93.8) | 140 (95.9) | 42 (93.3) | 100 (84.7) |
| Non-clinical |
43 (2.5) |
0 (0.0) | 0 (0.0) | 3 (2.7) | 1 (0.4) | 3 (1.4) | 0 (0.0) | 0 (0.0) | 9 (6.2) | 6 (4.1) | 3 (6.7) | 18 (15.3) | |
| Sector | Hospital | 1380 (80.7) | 51 (96.2) | 93 (41.2) | 87 (80.6) | 187 (79.2) | 161 (74.2) | 274 (93.5) | 114 (92.7) | 143 (97.9) | 128 (87.7) | 45 (10.0) | 97 (82.2) |
| Community |
331 (19.3) |
2 (3.8) | 133 (58.8) | 21 (19.4) | 49 (20.8) | 56 (25.8) | 19 (6.5) | 9 (7.3) | 3 (2.1) | 18 (12.3) | 0 (0.0) | 21 (17.8) | |
| Starting pay grade | HP 1–2 | 79 (4.6) | 0 (0.0) | 0 (0.0) | 0 (0.0) | 1 (0.4) | 1 (0.5) | 0 (0.0) | 0 (0.0) | 19 (13.0) | 13 (8.9) | 44 (97.8) | 11 (9.3) |
| HP 3 |
1178 (68.8) |
45 (84.9) | 146 (64.6) | 90 (83.3) | 192 (81.4) | 156 (71.9) | 261 (89.1) | 94 (76.4) | 89 (61.0) | 55 (37.7) | 1 (2.2) | 49 (41.5) | |
| HP 4 |
369 (21.6) |
8 (15.1) | 49 (21.7) | 18 (16.7) | 41 (17.4) | 51 (23.5) | 31 (10.6) | 27 (22.0) | 31 (21.2) | 68 (46.6) | 0 (0.0) | 45 (38.1) | |
| ≥HP 5 |
85 (5.0) |
0 (0.0) | 31 (13.7) | 0 (0.0) | 2 (1.0) | 9 (4.1) | 1 (0.3) | 2 (1.6) | 7 (4.8) | 10 (6.8) | 0 (0.0) | 23 (19.5) | |
| No. of records per employee | 1 | 1454 (85.0) | 45 (84.9) | 189 (83.6) | 97 (89.8) | 194 (94.7) | 174 (82.2) | 258 (88.1) | 102 (82.9) | 114 (78.1) | 124 (84.9) | 42 (93.3) | 114 (96.6) |
| 2 |
199 (11.6) |
7 (13.2) | 30 (13.3) | 11 (10.23) | 31 (4.3) | 31 (13.1) | 27 (9.2) | 16 (13.0) | 24 (16.4) | 16 (11.0) | 2 (4.4) | 4 (3.4) | |
| 3 |
42 (2.5) |
1 (1.9) | 4 (1.8) | 0 (0.0) | 8 (1.0) | 11 (4.7) | 5 (1.7) | 4 (3.3) | 5 (3.4) | 4 (2.7) | 0 (0.0) | 0 (0.0) | |
| ≥4 |
16 (0.9) |
0 (0.0) | 3 (1.3) | 0 (0.0) | 3 (0.0) | 1 (0.4) | 3 (1.0) | 1 (0.8) | 3 (2.1) | 2 (1.4) | 0 (0.0) | 0 (0.0) | |
| Event status | Completed | 1228 (71.8) | 34 (64.2) | 171 (75.7) | 82 (75.9%) | 176 (74.6%) | 152 (70.0) | 232 (79.2) | 99 (80.5) | 97 (66.4) | 86 (58.9) | 23 (48.9) | 76 (64.4) |
| Continuing |
483 (28.2) |
19 (35.8) | 55 (24.3) | 26 (24.1%) | 60 (25.4%) | 65 (30.0) | 61 (20.8) | 24 (19.5) | 49 (33.6) | 60 (41.1) | 22 (51.1) | 42 (35.6) | |
HP, health professional pay grade (Queensland Health). MM, Modified Monash Model 2019 census13 geographic classifications.
Survival analysis and Cox regression
Overall, the median retention time for allied health professionals was 1.27 years (95%CI 1.15–1.46 years). Table 2 shows median retention times and corresponding 95%CIs for profession, work location and other study covariates, along with associated robust log–rank statistics.
Kaplan–Meier survival functions for employee retention in location for each stratum of the work location and profession covariates are shown in Figures 1 and 2, respectively, after adjusting for the influence of covariates with significant crude relationships with retention in location. Median retention in location was greater in the regional city than in either rural or remote areas. Differences between regional and rural and remote retention began to emerge at about 5 months after position commencement, with additional divergence between rural and remote positions beginning about 2 months after that.
Figure 2 indicates those employed in the physiotherapy, speech pathology, occupational therapy and dietetics had the shortest median retention times, with 50% of those employed in these positions leaving location within 9–12 months of starting the position. Those employed in oral health/dentistry and anaesthetic technician positions had the longest median retention in location (2.5–3 years).
The six covariates that possessed a significant crude relationship with hazard of leaving a location were utilised in the Cox regression analysis. The final Cox regression demonstrated significant goodness-of-fit (62.0%, robust χ² (21) = 205.20, p<0.001). The relationships between risk of leaving a position in location and each of the six covariates, after adjusting for other covariates, are shown in Figure 3 in the form of forest plots.
After adjusting for other covariates in the Cox regression model, relative to those employed as physiotherapists, those employed in oral health/dentistry positions were (HR 0.49 CI 0.32–0.74) nearly half as likely to leave location. Similar reductions in relative risk compared to physiotherapists were observed for those employed in psychology/mental health (HR 0.68, 95%CI 0.55–0.85), social work (HR 0.66, 95%CI 0.52–0.83), pharmacy (HR 0.61, 95%CI 0.48–0.78), radiography/sonography/medical imaging (HR, 0.59, 95%CI 0.45–0.77), anaesthetic technicians (HR 0.45, 95%CI 0.26–0.77) and other positions (HR 0.71, 95%CI 0.54–0.93). There were no differences in risk of leaving location between those employed in physiotherapy, dietetics, occupational therapy and speech pathology positions.
Those employed in MM 4–5 and MM 6–7 locations were 1.61 (95%CI 1.41–1.84) and 2.16 times (95%CI 1.80–2.61) more likely to leave a location than those employed in the MM 2 regional centre. Those employed in casual and temporary roles were 1.48 (95%CI 1.15–1.91) and 1.52 times (95%CI 1.13–2.05) more likely to leave a location than those employed in permanent part-time positions. Those who started at the HP 4 pay grade were less likely (HR 0.78, 95%CI 0.67–0.91) to leave a location than those who started their employment at HP 3. Those who started their employment at less than 30 years of age and those starting their employment at 45 years or more were 1.19 (95%CI 1.02–1.38) and 1.40 (95%CI 1.17–1.67) times more likely to leave a position in location than those who started employment aged between 30 and 44 years. Employment sector was not found to predict risk of leaving location after adjusting for other covariates in the analysis.
Table 2: Crude median retention times (years), 95% confidence intervals and robust log–rank statistics for geographic classification and study covariates
| Factor | Variable | Median retention (95%CI) | Robust log–rank test |
|---|---|---|---|
| Work location | MM 2 | 2.09 (1.74–2.51] | χ2 (2) = 125.70*** |
| MM 4–5 |
0.99 (0.87–1.09) |
||
| MM 6–7 |
0.74 (0.52–1.00) |
||
| Profession | Oral health/dentistry | 2.16 (1.19–3.39) | χ2 (10) = 60.83*** |
| Psychology/mental health |
1.55 (1.19–2.00) |
||
| Dietetics |
0.92 (0.75–1.90) |
||
| Occupational therapy |
1.07 (0.86–1.60) |
||
| Social work |
1.53 (1.09–2.22) |
||
| Physiotherapy |
0.88 (0.65–1.02) |
||
| Speech pathology |
0.96 (0.80–1.32) |
||
| Pharmacy |
2.19 (1.66–2.74) |
||
| Radiography/sonography/medical imaging |
2.22 (1.70–3.61) |
||
| Anaesthetic technician |
4.99 (2.57–NA†) |
||
| Other |
1.34 (1.34–1.07) |
||
| Position type | Casual | 1.42 (0.81–2.22) | χ2 (3) = 40.29*** |
| Permanent full-time |
1.28 (1.11–1.49) |
||
| Permanent part-time |
2.11 (1.36–2.58) |
||
| Temporary |
0.86 (0.77–1.23) |
||
| Starting age (years) | <30 | 1.20 (1.04–1.44) | χ2 (2) = 31.10*** |
| 30 – <45 |
2.22 (1.83–2.66) |
||
| ≥45 |
1.02 (0.82–1.32) |
||
| Pay start grade | HP 1–2 | 3.04 (2.67–6.90) | χ2 (3) = 26.49*** |
| HP 3 |
1.15 (1.04–1.37) |
||
| HP 4 |
1.74 (1.34–2.20) |
||
| ≥HP 5 |
1.09 (0.90–2.25) |
||
| Sector | Hospital | 1.46 (1.22–1.65) | χ2 (1) = 4.19* |
| Community |
1.16 (1.00–1.45) |
||
| Role | Clinical | 1.34 (1.19–1.53) | χ2 (1) = 2.11 |
| Non-clinical |
2.02 (1.03–4.66) |
||
| Sex† | Female | 1.42 (1.22–1.59) | χ2 (1) <1 |
| Male |
1.08 (1.00–1.74) |
*p<0.05, **p<0.01, ***p<0.001.
† For the profession of anaesthetic technician, there were insufficient numbers to determine CIs.
CI, confidence interval. HP, health professional pay grade (Queensland Health). MM, Modified Monash Model 2019 census13 geographic classifications.
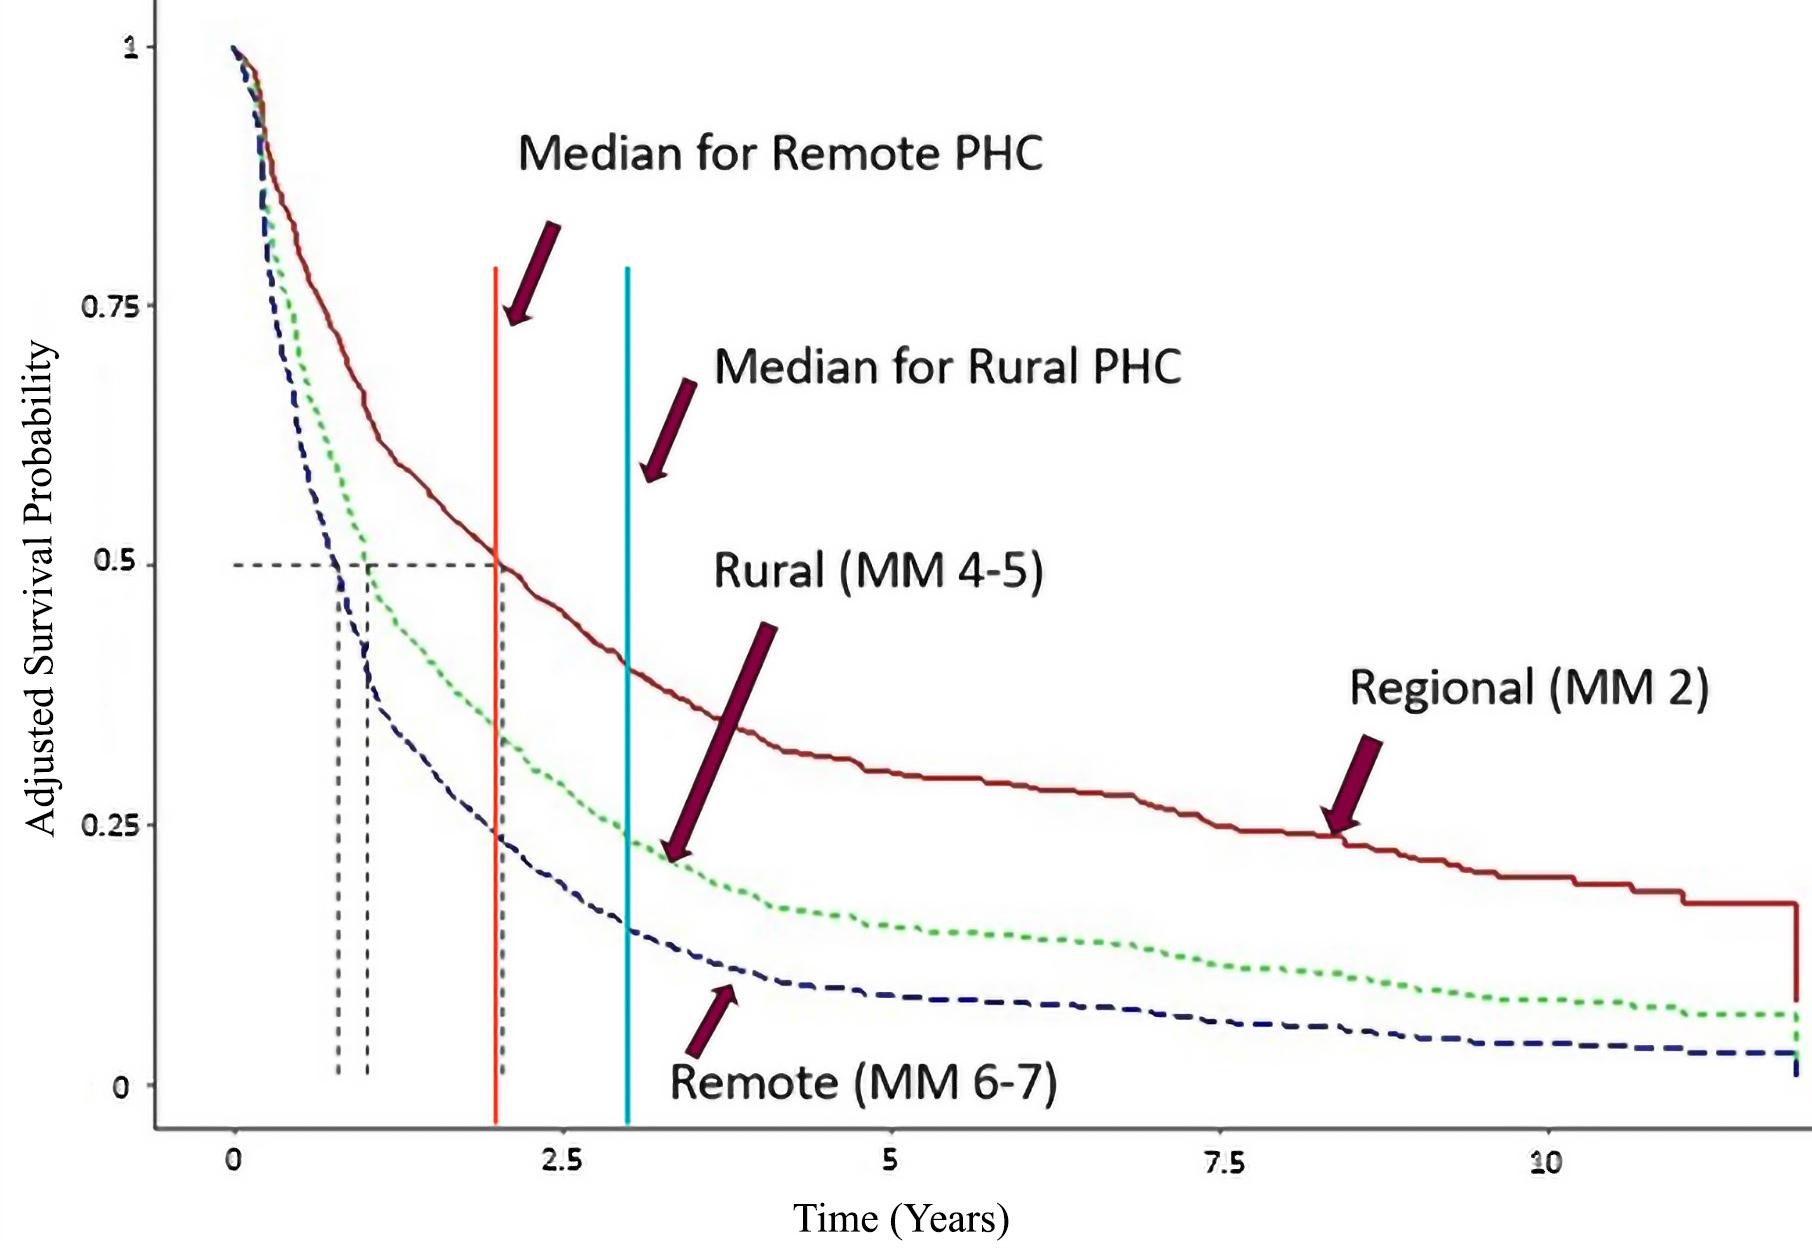 Figure 1: Adjusted Kaplan–Meier survival curves for each regional classification of work location. Dotted vertical lines indicate median retention for each region. The solid orange and blue vertical lines are the recommended 2012 allied health retention benchmarks for remote and rural primary health care12. MM, Modified Monash Model 2019 census13 geographic classifications. PHC, primary health care.
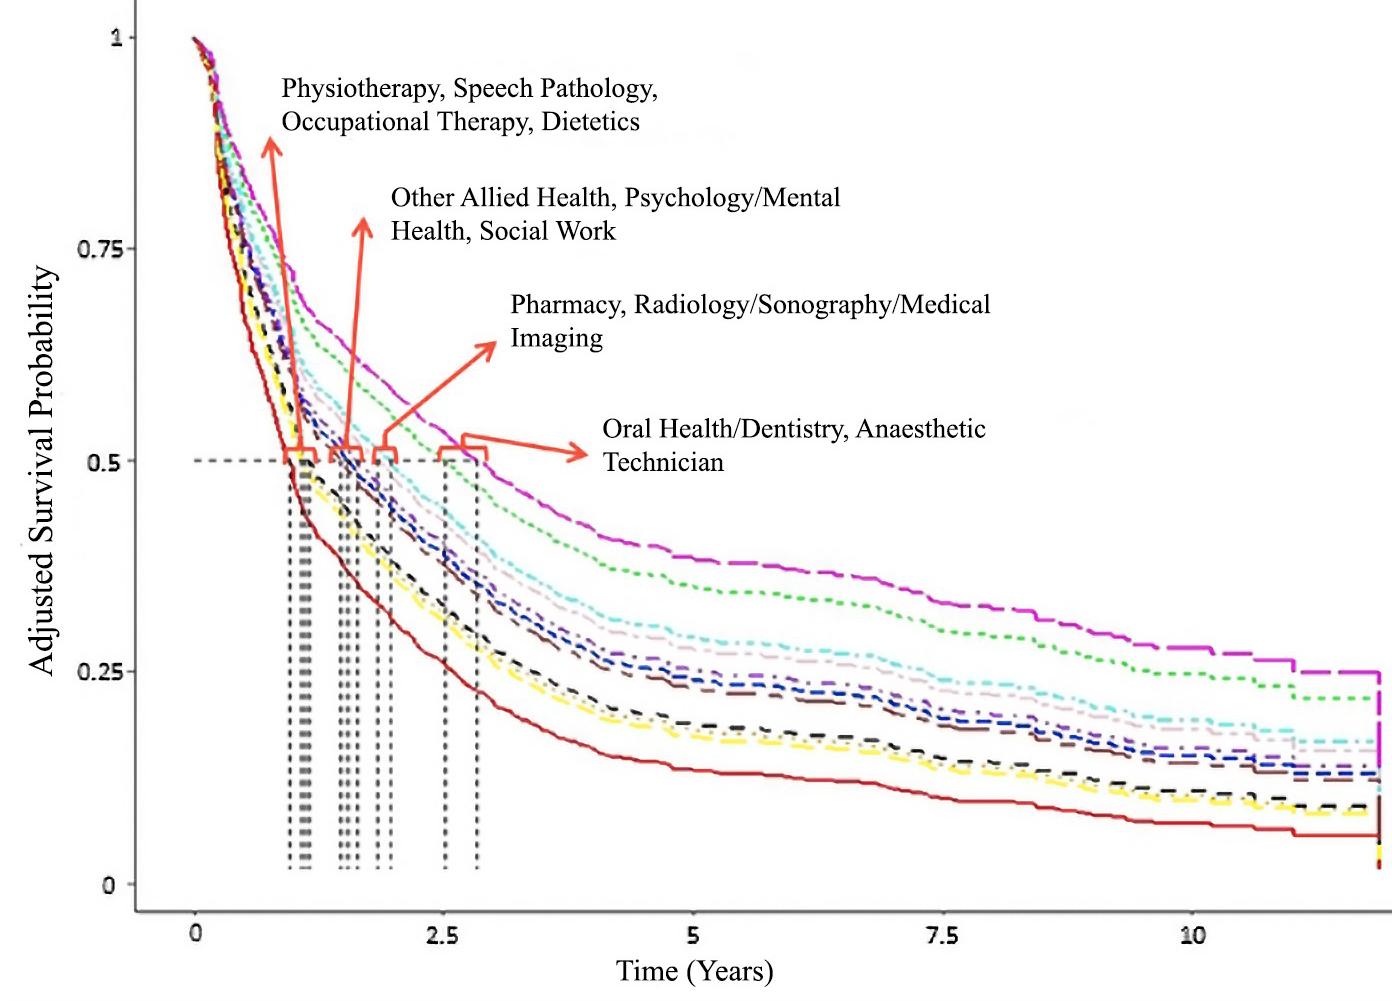 Figure 2: Adjusted Kaplan–Meier survival curves for each profession category. Dotted vertical lines indicate median retention for each profession.
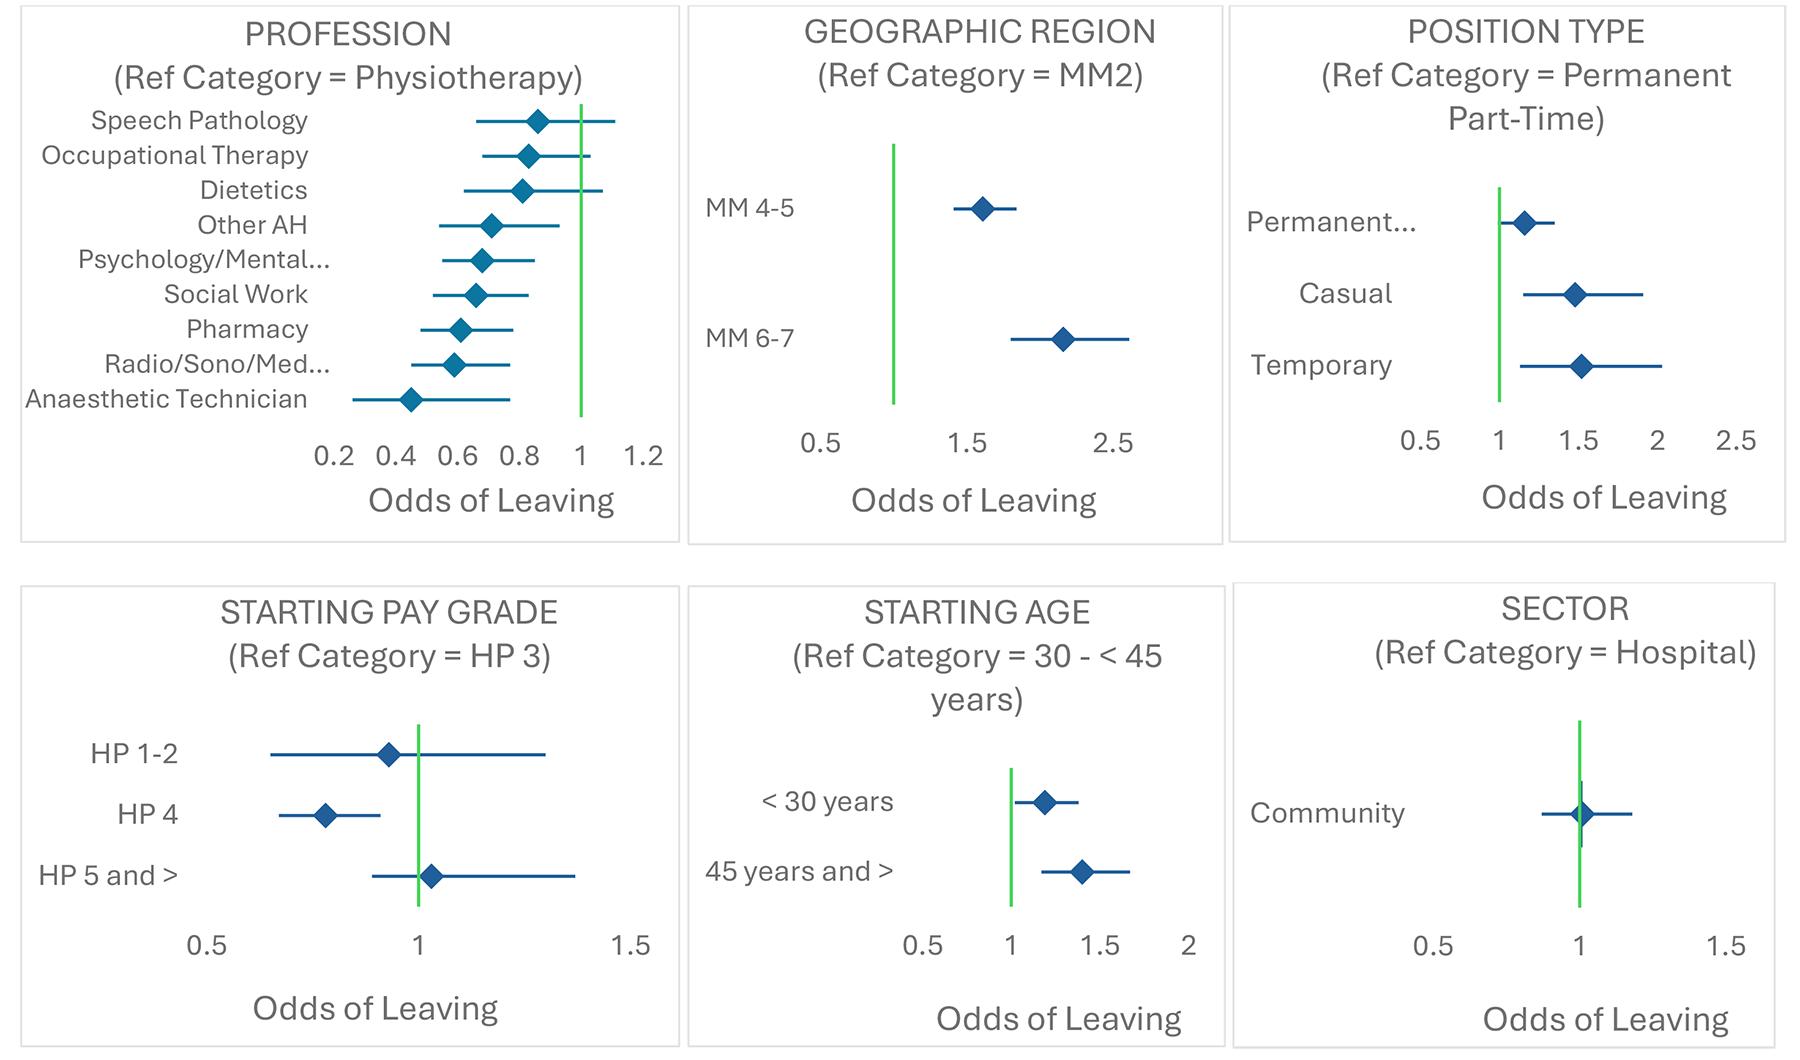 Figure 3: Forest plots of adjusted hazard ratios (and 95% confidence intervals) for each covariate in the Cox regression analysis. Covariate names and corresponding reference categories for each covariate are provided above each plot. Vertical line = hazard ratio of 1.00. Note: x-axis scales differ across figure panels. AH, allied health. HP, health professional pay grade (Queensland Health). MM, Modified Monash Model 2019 census13 geographic classifications.
Discussion
This study examined employee records of public sector allied health professionals in regional, rural and remote areas of Southern Queensland to determine retention time in location for the various allied health professions, the effect of work location on allied health professional retention, key times of risk to allied health workforce retention, and the influence of demographic covariates available in the employee database.
The findings demonstrate that:
- those employed in physiotherapy, speech pathology, occupational therapy and dietetics positions are at elevated retention-in-location risk. From a retention perspective, the allied health basket does indeed contain ‘apples and oranges’
- allied health professional retention in positions located in rural and remote areas is considerably lower than that observed in the regional city
- differences in retention in location across geographic regions and professions emerge within 3–6 months after starting the position
- retention time in location was influenced by employee age when they started the position, starting pay grade for the position and position type, but not by other demographic covariates included in the study design.
The overall median retention period observed in this study appears to be considerably lower than corresponding periods in previous studies of allied health employees in Victorian health services4 and rural and remote Australian primary healthcare services12, or the proposed retention benchmarks of 2 years for allied health professionals in primary healthcare services12. It is worth nothing, though, that the time-dependent variable used in both the earlier studies was based on commencement with and exit from the health service in question. The time-dependent variable in this study was location-based rather than health-service-based, with the likely result being shorter observed retention periods. While recognising this as a potential limitation in being able to relate our findings to those previous studies, the relationship between position-in-location time and continuity/quality of relationships and care and concomitant health outcomes meant it was more meaningful for our study to integrate location information into the operationalisation of our time-dependent variable. This location-based definition of retention is now primarily used by Russell and her colleagues20 and the reasoning behind using a location-based time-dependent variable in this study has been supported in subsequent personal discussion (D. Russell, pers. comm., 2023).
Despite the clear difference in operationalisation of the time-dependent variable, the findings are somewhat consistent with those observed in Victorian health services in the 2000s4 in terms of patterns of differences across allied health professions. Those employed in dietetics and speech pathology positions are among those at most retention risk in both studies, with social workers being at less retention risk. Findings diverge, though, when it comes to overall retention time and retention in some professions. Of the six professions examined by Chisholm4, those employed in occupational therapy and physiotherapy positions exhibited quite high retention (each at about 3 years). In this study, these positions have been found to be among the four most at risk of early exit. It is possible that supply and demand in these professions have changed since the Chisholm study, which was conducted prior to the COVID-19 pandemic and systemic changes in Australia like the National Disability Insurance Scheme, that significant numbers of allied health professionals now service21. The findings from this study indicate allied health professions that are more vulnerable than others. Interventions targeting those professions should be prioritised, with the first 12 months after starting a position, especially in rural and remote areas, being critical.
The findings from this study in relation to geographic region differences appear at first glance to be counter to the Chisholm findings from Victoria, in that Chisholm and colleagues observed no significant difference in retention risk across regions4. However, underlying patterns observed in this study are quite similar to those observed by Chisholm and colleagues, with a period after starting a position being present before geographic differences in retention are observed, and the underlying non-significant pattern showing greater risk of leaving for those working in regional areas, which is significant in our study. The similarity in observed patterns between the two studies suggests that the Chisholm study, as noted by the authors, may have suffered from issues with insufficient power. Another consideration is that Victoria represents a much smaller footprint than that used in this study. Most areas of regional Victoria would be classified under the MMM classification as between MM 2 and MM 5. The current study examined a broader range of communities, spanning communities in MM 2 to MM 7. Thus, the increased sample size observed in this study, the geographic diversity of the footprint, and the longer observation period (12 years compared to 6 years in the Chisholm study), may contribute to the reason for observation of differences in geographic region in this study.
Age at the start of employment was also found in the Chisholm study to be predictive of retention risk, with those more than 35 years of age when starting a position being less likely to leave than those aged 30 years or less. This is somewhat consistent with the findings in this study, where those aged between 30 and 45 years stayed in position in location longer than those aged less than 30 years. We also found, though, that allied health professionals aged more than 45 years were at increased risk of leaving a position prematurely. Typically, ages between 30 and 45 years overlap with early parenting years that necessitate stability of location to raise young children. Rural healthcare professionals are also known to move to more populated areas in search of better schooling and higher education opportunities for grown-up children22. Our study also observed that those starting positions at the HP 4 pay grade stayed the longest in a position in location. HP 4 roles tend to be senior and more autonomous roles that often combine clinical duties with management, education or research components. It is possible that this variety provides a positively challenging professional development opportunity that positively influences retention.
It is clear, from the results of this study, that all public sector allied health positions, regardless of the region in which they are located or the employed profession, experience similar levels of turnover in the first 6 months after starting a position. We are uncertain as to why this drop in retention occurs so uniformly, but it is not until 5–6 months after starting a position that retention differences begin to emerge; it does appear to be a consistent pattern in the literature4 that may warrant further exploration. Nevertheless, the first 6 months after starting a position in location appear to represent a crucial time for organisations and communities to engage with and support allied health professionals taking up roles in regional, rural and remote areas. Given the profession-specific differences in retention after this time, specific interventions that target the underlying causes of attrition should be investigated.
The nature of organisational interventions to support retention will depend largely on the underlying factors and the modifiability of those factors. Interventions need to be tailored to address modifiable factors. Thus, it is important to recognise the nature of modifiable and non-modifiable factors prior to any intervention being undertaken. Cosgrave’s Whole-of-Person Retention Improvement Framework23 has potential to assist organisations in determining modifiable retention factors across workplace/organisational, role/career and community/place domains. This framework recognises, in particular, the roles of attachment to place; engaging with community; and community-related factors such as accommodation, schooling and the impact of climate-related factors on community attractiveness as being as important to rural and remote retention as workplace and career-related factors. The framework recommends a whole-of-community approach to maximise recruitment and retention. Cosgrove’s framework can also provide potential explanations for some findings in this study (eg those in HP 4 roles staying longer in roles due to role/career factors and those with older children leaving rural areas in search of educational opportunities for older children (ie environmental factors)). Incentive schemes to attract health professionals to work in rural and remote health services, such as the Rural Health Workforce Incentive Scheme introduced by the NSW Health Service in 2025, offer allied health professionals packages of financial and non-financial incentives in return for 18 months of service. While there has been some evidence for success of these schemes in recruitment of GPs24, multifaceted retention strategies that more broadly examine staffing, workplace factors, social support and community attractiveness appear more suited to improving retention of allied health professionals in rural and remote areas25. Implementing a whole-of-person approach would stand to benefit all allied health professions and could also be expanded to other health and non-health professions employed by health services.
Another potential avenue to assist development of suitable tailored recruitment and retention interventions could be the application of systems-thinking approaches26. Within the context of a community co-design approach, systems thinking could assist stakeholders in developing causal loop diagrams associated with allied health professional recruitment in their communities and identifying effective and efficient points of leverage to best effect positive changes in allied health professional retention. While this approach has been applied previously to addressing recruitment and retention issues27, such an approach has not yet been applied to allied health professional retention in rural and remote regions.
Besides the previously mentioned variation in definition of the time-based dependent variable used here compared to past similar studies, other potential limitations are evident. Limiting the data collection to a single area of the country brings the question of whether those results are generalisable to other parts of the country. We acknowledge this as a limitation but also suspect similar underlying mechanisms might be affecting retention across other parts of the country. The similarity of findings between those observed here and those observed over a decade ago in another Australian region4 supports the potential transferability of findings.
It must be acknowledged that the source data used in this study was created by many and prepared primarily for administrative rather than research purposes. Thus, there are questions around data inconsistencies and fitness for purpose. There were areas where coding of profession could not be achieved from record information, such as determining the underlying profession of a person described in records as a mental health worker. Many factors with the potential to influence allied health professional retention (eg rural background and rural/remote service-learning placement opportunities) were not available in employee records. Tracking studies examining professional place of practice of allied health students after graduation, such the Australian linkage-based multi-university Nursing and Allied Health Graduate Outcomes Tracking study28 have the potential to provide some of this information.
Given these limitations, however, calculating retention data from employment records provides large numbers and, after significant coding and cleaning, produces largely viable data for calculation of useful time-based retention variables. Moreover, the ability of the available covariates included in the Cox regression model to predict risk of leaving a position in location was significant and meaningful. The primary purpose of using employee records as a data source was to describe retention for different allied health professions and across different geographic regions, and this study has largely been successful in achieving those aims.
Conclusion
This study of the regional, rural and remote public sector allied health workforce in Southern Queensland has revealed important information about length of stay in location across different allied health professions and geographic regions. Employees in four professions (physiotherapy, speech pathology, occupational therapy, dietetics) are at higher retention risk compared with other allied health professions, as are those working in rural and remote areas when compared to those working in the regional city. Starting age, starting pay grade and position type were also found to influence retention risk. These findings have important implications as to where and when interventions targeting retention might be most effective.
Acknowledgements
The authors acknowledge the participating health services for allowing de-identified employee records to be used as data for this article. The authors also acknowledge contributions to data cleaning and coding from Mr Matthew Lendrum, and for feedback on an initial draft from Associate Professor Geoffrey Argus and Dr Adam Hulme. Southern Queensland Rural Health is funded through the Commonwealth Rural Health Multidisciplinary Training scheme.
Funding
We acknowledge the Toowoomba Hospital Foundation and Pure Land Learning College for a research grant that partially supported the work (grant number THF 2022 R1-04).
Conflicts of interest
The authors report no conflicts of interest.
AI disclosure statement
Artificial intelligence (AI)-assisted technologies (such as large language models (LLMs), chatbots and image creators) were not used in the writing of the manuscript, production of images or graphical elements of the article, or in the collection and analysis of data.