


Introduction
There is now substantial international evidence supporting the role of the arts in promoting health and wellbeing. However, the translation of this evidence into sustained, community-embedded practice beyond formal healthcare settings remains limited1. A major synthesis of more than 3000 studies commissioned by the WHO Regional Office for Europe2 identified consistent evidence that arts engagement contributes across the health continuum. The review highlighted the role of the arts in influencing core determinants of health, supporting health promotion, preventing mental illness and age-related functional decline, assisting in the management of mental illness and non-communicable diseases, and enhancing experiences of acute and end-of-life care2.
At an individual level, creative engagement has been associated with reduced stress, improved mood, enhanced immune function, and reductions in physiological risk markers such as blood pressure3. Within clinical settings, exposure to the arts has been linked to improved patient experiences and, in some contexts, faster recovery3. Together, these findings suggest that arts engagement represents a potentially scalable population health strategy1.
Beyond individual health outcomes, there is growing recognition of the role of arts and cultural activity in strengthening communities4,5. In rural contexts in particular, arts engagement has been associated with community revitalisation, social cohesion, cultural identity and local economic participation4,6. These factors align with established determinants of community resilience, including social connectedness, collective efficacy, sense of belonging and opportunities for local engagement. Community resilience is increasingly recognised as an important environmental and social context underpinning population health4,6.
The relevance of such approaches is especially pronounced in rural and remote communities, which often experience limited access to healthcare and social services within environments shaped by social, economic and geographic disadvantage7,8. Conventional responses to these inequities have largely focused on extending or adapting external services to address gaps in care. While necessary, these approaches may not fully address the broader social determinants that influence health and wellbeing in small communities9,10.
Increasingly, rural communities are adopting locally driven strategies to build capacity, strengthen resilience and enhance wellbeing using existing community assets. Arts-based initiatives may represent one such asset-based approach, offering accessible, culturally adaptable and community-owned opportunities to support both individual and collective health6,11.
Successful rural Australian arts-in-health projects thrive by fostering community connection, reducing isolation and improving mental wellbeing through accessible, culturally relevant and collaborative activities. Through painting and other creative outlets, participants are finding new ways to cope with the challenges of their conditions, fostering a sense of community and reducing isolation. Programs like this, and other arts events like Arts in the Sticks in the Limestone Coast in south-eastern South Australia and other activities around rural Australia, illustrate how creativity can become a lifeline, not only providing therapeutic benefits but also giving people a sense of connection and control over their wellbeing9-11.
Despite growing policy and research interest, there remains limited empirical evidence examining the measurable health, behavioural and economic impacts of community-led arts initiatives in rural and remote settings2,3.
The Pinnaroo Project emerged as a grassroots response to limited local access to health services in a remote Australian community. Developed and led by the community, the initiative sought to embed creative activity into everyday life as a means of strengthening wellbeing, social connection and resilience. This article presents a comprehensive evaluation of the project, providing a real-world example of a community-driven arts-in-health model and its potential contribution to improving health outcomes in a rural setting11.
Aim
The Pinnaroo Project aimed to improve the health and wellbeing of residents through sustained, community-led engagement in a diverse range of arts and creative activities. A further aim was to rigorously evaluate health, behavioural and economic outcomes associated with participation, and to generate locally relevant evidence on the role of arts engagement in supporting community health11.
Objectives
The specific objectives were:
- Describe participation patterns, attendance and participant-reported experience measures across a range of arts and creative activities.
- Characterise the demographic profile, health status, wellbeing indicators, lifestyle behaviours and self-care practices of the broader community.
- Examine associations between participation in arts activities and clinical health outcomes, mental wellbeing, health behaviours, quality of life and health service utilisation.
- Assess the economic benefit and return on investment associated with the initiative.
- Develop and demonstrate a robust evaluation framework for assessing the health and wellbeing impacts of community-led arts initiatives in rural settings.
Methods
Study design
To address the study aims and objectives, a longitudinal, prospective, repeated cross-sectional design was used over a 3-year period.
Setting
Pinnaroo is a rural community in South Australia located 243 km east of the capital city, Adelaide12,13. The community is situated on the traditional lands of the Ngarkat People12 and was first colonised by Europeans in 1869. The community’s name is derived from a Ngarkat word meaning ‘big man’. At the 2021 census, the locality of Pinnaroo had a population of 768 residents living in and around the community centre, with a broader surrounding community of 2223 people12. Pinnaroo is classified as remote, indicating a small population and limited access to services13.
Pinnaroo is an agricultural community producing potatoes, wheat, barley, sheep, turf and ancient grains. The community was recognised as the 2020 Agricultural Town of the Year by the South Australian Department of Primary Industries and Regions11.
Healthcare services are limited. Two part-time GPs and a nurse practitioner provide primary clinical care. The local hospital includes an emergency room and an aged care facility, both operating as nurse-led services. A pharmacist is available five half-days per week. There are no regular onsite specialist health services. Over the past two decades, the community has experienced significant challenges, including drought, bushfire, outward migration and, more recently, the COVID-19 pandemic.
Recruitment and exposure
The Pinnaroo Project was led by a board of local community members (Mallee Arts) including an expert regional art director, with day-to day workshop management by an employed workshop coordinator. Full details and acknowledgement of the community leadership are detailed on the project website11. The Pinnaroo Project partnered with creative arts experts and professional artists to deliver a wide range of activities, including creative writing, ceramics, metalwork, clay pottery, jewellery making, silk screening, lotus printing, photography and cake decorating. Full details of all creative activities and artists are present on the project website11. The partnership also included Flinders University, which conducted the health outcomes evaluation.
Data were collected within the community from volunteers at community group meetings, primary and secondary schools, the local library, workplaces, the ambulance station, the supermarket and at the art hub located within the community centre (Fig 1)11.
Participants
All residents aged 8 years and over were eligible to participate, regardless of their level of involvement in art activities. Children aged 8–17 years participated with parental consent. Recruitment was guided by the project steering committee through local advertising and social media. The project aimed to achieve a sample broadly representative of the community profile based on Australian Bureau of Statistics census data12 (Fig1).
Data collection
Evaluation and follow-up were conducted over 3 years (2021–2023). The years 2019 and 2020 were used for preliminary community engagement, co-design processes and face-validity testing of evaluation tools.
Variables
The primary outcome was determined by the community, who identified the effect of arts participation on mental health as the key outcome of interest. Additional variables included
adult depression and adolescent mental health, anthropometric risk factors, overall self-rated health and quality of life, health behaviours (nutrition, alcohol and drug use, and physical activity), health service use and health literacy, and study participant demographics.
Data sources and measurements
Data were collected using Qualtrics XM (Qualtrics https://www.qualtrics.com) or using paper-based forms when assistance was required. Measures included demographic and clinical history questionnaires informed by Australian Bureau of Statistics Census items and Australian Institute of Health and Welfare survey questions7,12.
Anthropometric measures included blood pressure, pulse, BMI (height and weight), waist circumference measurements, and point-of-care testing for total cholesterol and non-fasting blood glucose using finger-prick samples.
Validated health and wellbeing instruments, approved through community pilot testing, included:
- depression: <18 years: Strengths and Difficulties Questionnaire14; ≥18 years: Patient Health Questionnaires (PHQ-2 and PHQ-9)15
- medication adherence: Adherence in Chronic Diseases Scale16
- health literacy: ≥18 years: BRIEF Health Literacy Screening Tool17
- quality of life: ≥18 years: EQ-5D-5L, EuroQoL Group Quality of Life Instrument Version 5 (EQ-5D-5L)18
- health service utilisation: four questions developed by the project co-design advisory group to assess service use over the previous 12 months
- healthy eating and nutrition: 8–13 years: informed by the Modified Child Diet Questionnaire19; ≥14 years: informed by Heart Foundation healthy eating guidelines20
- alcohol and illicit drug use: 14–17 years: informed by Alcohol Screening and Brief Intervention for Youth21,22
- daily physical activity: ≥18 years: International Physical Activity Questionnaire (short form)23
- alcohol use (adults): ≥18 years: informed by the AUDIT questionnaire24
- smoking: 14–17 years: informed by Alcohol Screening and Brief Intervention for Youth; ≥18 years: researcher-developed questions to identify smoking status25.
Bias
Several strategies were used to minimise bias:
- Data were collected by university research team members external to the community.
- With the exception of the project leads, data collection teams differed each year.
- Data collection occurred at the same time and season each year (August–September).
- Statistical analyses were conducted by an independent university-based statistical team external to both the community and project implementation team.
Sample size
Sample size calculations were based on the primary endpoint of a reduction in mean depression score (PHQ-9 and Strengths and Difficulties Questionnaire). To detect a 1.3-point decrease in mean depression score in the arts participation subgroup compared with non-arts participants3, assuming a standard deviation of 3.2, a 1:1 ratio of participants to non-arts participants, an eligible population of 714 residents aged ≥8 years, 80% power and a 5% significance level, a minimum sample of 192 participants per year was required (96 per group), allowing for a 10% attrition rate. Figure 1 shows that the required sample size was achieved in 2021, with expected 10% attrition in 2022 and 2023.
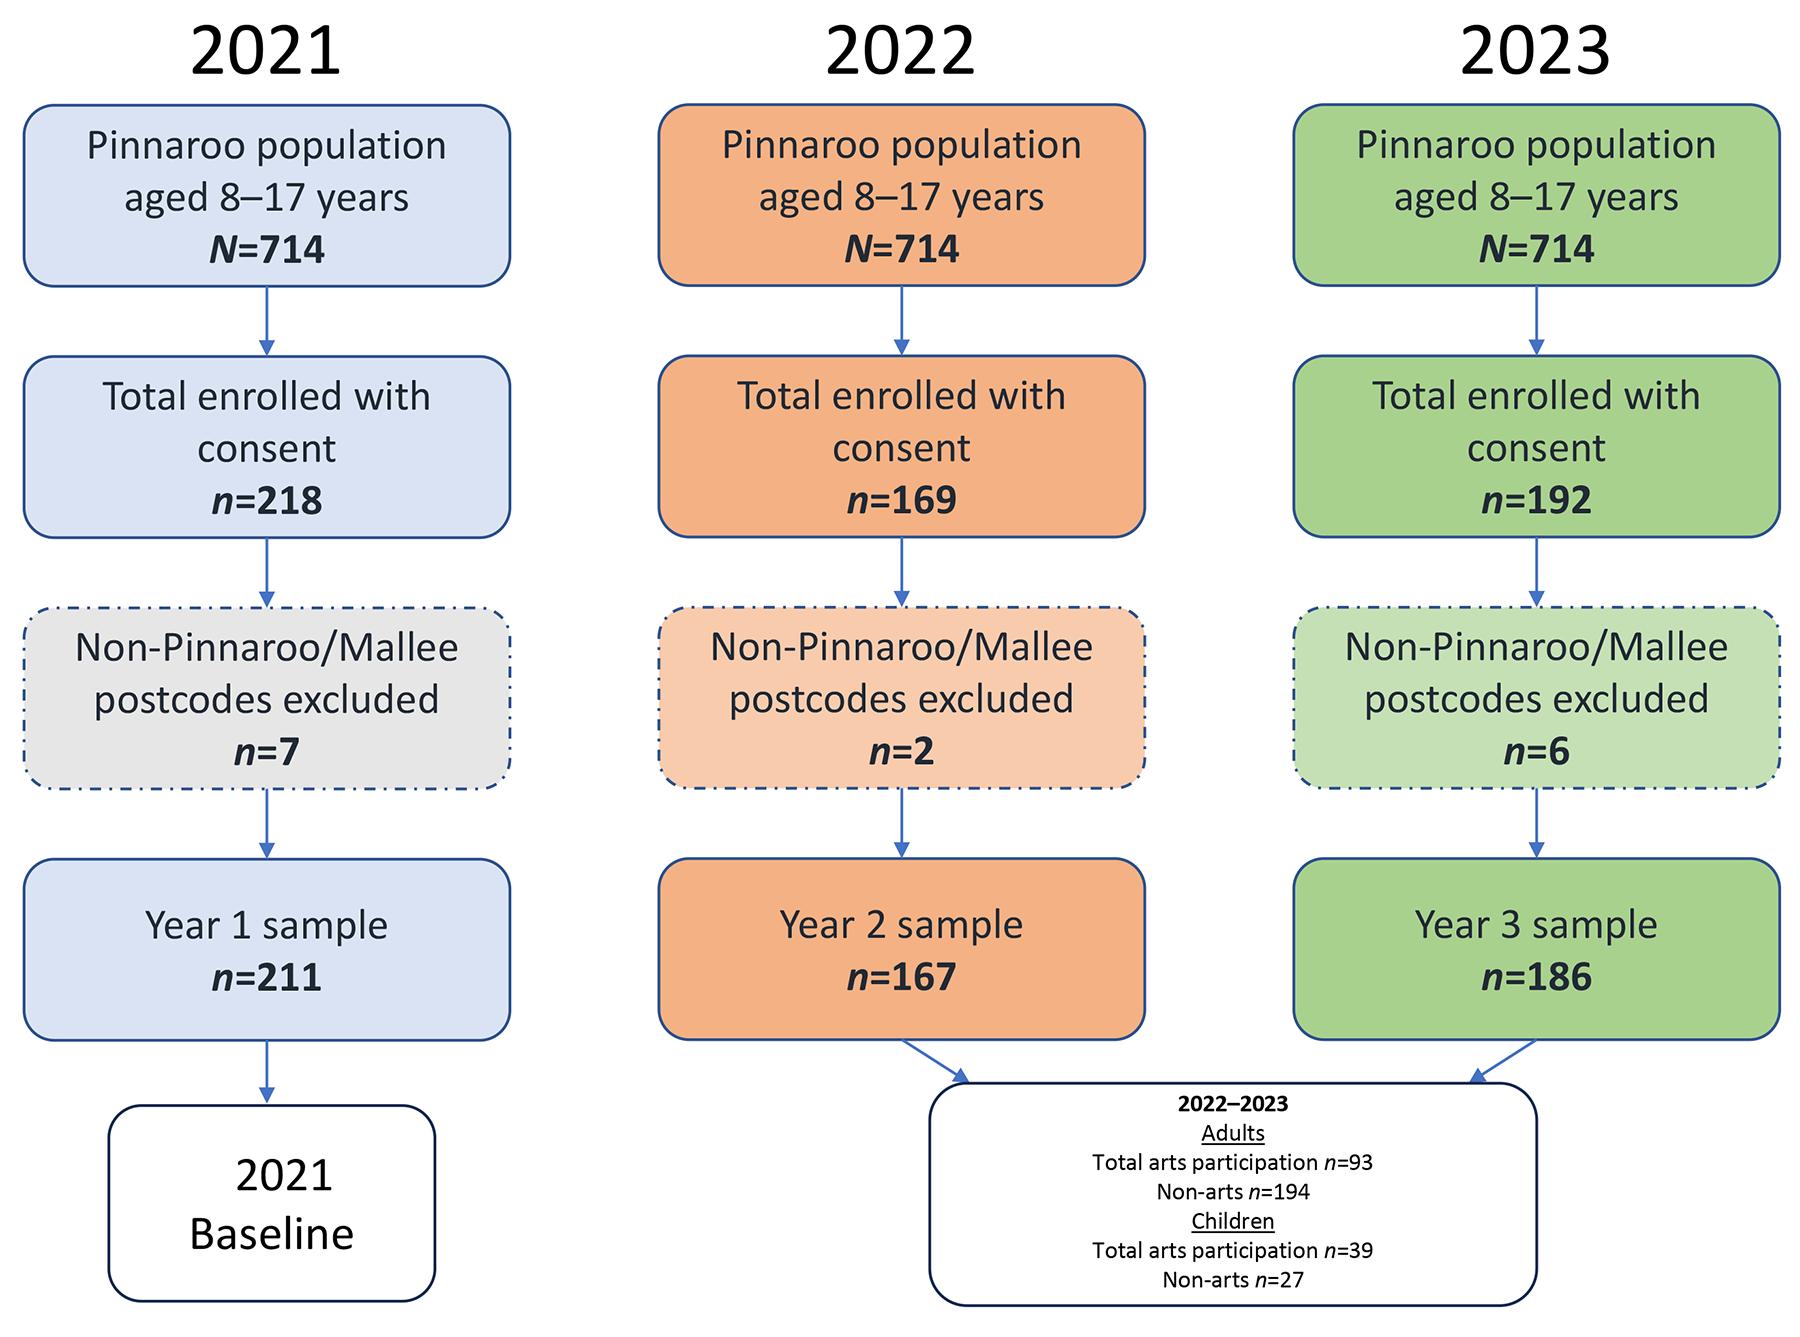 Figure 1: Pinnaroo Project consort flowchart.
Statistical analysis
Data analysis
Data were exported from Qualtrics XM using Excel into STATA SE v18.0 (StataCorp; https://www.stata.com) for analysis. Participant characteristics (demographic, clinical and risk factors) across the 3 years were summarised descriptively using percentages, medians and interquartile ranges. Representativeness of the sample relative to the 2021 Pinnaroo Australian Bureau of Statistics census community profile was also assessed12.
Missing data
Missing data, including items not collected from children, were reported in the demographic and clinical characteristics. As participation was voluntary, study participants could elect not to provide personal information. Data imputation was not undertaken, as the proportion of missing data was small (≤5%) for most covariates.
Primary and secondary outcomes
Associations between independent variables (health assessments and clinical factors) and the dependent variable (participation v non-participation in arts activities) were examined using χ2 tests, Fisher’s exact tests and Wilcoxon rank–sum tests, as appropriate. Multivariate logistic regression analyses were conducted to examine the effect of arts participation on self-reported depression, quality of life, hypertension and healthy eating, adjusting for age, gender, BMI, smoking and alcohol use. Model selection was performed using a stepdown procedure, and model fit was assessed using the Bayesian information criterion. Associations were reported as odds ratios (ORs) with 95% confidence intervals (CIs) and corresponding p-values. Sensitivity analyses were conducted separately for male-only and female-only study participants due to observed gender differences in arts participation. A subgroup analysis was also undertaken comparing health and wellbeing outcomes among participants involved specifically in Pinnaroo Project activities. Participant satisfaction and participant-reported experience measures were summarised using descriptive statistics. Responses to open-ended questions were analysed thematically and illustrated using selected quotations.
Economic evaluation
The economic evaluation assessed project outcomes from an economic value perspective4. This included:
- formal short-term direct economic outcomes (economic footprint of activities)
- informal direct economic outcomes, including induced effects and the value of volunteer time
- potential longer term economic impacts, including workforce retention, productivity and broader quality-of-life benefits for the community.
The objective was to provide indicative quantification of outcomes in terms of turnover, income generation, employment and other forms of value creation. Where outcome data were not directly available, informed assumptions were applied. The modelling was indicative and based on general and, where appropriate, conservative assumptions supported by survey data and the literature3,4. This included:
- number of workshops/events/sessions
- average length of commitment
- average price per workshop/event/session
- average attendance at workshops/events/sessions and total attendances (assuming that participants attended an average of five times – this implies that around 50% of people from the community and surrounding areas attended at least once)
- annual ticket revenue
- assumed additional operational spend on presenting workshops (funded out of funding at 50% of tickets)
- average assumed spend of artists per day spent in the region
- number of workshops by the proportion of presenters from outside of region by spend while in the region (adjusted down by 20% to allow for direct imports).
Therefore, the total created spend in the region by the hosting of the program is approximately A$63,000. This is input into an economic model of the Southern Mallee region and estimated to support new incomes (compensation of employees and gross operating surplus for businesses) of A$32,000.
Ethics approval
Ethics approval was obtained from the Flinders University Human Research Ethics Committee (ID 4224) on 14 July 2020.
Results
Objective 1: Participation, feedback and satisfaction
The Pinnaroo Project delivered a diverse program of creative arts workshops led by professional artists, comprising 57 distinct events delivered across 106 workshop sessions during the evaluation period. Activities were accessible to all genders and age groups. Full details are present on the project website11.
Community engagement in arts activities increased substantially over time. Among adults participating in local arts activities, median annual hours increased from 12.5 hours in 2022 (interquartile range (IQR) 5–47) to 37 hours in 2023 (IQR 9–112; p≤0.05). When broader arts engagement was considered (including both Pinnaroo Project and external arts activities), median annual hours increased from 11 hours/year (IQR 4–40) in 2022 to 23.25 hours/year (IQR 4–78) in 2023 (p=0.04) (Fig2).
Across the 3-year period, 616 feedback forms were collected, demonstrating high levels of participant satisfaction (mean satisfaction 90%). Reported benefits included skill development, enhanced social connections, and perceived reductions in stress and depressive symptoms (Fig2).
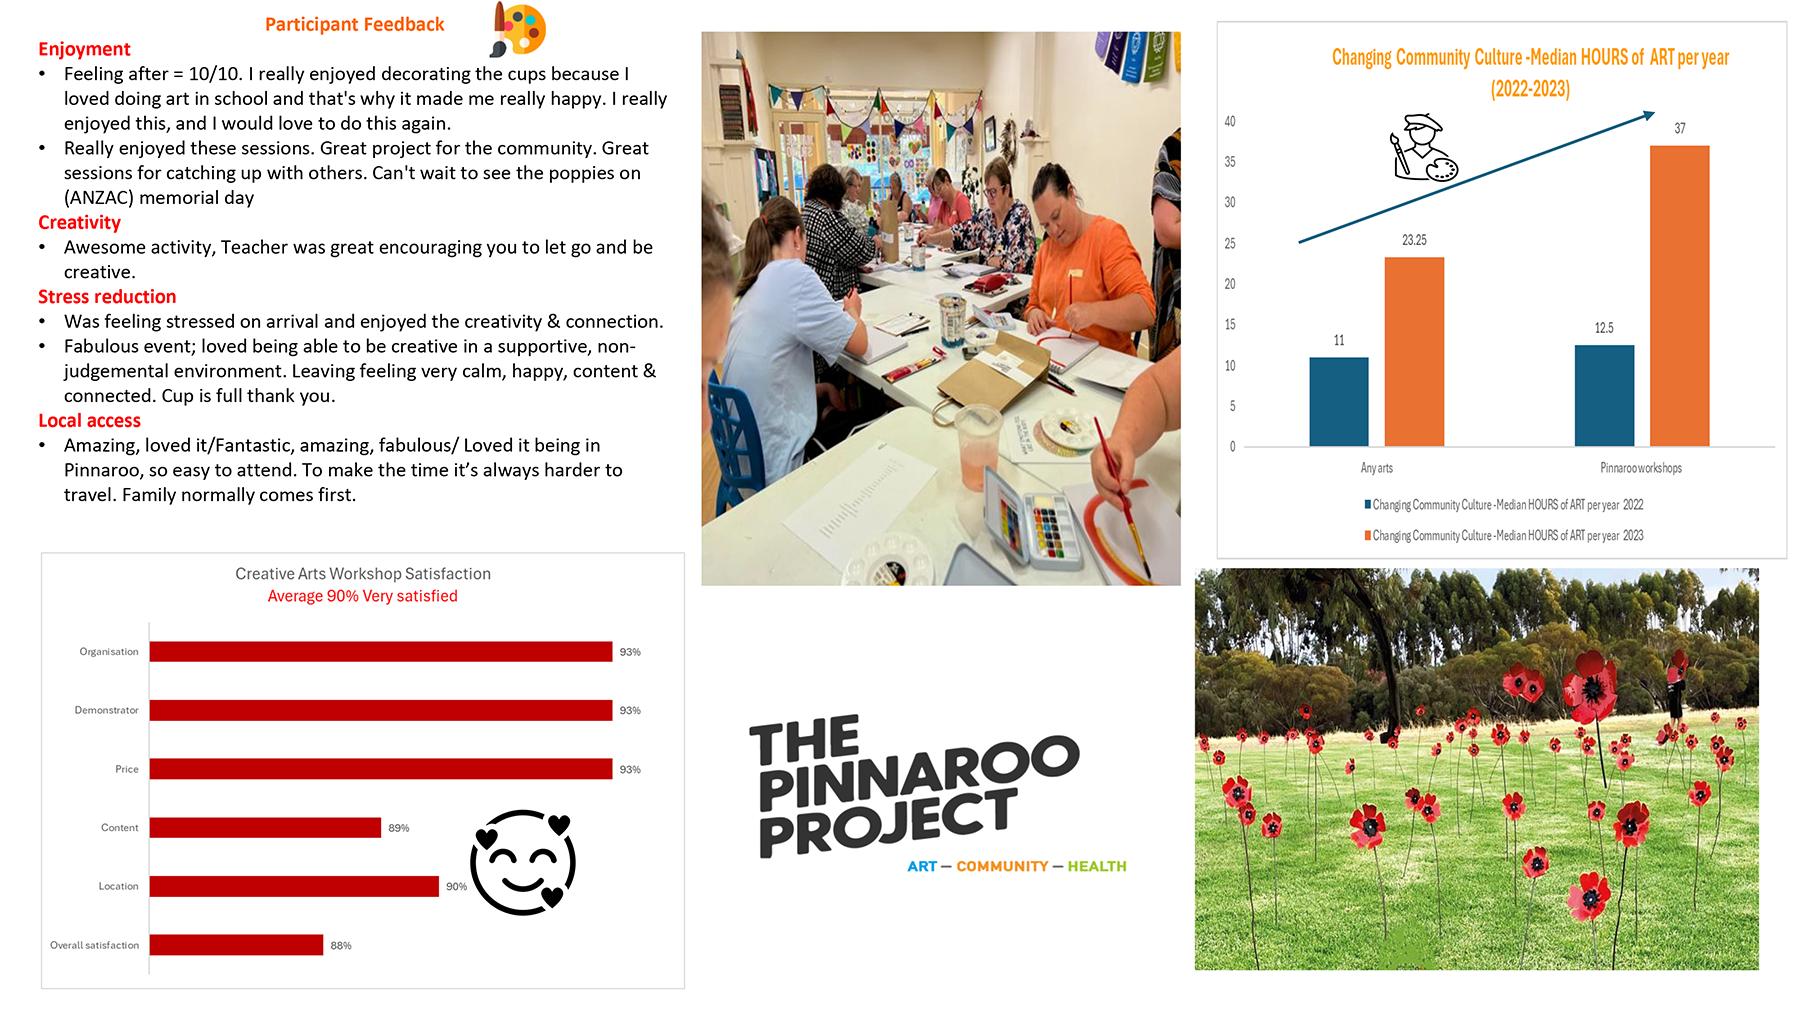 Figure 2: Pinnaroo Project participation, feedback and satisfaction (photos with permission https://thepinnarooproject.com.au).
Objective 2: Sociodemographic, health and wellbeing characteristics of the community
Study participant demographics and clinical characteristics are presented in Table 1. The median age of health assessment participants was 39 years, and the sample was predominantly female (>50%). Compared with the 2021 census profile, combined data for 2022 and 2023 showed there was a higher proportion of teenagers and a lower proportion of younger children (children under 8 years). Most study participants (70%) had resided in the Pinnaroo region for more than 5 years. No significant demographic changes were observed over the 3-year evaluation period, except for a decrease in participants reporting Caucasian ancestry and primary school education levels in 2023.
Table 1: Pinnaroo Project study participant demographic and clinical characteristics compared to census data (2021–2023)
|
Characteristic |
Variables |
2021
|
2022
|
2023 n (%)(N=186) |
p-value 2021 v 2022 |
p-value 2021 v 2023 |
|---|---|---|---|---|---|---|
|
Gender |
Female (ABS 47%)† |
113 (53.6) |
97 (58.1) |
103 (55.4) |
0.29 |
0.76 |
|
Age (years) |
8–13 (ABS 11%)† |
34 (16.1) |
31 (18.6) |
21 (11.3) |
0.47 |
0.36 |
|
14–17 (ABS 6%)† |
5 (2.4) |
7 (4.2) |
7 (3.8) |
|||
|
≥18 |
172 (81.5) |
129 (77.2) |
148 (79.6) |
|||
|
Missing |
0 (0) |
0 (0) |
10 (5.4) |
|||
|
Cultural identity |
Caucasian |
156 (73.9) |
113 (67.7) |
125 (67.2) |
<0.001*** |
<0.001*** |
|
Aboriginal |
5 (2.4) |
7 (4.2) |
23 (12.4) |
|||
|
Other |
50 (23.6) |
47 (28.2) |
38 (20.5) |
|||
|
Education |
Primary education |
26 (12.3) |
24 (14.4) |
7 (3.8) |
0.75 |
0.022 |
|
Secondary education |
76 (36.0) |
55 (32.9) |
67 (36.0) |
|||
|
Tertiary education (ABS 32%)† |
109 (51.7) |
88 (52.7) |
91 (48.9) |
|||
|
Not collected (children) |
0 (0) |
0 (0) |
21 (11.3) |
|||
|
Employment |
Full-time employed (ABS 32%)† |
109 (51.7) |
78 (46.7) |
101 (54.3) |
0.36 |
0.089 |
|
Part-time employed |
35 (16.6) |
20 (12.0) |
19 (10.2) |
|||
|
Retired |
22 (10.4) |
24 (14.4) |
25 (13.4) |
|||
|
Unemployed |
6 (2.8) |
7 (4.2) |
13 (7.0) |
|||
|
Not collected (children) |
39 (18.5) |
38 (22.8) |
28 (15.1) |
|||
|
Marital status |
Married (ABS 38%)† |
127 (60.2) |
90 (53.9) |
97 (52.2) |
0.45 |
0.12 |
|
Separated/divorced/widowed |
16 (7.1) |
17 (10.2) |
19 (10.2) |
|||
|
Never married |
30 (14.2) |
22 (13.2) |
42 (22.6) |
|||
|
Not collected (children) |
39 (18.5) |
38 (22.8) |
28 (15.1) |
|||
|
Time lived in Pinnaroo/Mallee (years) |
<5 |
39 (18.5) |
37 (22.2) |
51 (27.4) |
0.41 |
0.060 |
|
≥5 |
171 (81.5) |
127 (76.1) |
135 (72.6) |
|||
|
Missing |
0 (0.0) |
3 (1.8) |
0 (0.0) |
|||
|
Born in Pinnaroo |
Yes |
104 (49.3) |
81 (48.5) |
87 (46.8) |
0.88 |
0.62 |
|
Living with ... |
Family and/or friends |
150 (71.1) |
112 (67.1) |
138 (74.2) |
0.037* |
0.002** |
|
Live alone (ABS 18%)† |
27 (12.8) |
19 (11.4) |
18 (9.7) |
|||
|
Other |
34 (16.1) |
36 (21.6) |
30 (16.1) |
|||
|
Family medical history |
None |
25 (14.5) |
16 (12.4) |
47 (29.7) |
0.26 |
0.011* |
|
Heart disease or stroke |
72 (41.9) |
48 (37.2) |
53 (33.5) |
|||
|
Cancer |
29 (16.9) |
33 (25.6) |
24 (15.2) |
|||
|
Diabetes |
23 (13.4) |
12 (9.3) |
15 (9.5) |
|||
|
Anxiety/depression |
15 (8.7) |
9 (7.0) |
7 (4.4) |
|||
|
Unknown |
8 (4.7) |
11 (8.5) |
12 (7.6) |
|||
|
Personal medical history |
None |
98 (57.0) |
74 (57.4) |
101 (63.9) |
0.14 |
0.067 |
|
Heart disease or stroke |
14 (8.1) |
11 (8.5) |
15 (9.5) |
|||
|
Cancer |
3 (1.7) |
9 (7.0) |
9 (5.7) |
|||
|
Diabetes |
13 (7.6) |
5 (3.9) |
9 (5.7) |
|||
|
Anxiety/depression |
44 (25.6) |
30 (23.3) |
24 (15.2) |
*p≤0.05, **p<0.01, ***p<0.001
† ABS Community Profile data 2021.
ABS, Australian Bureau of Statistics.
Adult health assessment
Adults reported a significantly healthier family medical history in 2023 (30% reporting no history of major disease) compared with 2021 (15%) and 2022 (12%; p=0.011) (Table 2).
Self-reported depression prevalence improved over time, with the proportion reporting no depression increasing from 67% in 2021 to 76% in 2023 (p≤0.05). Alcohol consumption frequency of 2–4 times per week decreased significantly from 48% in 2021 to 33% in 2023 (p=0.014). Hypertension clinical prevalence decreased from 26% in 2021 to 19% in 2023; however, this change was not statistically significant (Table 2).
Fruit consumption exceeded national averages, with 62% of participants consuming at least one to two servings per day in 2023. Between 42% and 45% met vegetable intake recommendations. However, 75–81% of adults were overweight or obese (BMI>25), exceeding reported national rural obesity rates. The proportion of participants with elevated cholesterol increased from 36% in 2021 to 44% in 2023. Self-reported physical activity levels varied across years and age groups. Self-reported quality of life improved significantly over the evaluation period, increasing from 64% reporting high quality of life in 2021 to 89% in 2023 (p<0.001).
Child health assessment
Among children aged ≥8 years, the proportion reporting a borderline to cause-for-concern total difficulties score in the Strengths and Difficulties Questionnaire increased to 50% in 2023 compared with 33% and 29% in 2021 and 2022, respectively.
This difference was not statistically significant (p=0.19). For 2022 and 2023, children demonstrated higher fruit and vegetable consumption compared with national averages, with more than 64% meeting fruit recommendations and 33–39% meeting vegetable recommendations7.
Across the 3 years, more than 80% of children consumed more than one serve of fruit daily, and 33–39% consumed more than three serves of vegetables daily.
Twenty-four per cent of children reported engaging in moderate to vigorous physical activity on 1 to 2 days per week. Across the 3 years of evaluation, children reported two to five (mean) allied health visits and one or two (mean) hospital admissions in the previous 12 months.
Health-related quality of life among children was consistently high across the evaluation period (80% in 2021, 90% in 2022 and 86% in 2023; p<0.001) and exceeded the national rural average of 25% (95%CI 18–33%) reporting high health-related quality of life in 20237.
Objective 3: Association between arts participation and health outcomes
Between 66% (122 out of 186 participants in 2023) and 75% (126 out of 167 participants in 2022) of health assessment participants reported engagement in arts activities during the evaluation period. Participation differed by gender, with higher engagement among females (64%; p<0.001).
Table 2: Pinnaroo Project study participant health assessment (adults and children), 2021–2023
| Characteristic | Variables |
2021 n (%)/median (IQR) (N=211) |
2022 n (%)/median (IQR) (N=167) |
2023 n (%)/median (IQR) (N=186) |
p-value |
|---|---|---|---|---|---|
| Adults (≥18 years; N=459) | (adult n=172) | (adult n=129) | (adult n=158) | ||
| Depression (PHQ-9 score) | None (0–4) | 115 (66.9) | 87 (67.4) | 120 (76.4)† | 0.38 |
| Mild (5–9) |
28 (16.3) |
21 (16.3) | 21 (13.4) | ||
| Moderate (10–14) |
20 (11.6) |
16 (12.4) | 11 (7.0)† | <0.05* | |
| Moderately severe (15–19) |
7 (4.1) |
4 (3.1) | 4 (2.5)† | ||
| Severe (20–27) |
2 (1.2) |
1 (0.8) | 1 (0.6)† | ||
| Smoking status | 26 (15.1) | 10 (7.8)† | 19 (12.0)† | 0.15 | |
| Alcohol days | Never | 17 (9.9) | 25 (19.4) | 27 (17.1)† | 0.014* |
| 1–4 times per month |
73 (42.4) |
62 (48.1) | 79 (50.0) | ||
| 2–4 times per week |
82 (47.7) |
42 (32.6) | 52 (32.9)† | ||
| Illegal drugs | 6 (3.5) | 3 (2.3) | 10 (6.3) | 0.25 | |
| Fruit serves/day ≥1 | 108 (63)† | 81 (62.8)† | 98 (62.1)† | 0.99 | |
| Vegetable serves/day >3 | 77 (44.8) | 54 (41.9) | 71 (44.9) | 0.84 | |
| Physical activity (adults) 150 min (or 75 min vigorous activity) per week | 18–64 years | 89 (76.7) | 44 (62.9) | 49 (46.7) | <0.001*** |
| >65 years |
8 (6.9) |
10 (14.3) | 5 (4.9) | 0.069 | |
| BMI >25 kg/m2 | 129 (76.3) | 73 (81.2) | 118 (75.2) | 0.44 | |
| Waist circumference >94 cm (males), >80 cm (females) | 134 (80.3) | 109 (87.9) | 130 (83.4) | 0.22 | |
| Blood pressure >140 systolic/>90 diastolic (hypertension) | 45 (26.3) | 26 (20.2) | 29 (18.6)† | 0.20 | |
| Total cholesterol >5.17 mmol/L | 59 (36.2) | 60 (51.3) | 68 (43.9) | 0.041* | |
| Blood glucose (non-fasting) ≥7.9 mmol/L | 16 (9.4) | 22 (19.0) | 18 (11.5)† | 0.048* | |
| GP/nurse practitioner visits | –¶ | 4 (2–6) | 3 (2–6)† | 0.17 | |
| Allied health visits | –¶ | 2 (1–6) | 3 (2–5) | 0.77 | |
| Hospital ED visits | –¶ | 1 (1–2) | 1 (1–2) | 0.48 | |
| Hospital admissions | –¶ | 1 (1–2) | 1 (1–3) | 0.47 | |
| Quality of life (EQ-5D-5L) | High (6–10) | 110 (64.0) | 108 (83.7) | 141 (89.2) | <0.001*** |
| Neutral (5) |
40 (23.3) |
14 (10.9) | 11 (7.0) | ||
| Low (0–4) |
22 (12.8) |
7 (5.4) | 6 (3.8) | ||
| Children (8–17 years; N=105) | (child n=39) | (child n=38) | (child n=28) | ||
| Mental health: Strength and Difficulties Questionnaire total difficulties score of borderline to ‘cause for concern’ (16–40) | 13 (33.3) | 11 (28.9)† | 14 (50.0) | 0.19 | |
| Fruit serves/day ≥1 | 34 (87.1) | 35 (89.7) | 23 (82.1) | 0.48 | |
| Vegetable serves/day ≥3 | 13 (33.3) | 14 (36.8) | 11 (39.3) | 0.88 | |
| Moderate-to-vigorous activity >1 h, 7 days per week | 9 (23.1) | 8 (21.1) | 6 (21.4) | 0.96 | |
| GP/nurse practitioner visits | –¶ | 2 (1.5–2.5) | 6.5 (2–15) | 0.19 | |
| Allied health visits | –¶ | 5 (2–8) | 2 (2–2) | 0.11 | |
| Hospital ED visits | –¶ | 1 (1–2) | 1 (1–8) | 0.80 | |
| Hospital admissions | –¶ | 1 (1–1) | 1 (1–1) | ||
| Overall self-rated health (0 ‘very unsatisfied’ to 10 ‘very satisfied’) | High (6–10) | 31 (79.5) | 34 (89.5)† | 24 (85.7)† | 0.60 |
| Neutral (5) |
6 (15.4) |
3 (7.9) | 4 (14.3) | ||
| Low (0–4) |
2 (5.1) |
1 (2.6) | 0 (0.0) |
*p≤0.05, **p<0.01, ***p<0.001
† Clinical improvements.
¶ Healthcare utilisation data not collected at baseline 2021.
EQ-5D-5L, EuroQoL Group Quality of Life Instrument Version 5. IQR, interquartile range. PHQ, Patient Health Questionnaire.
Primary outcomes
A significant decline in self-reported depression (PHQ≥5, indicating mild to severe symptoms) was observed among adults who participated in the arts, decreasing from 31% in 2022 to 19% in 2023 – a reduction of 12 percentage points (p=0.03). In contrast, adults who did not participate in the arts showed a smaller and non-significant change of six percentage points (from 36% to 30%; p=0.53) over the same period (Table 3).
Art therapy had a clinical but non-significant effect on reducing reported moderate to severe depression in the adult arts participant subgroup over the evaluation period (25%) compared to the non-arts subgroup (11%; p=0.11).
In multivariable analyses after adjusting for demographic and clinical characteristics, arts participation was associated with a 62% lower likelihood of depression compared with non-arts participation (OR=0.38, 95%CI 0.19–0.79; p=0.01) (Table 4). A sensitivity analysis showed female arts participants demonstrated a 70% lower likelihood of depression (OR=0.30; 95%CI 0.11–0.82; p=0.02) compared to non-art female participants. No significant effect was found among male arts participants compared to non-arts participants.
Among children, a trend towards increased reported mental health difficulties was observed in arts participants; however, the non-arts comparison subgroup was small (n=6), limiting interpretation.
Table 3: Primary outcomes: Pinnaroo Project study participant health assessment versus non-arts participation (adults and children), 2021–2023
| Characteristic | Variables |
Arts participation overall n (%) |
Arts participation 2022 n (%) |
Arts participation 2023 n (%) |
|||
|---|---|---|---|---|---|---|---|
| No | Yes | No | Yes | No | Yes | ||
| Primary outcomes adults (≥18 years) (N=574) | (adult n=99) | (adult n=188) | (adult n=39) | (adult n=90) | (adult n=60) | (adult n=98) | |
| Depression (PHQ-9 score) | p=0.27 | p=0.69 | p=0.03 | ||||
| None (0–4) |
67 (67.7) |
141 (75.0) | 25 (64.1) | 62 (68.9) | 42 (70.0) 6% increase | 79 (81.0) 11% increase | |
| Mild (5–9) |
15 (15.2) |
27 (14.4) | 6 (15.4) | 15 (16.7) | 9 (15.0) | 12 (12.0) 5% decrease | |
| Moderate to severe (%u226510) |
17 (17.2) |
20 (10.6) | 8 (20.5) | 13 (14.4) | 9 (15.0) | 7 (7.0) 7% decrease | |
| Primary outcomes children (8–17 years) (N=132) | (child n=6) | (child n=60) | (child n=2) | (child n=36) | (child n=4) | (child n=24) | |
| Depression and anxiety (Strength and Difficulties Questionnaire total difficulties score) | p=0.96 | p=0.65 | p=0.98 | ||||
| Normal (0–15) |
4 (66.6) |
37 (61.6) | 2 (100) | 25 (69.4) | 2 (50.0) | 12 (50.0) | |
| Borderline (16–19) |
1 (16.7) |
13 (21.6) | 0 (0) | 6 (16.7) | 1 (25.0) | 7 (29.2) | |
| Cause for concern (20–40) |
1 (16.7) |
10 (16.7) | 0 (0) | 5 (13.9) | 1 (25.0) | 5 (20.8) | |
Table 4: Multivariate logistic regression analysis of Pinnaroo Project arts participation versus non-arts participation (adults)†
| Characteristic | Variables | Odds ratio | 95% confidence interval | p-value |
|---|---|---|---|---|
| Depression | No | Reference | ||
| Yes |
0.38 |
(0.19–0.79) | 0.01* | |
| Gender | Female | Reference | ||
| Male |
0.37 |
(0.20–0.67) | 0.001*** | |
| Smoking status | No | Reference | ||
| Yes |
0.73 |
(0.31–1.71) | 0.46 | |
| BMI (kg/m2) | Underweight to healthy weight | Reference | ||
| ≥Overweight |
1.90 |
(0.96–3.73) | 0.07 | |
| Fruit serves/day | <1 | Reference | ||
| ≥1 |
1.07 |
(0.60–1.93) | 0.81 | |
| Vegetable serves/day | ≤2 | Reference | ||
| ≥3 |
1.68 |
(0.91–3.10) | 0.10 | |
| Blood pressure | Normal/high-normal | Reference | ||
| Hypertension |
1.13 |
(0.54–2.38) | 0.74 | |
| Age (years) | 1.00 | (0.98–1.02) | 0.83 | |
| Quality of life (EQ-5D-5L) | 1.10 | (0.94–1.29) | 0.22 | |
| Overall self-rated health (0 ‘very unsatisfied’ to 10 ‘very satisfied’) | 0.90 | (0.74–1.09) | 0.27 |
*p≤0.05, **p<0.01, ***p<0.001
† 91% of children participated in art in 2022 and 2023. Not enough participants were in the ‘no art’ child group for regression analysis.
EQ-5D-5L, EuroQoL Group Quality of Life Instrument Version 5.
Table 5: Secondary outcomes: Pinnaroo Project study participant health assessment versus non-arts participation (adults and children), 2021–2023
| Characteristic | Variables |
Non-arts participant n (%)/median (IQR) |
Arts participant n (%)/median (IQR) |
||
|---|---|---|---|---|---|
| Secondary outcomes adults (≥18 years; N=287) | (adult n=99) | (adult n=188) | p-value | ||
| Smoking status | No | 85 (85.9) | 173 (92.0) | 0.010* | |
| Yes |
14 (14.1) |
15 (8.0) | |||
| Alcohol days | Never | 24 (24.2) | 28 (14.9) | 0.079 | |
| 1–4 times per month |
49 (49.5) |
92 (48.9) | |||
| 2–4 times per week |
26 (26.3) |
68 (36.2) | |||
| Illegal drugs | No | 94 (94.9) | 180 (95.7) | 0.77 | |
| Yes |
5 (5.1) |
8 (4.3) | |||
| Fruit serves/day | <1 | 44 (44.4) | 64 (34.0) | <0.084 | |
| ≥1 |
55 (55.6) |
124 (66.0) | |||
| Vegetable serves/day | ≤2 | 70 (70.7) | 92 (48.9) | <0.001*** | |
| ≥3 |
29 (29.3) |
96 (51.1) | |||
| Adults 18–64 years with 150 min of moderate or 75 min vigorous activity per week | No | 20 (20.2) | 62 (33.0) | 0.59 | |
| Yes |
26 (26.3) |
67 (35.6) | |||
| Missing |
53 (53.5) |
59 (31.4) | |||
| Adults ≥65 years with 210 min of moderate activity each week | No | 42 (42.4) | 116 (61.7) | 0.58 | |
| Yes |
3 (3.0) |
12 (6.4) | |||
| Missing |
54 (54.5) |
60 (31.9) | |||
| BMI (kg/m2) | Underweight to healthy weight | 31 (31.3) | 32 (17.0) | 0.010* | |
| ≥Overweight |
68 (68.7) |
154 (81.9) | |||
| Missing |
0 (0.0) |
2 (1.1) | |||
| Waist circumference | Healthy (males <94 cm, females <80 cm) | 21 (21.2) | 20 (10.6) | ||
| Increased risk (males ≥94 cm, females ≥80 cm) |
77 (77.8) |
162 (86.2) | |||
| Missing |
1 (1.0) |
6 (3.2) | |||
| Blood pressure | Normal/high-normal | 83 (83.8) | 147 (78.2) | 0.33 | |
| Hypertension |
16 (16.2) |
39 (20.7) | |||
| Missing |
0 (0.0) |
2 (1.1) | |||
| Cholesterol (mmol/L) | Normal (<5.17) | 56 (56.6) | 88 (46.8) | 0.19 | |
| High (≥5.17) |
40 (40.4) |
88 (46.8) | |||
| Missing |
3 (3.0) |
12 (6.4) | |||
| Blood glucose level (non-fasting) (mmol/L) | Normal (4.0–7.8) | 79 (79.8) | 154 (81.9) | 0.29 | |
| High (≥7.9) |
17 (17.2) |
23 (12.2) | |||
| Missing |
3 (3.0) |
11 (5.9) | |||
| GP/nurse practitioner visits |
3 (2–5) |
4 (2–6) | 0.078 | ||
| Allied health visits |
2 (1–5) |
3 (2–6) | 0.077 | ||
| Hospital ED visits |
1 (1–2) |
1 (1–2) | 0.81 | ||
| Hospital admissions |
1.5 (1–3) |
1 (1–2) | 0.87 | ||
| Overall self-rated health (0 ‘very unsatisfied’ to 10 ‘very satisfied’) |
8 (7–9) |
7 (6–8) | 0.05* | ||
| Quality of life (EQ-5D-5L) | High (6–10) | 86 (86.9) | 163 (86.7) | ||
| Low (0–4) |
3 (3.0) |
10 (5.3) | |||
| Neutral (5) |
10 (10.1) |
15 (8.0) | |||
| Quality of life (good if score ≤5; poor otherwise) (EQ-5D-5L) |
1 (0–2) |
2 (0–3) | 0.20 | ||
| Secondary outcomes children (8–17 years; N=66) |
(child n=6) |
(child n=60) | |||
| Fruit serves/day | <1 | 2 (33) | 6 (10) | 0.09 | |
| ≥1 |
4 (67) |
54 (90) | |||
| Vegetable serves/day | ≤2 | 5 (83) | 36 (60) | 0.26 | |
| ≥3 |
1 (17) |
24 (40) | |||
| Moderate-to-vigorous activity >1 h | <7 days per week | 3 (60) | 48 (80) | 0.30 | |
| ≥7 days per week |
2 (40) |
12 (20) | |||
| Missing |
1 (4) |
0 (0) | |||
| GP/nurse practitioner visits | –† |
3 (3–3) |
2 (2–10) | 0.72 | |
| Hospital admissions | –† |
1 (1–2) |
1 (1–1) | 0.49 | |
| Overall self-rated health (0 ‘very unsatisfied’ to 10 ‘very satisfied’) | –† |
9 (8–10) |
8 (7–10) | 0.47 | |
| Overall self-rated health (0 ‘very unsatisfied’ to 10 ‘very satisfied’) | High (6–10) | 5 (83) | 53 (88) | 0.84 | |
| Low (0–4) |
0 (0) |
1 (2) | |||
| Neutral (5) |
1 (17) |
6 (10) | |||
| Health-related quality of life (good if score ≤5; poor otherwise) (Strengths and Difficulties Questionnaire) |
0 (0–2) |
2 (1–4) | 0.05* | ||
*p≤0.05, **p<0.01, ***p<0.001
† Healthcare utilisation data not collected at baseline 2021.
EQ-5D-5L, EuroQoL Group Quality of Life Instrument Version 5. IQR, interquartile range.
Secondary outcomes
Participation in the arts was significantly higher for females than for males, with an adjusted OR of 0.37 (95%CI 0.20–0.67, p<0.001) (Table 4). Arts participants were 1.7 and 1.07 times more likely to meet recommended vegetable and fruit intake, respectively. Smoking prevalence was lower among arts participants (Table 4), and fewer had elevated blood glucose levels (Table 2). Quality-of-life scores were higher among arts participants compared with non-arts participants (Tables 3–5).
Arts participants reported slightly more visits to allied health professionals (median of three compared to two visits; p=0.08) and GPs (median of four compared to three visits; p=0.08), commonly following recommendations from the health assessment team (Table 5). There were no significant differences in hospital admissions or emergency department presentations between groups (Table 5).
Objective 4: Economic benefit of the arts on health and wellbeing
The estimated net economic benefit of the Pinnaroo Project was A$650,000, representing a return of A$2.30 for every dollar invested. This included approximately 20% attributable to direct health benefits and 20–25% to indirect health benefits, in addition to broader economic impacts arising from cultural activity4.
The program generated an economic footprint within the region through local expenditure, contributing to regional income through direct and induced supply-chain effects (not additive) as estimated using a regional economic model4. A total of 605 hours of employment were generated within the community. Health-related cost savings and productivity gains accounted for a substantial proportion of total estimated benefits4.
Objective 5: Model for evaluating community arts initiatives
The Pinnaroo Project developed and implemented a structured evaluation framework for assessing the health and economic impacts of community-led arts initiatives. The model emphasises the importance of demonstrating measurable value to funders and policymakers and is publicly available at the project website11.
Discussion
This study demonstrated the strong community engagement and sustained participation in a locally led arts-in-health initiative, supported by high levels of satisfaction and ongoing involvement (Fig2)11.
The project successfully established a diverse and accessible range of artistic and cultural activities and has produced a practical evaluation model that can be adapted by other communities to assess the impact of arts-based health initiatives11.
During the evaluation period, the program combined creative workshops with annual health checks and education sessions. This integrated approach may have contributed to a Hawthorne effect, whereby increased awareness and monitoring of health behaviours influenced outcomes26. Notwithstanding this possibility, several positive shifts in community health indicators were observed over time, including reductions in adult depression, decreased alcohol consumption and smoking rates, lower hypertension prevalence and improvements in quality of life. Among older adults, physical activity levels increased, while children demonstrated consistently high fruit and vegetable consumption, good levels of physical activity and high self-reported quality of life.
At an individual level, those who incorporated arts participation into their lives showed measurable health advantages compared with non-arts participants. These included a significant reduction in moderate to severe depression, lower smoking rates, healthier eating patterns (with higher fruit and vegetable consumption among both adults and children) and better overall self-rated health11. The project did not demonstrate measurable changes in obesity-related indicators or in child mental health and wellbeing over the study period. Importantly, community health risk factors were broadly comparable with current rural Australian rates for obesity and child mental health, with some indicators more favourable than national averages7.
These findings align with a growing body of international research suggesting that engagement in arts and cultural activities is associated with reduced health risks, particularly in relation to mental health and behaviours influenced by social connection1-6. Arts participation has been shown to enhance social inclusion, reduce loneliness, increase confidence and improve feelings of self-worth, all of which are recognised contributors to health and wellbeing1,27,28. Qualitative feedback collected through the Pinnaroo Project further supports these mechanisms, with participants describing increased connection, purpose and enjoyment.
Arts-based approaches have also been applied internationally in both prevention and management of physical illness and chronic disease, contributing to improved patient engagement and health behaviours. In addition, economic modelling commissioned by the Department for Culture, Media and Sport in the UK and conducted by Frontier Economics has demonstrated that participation in arts and culture generates substantial societal value, including improved quality of life and productivity estimated at £8 billion (~A$15.1 billion) annually29. These findings are consistent with the economic outcomes observed in the present study. This benefit–cost ratio of 2.3 was consistent with and at the conservative end of returns documented in the broader literature on community health investment, which suggests returns of A$2–4 per dollar invested29 and, in randomised controlled trial conditions, returns of A$2.47 within a single fiscal year. The modelling assumptions underlying this estimate are deliberately modest – for example, the assumed reduction in sick leave of 0.5 days per participant represents a fraction of the 27% reduction in absenteeism documented by the WHO23, suggesting the true community benefit may be meaningfully higher.
Limitations
This study has several limitations. Participation in health assessments was voluntary, and although the sample broadly reflected the community profile, it included a higher proportion of females, fewer adolescents and more individuals in full-time employment than the broader population. This distribution is partly explained by recruitment strategies targeting workplaces and schools.
While adequate statistical power was achieved through pooling samples across the three evaluation years, the repeated cross-sectional design limits causal inference. In addition, some subgroup analyses, particularly among children not participating in arts activities, were limited by small sample sizes.
Future development of this model could include targeted strategies to increase engagement among men and individuals who are socially isolated or less connected to existing community structures, as these groups were relatively underrepresented.
Conclusion
This project adds to the growing evidence supporting the role of arts engagement as a contributor to health and wellbeing in rural community settings. The findings demonstrated that participation in creative activities was associated with meaningful improvements in mental health, healthy behaviours and quality of life, particularly in communities with limited access to healthcare services.
In this context, arts engagement represented a community-led approach to promoting wellbeing, alongside established health strategies such as physical activity. The Pinnaroo Project has developed a scalable model of evaluation for implementation of arts-in-health projects in similar settings and demonstrated economic benefit by showing that every dollar spent on this project had an A$2.30 return, which incentivises continuing investment for funders.
Acknowledgements
We are profoundly grateful for the support from the Integrated Cardiac Clinical Network SA (Rosy Tirimacco, Dr Phil Tideman (deceased) and John Denton) for providing equipment and scientists.
It is important to emphasise that this project was inspired and led by a team from a rural community whose strength and commitment and incredible hard work drove the project to success over approximately 5 years. This was during a period where the community and the world were facing challenges never seen in rural Australia for 100 years.
The Pinnaroo Project was conducted on the traditional lands of the Ngarkat People (Pinnaroo) and the Kaurna People (Flinders University, Adelaide). We acknowledge and pay respects to the Ngarkat People as the traditional custodians of the lands of Pinnaroo and surrounding Mallee region and the Kaurna People as the traditional custodians of the lands of the Adelaide region.
We also acknowledge the deep feelings of attachment and the relationship of the Ngarkat and Kaurna Peoples to their Place. We pay our respects to the ancestors and the current living Ngarkat and Kaurna Peoples. We acknowledge that the Ngarkat and Kaurna Peoples also have creative arts and cultural activities as an integral part of their daily life and culture.
Funding
The Pinnaroo Project was funded by grants received from Regional Arts Australia, South Australian Government Department of Human Services – Targeted Our Town Support, the Foundation for Regional & Rural Renewal’s Tackling Tough Times Together, the Flinders University Arts in Health Alliance, the Cybec Foundation and Southern Mallee District Council.
The Flinders University Caring Futures Institute Team and Cybec were proud and honoured to be invited to support the evaluation of the Pinnaroo Project, which also enabled a special group of student and academic volunteers a life-changing clinical research field trip experience that provided them with an opportunity to contribute to Australian rural health.
Conflicts of interest
All authors and team members have no conflicts to declare.
The study sponsors did not participate in study design; the collection, analysis and interpretation of data; or the writing of the report; or in the decision to submit the article for publication.
AI disclosure statement
No AI was used in the writing and development of this project or manuscript.
References
You might also be interested in:
2020 - Differences in US COVID-19 case rates and case fatality rates across the urban–rural continuum