

 download PDF

Introduction
The right to medical care is recognised in several international frameworks, including the United Nations Charter1, the WHO Constitution2, and the Sustainable Development Goals (SDGs), particularly Goal 3: ‘Ensure healthy lives and promote well-being for all at all ages’3. Article 25, Section 1 of the Constitution of Japan states that ‘all citizens shall have the right to maintain the minimum standards of wholesome and cultured living’. Section 2 requires the state to promote and improve social welfare, social security, and public health, in line with Section 14,5. From an ethical perspective, health care is considered a fundamental social good, and all individuals, regardless of income or residence, should have equitable access to these services6.
Despite this, Japan faces a significant social issue: the geographic maldistribution of physicians. Rural areas have a shortage of physicians, while urban centres have a relative surplus, resulting in substantial regional disparities in access to health care7. This problem is not unique to Japan and is recognised as a global issue, although its severity varies across countries8,9. It is an ethical and social issue, but not necessarily a direct constitutional violation. To address this maldistribution, the government of Japan has implemented various initiatives (such as rural scholarships, regional quotas, and local training schemes), but the overall effect of these remains limited10-15.
Teachers, like physicians, play a central role in protecting and delivering fundamental human rights1,16,17. While physicians are at the forefront of realising the right to health care, teachers are responsible for ensuring another essential right: the right to education. Article 26 of the Japanese Constitution enshrines the right to education, establishing it as a guaranteed right for all citizens, similar to the right to health care4. Teachers, like physicians, engage directly with those who hold these rights. Therefore, physicians and teachers share a similar role as professionals obligated to deliver constitutionally guaranteed services directly to the public. However, the allocation of teachers rarely appears as a national policy concern. Schools continue to operate even in small, depopulated towns, and teachers are consistently available where children live.
This study compares the geographic distribution of physicians and teachers in Japan using national census data. The purpose is not to compare the professions themselves, nor to suggest that one profession is more ethical or socially responsible than the other. Rather, physicians and teachers are used as representative examples of two different workforce allocation systems that support constitutionally protected services. Physicians generally work in a system characterised by professional autonomy, institutional choice, and a large private-sector component, whereas teachers generally work within public or publicly coordinated systems in which allocation is strongly influenced by administrative rules, school location, and class organisation. By describing the contrasting geographic patterns of these two workforces, this study aims to identify institutional features that may be relevant to discussions of geographic equity in essential service provision.
Methods
Data
This study utilised data from the Ministry of Health, Labour and Welfare’s Statistics of Physicians, Dentists and Pharmacists 2020, the Ministry of Education, Culture, Sports, Science and Technology’s School Basic Survey 2023, and the Ministry of Internal Affairs and Communications’ Basic Resident Register 202318-22. These sources were used to create a database correlating the Japanese population with the number of physicians and teachers in each municipality (city/town/village) across Japan. The Statistics on Physicians, Dentists and Pharmacists is a comprehensive census mandated by law, requiring all practising physicians in Japan to report their locations and activities. Similarly, the School Basic Survey is a nationwide census conducted by the government, encompassing all schools in Japan, both public and private. The Basic Resident Register is also a census based on resident registration information obtained from every municipality in Japan. All three datasets are freely accessible on government websites and available for research purposes.
Classification of physicians, teachers, and regions
Based on this database, the number of physicians was classified into hospital-based and clinic-based physicians, while the number of teachers was categorised under elementary schools, lower secondary schools (junior high schools: ages 13–15 years), and upper secondary schools (high schools: ages 16–18 years). In Japan, a hospital is defined as a medical institution with 20 or more inpatient beds, whereas a clinic is defined as an institution with 19 or fewer beds. Clinics primarily provide outpatient services and are responsible for primary care in the community, while hospitals offer secondary and tertiary care, with a focus on inpatient services.
Geographically, all municipalities were classified based on two indicators: administrative division and population density. The administrative division classified municipalities into four categories: metropolis, centre city, other city, and town/village. In the context of Japan, the word ‘metropolis’ refers to designated cities and the special wards of Tokyo. Designated cities are major urban centres specified by national law, have populations exceeding 500,000, and possess administrative functions partially assumed from prefectural governments. There are 20 designated cities in Japan. Given their considerable size, these designated cities are further divided into administrative units known as wards, with each ward within these cities treated as a distinct region in this study. The special wards of Tokyo comprise 23 districts within Tokyo and have population sizes and functions similar to designated cities. Centre cities are also designated by national law, have populations exceeding 200,000 and possess administrative functions partially assumed from prefectural governments, though they are not subdivided into wards. Finally, towns/villages represent municipalities, with populations generally less than 50,000.
For population density classification, all municipalities were divided into quartiles based on their population density, ensuring that each quartile contained a quarter of the municipalities. Specifically, the first quartile included municipalities with a population density of 59.15 persons/km² or less, the second quartile included municipalities with a density greater than 59.15 persons/km² but less than or equal to 227.96 persons/km², the third quartile included municipalities with a density greater than 227.96 persons/km² but less than or equal to 1119.92 persons/km², while the fourth quartile included municipalities with a density greater than 1119.92 persons/km².
Statistical analysis
For each geographic classification, the number of physicians per 100,000 people (clinic-based and hospital-based) and the number of teachers per 10,000 school-aged children (elementary, junior high, and high schools) were calculated. For elementary and junior high schools, the population of children under the age of 15 years was used as the denominator, while the population of 15–19-year-olds was used as the denominator for high schools. These age groupings were selected as proxies due to the lack of exact correspondence between school enrolment ages and available statistical categories. Furthermore, clinic-based physicians, who are primarily responsible for primary care, were compared with teachers at elementary and junior high schools, while hospital-based physicians, who are responsible for advanced medical care, were compared with high school teachers. The analysis focuses on population-standardised indicators, ratios, and distributional contrasts across regional categories. Tests of statistical significance were not required, as the figures represent population-level census data rather than a sample.
Ethics approval
This study relied only on statistical data that is publicly available on government websites, and the research data did not include any personal information. Therefore, ethics review was not required.
Results
The total numbers of physicians and teachers analysed in this study were 339,623 and 894,940, respectively. Table 1 presents the population, number of physicians, number of teachers, and the results of statistical analyses for each regional classification based on administrative divisions. Metropolitan districts accounted for 29.5% of the total population but 37.9% of all physicians, whereas towns and villages accounted for 8.3% of the population but 5.1% of all physicians. In contrast, towns and villages accounted for 8.1% of the population under 15 years but 10.7% of elementary school teachers and 10.9% of junior high school teachers. Similarly, differences were found in comparisons between clinic physicians and elementary school teachers, clinic physicians and junior high school teachers, clinic physicians and elementary/junior high school teachers, as well as hospital physicians and high school teachers. Figure 1 illustrates the number of physicians per 100,000 people and the number of teachers per 10,000 children across the administrative divisions. As evidenced graphically, physicians are heavily concentrated in urban areas, with a more than two-fold difference noted in the number of physicians per population between metropolis and towns/villages. On the other hand, teachers are slightly more concentrated in rural areas, with the number of teachers per 10,000 children in towns/villages being approximately 1.4 to 1.6 times that of the metropolis (Fig2). For high school teachers specifically, the distribution is nearly equal across the regions.
Table 1: Japanese population, number of physicians, and number of teachers for each regional classification based on administrative divisions
| Administrative category (no. of municipalities) |
Total population mean (%) |
Population <15 years mean (%) |
Population 15–19 years mean (%) |
Total physicians mean (%) |
Hospital physicians mean (%) |
Clinic physicians mean (%) |
Total teachers mean (%) |
Elementary school teachers mean (%) |
Junior high school teachers mean (%) |
Elementary and junior high school teachers mean (%) |
High school teachers mean (%) |
|---|---|---|---|---|---|---|---|---|---|---|---|
|
Metropolis (district) (n=198) |
187,084.35 (29.5) |
21,846.15 (28.9) |
7783.32 (27.6) |
649.70 (37.9) |
411.16 (37.6) |
202.33 (37.4) |
1148.67 (25.4) |
535.71 (25.0) |
307.91 (24.6) |
843.62 (24.9) |
305.06 (27.1) |
|
Centre city (n=42) |
361,910.82 (17.9) |
44,249.23 (18.3) |
16,746.31 (18.6) |
1140.50 (20.8) |
758.18 (21.7) |
331.48 (19.2) |
2616.53 (18.1) |
1183.58 (17.3) |
705.77 (17.7) |
1889.35 (17.4) |
727.18 (20.2) |
|
Other city (n=710) |
78,172.13 (44.3) |
9396.89 (44.6) |
3582.36 (45.5) |
173.36 (36.2) |
109.05 (35.8) |
57.70 (38.2) |
587.11 (46.6) |
280.71 (47.0) |
163.01 (46.8) |
443.72 (46.9) |
143.39 (45.6) |
|
Town/village (n=926) |
11,267.27 (8.3) |
1312.00 (8.1) |
503.01 (8.3) |
18.56 (5.1) |
11.48 (4.9) |
6.09 (5.3) |
95.49 (9.9) |
49.16 (10.7) |
29.11 (10.9) |
78.27 (10.8) |
17.22 (7.1) |
|
Mean of total (n=1896) |
66,148.14 (100.0) |
7888.02 (100.0) |
2947.59 (100.0) |
179.13 (100.0) |
114.17 (100.0) |
56.55 (100.0) |
472.01 (100.0) |
223.77 (100.0) |
130.50 (100.0) |
354.27 (100.0) |
117.75 (100.0) |
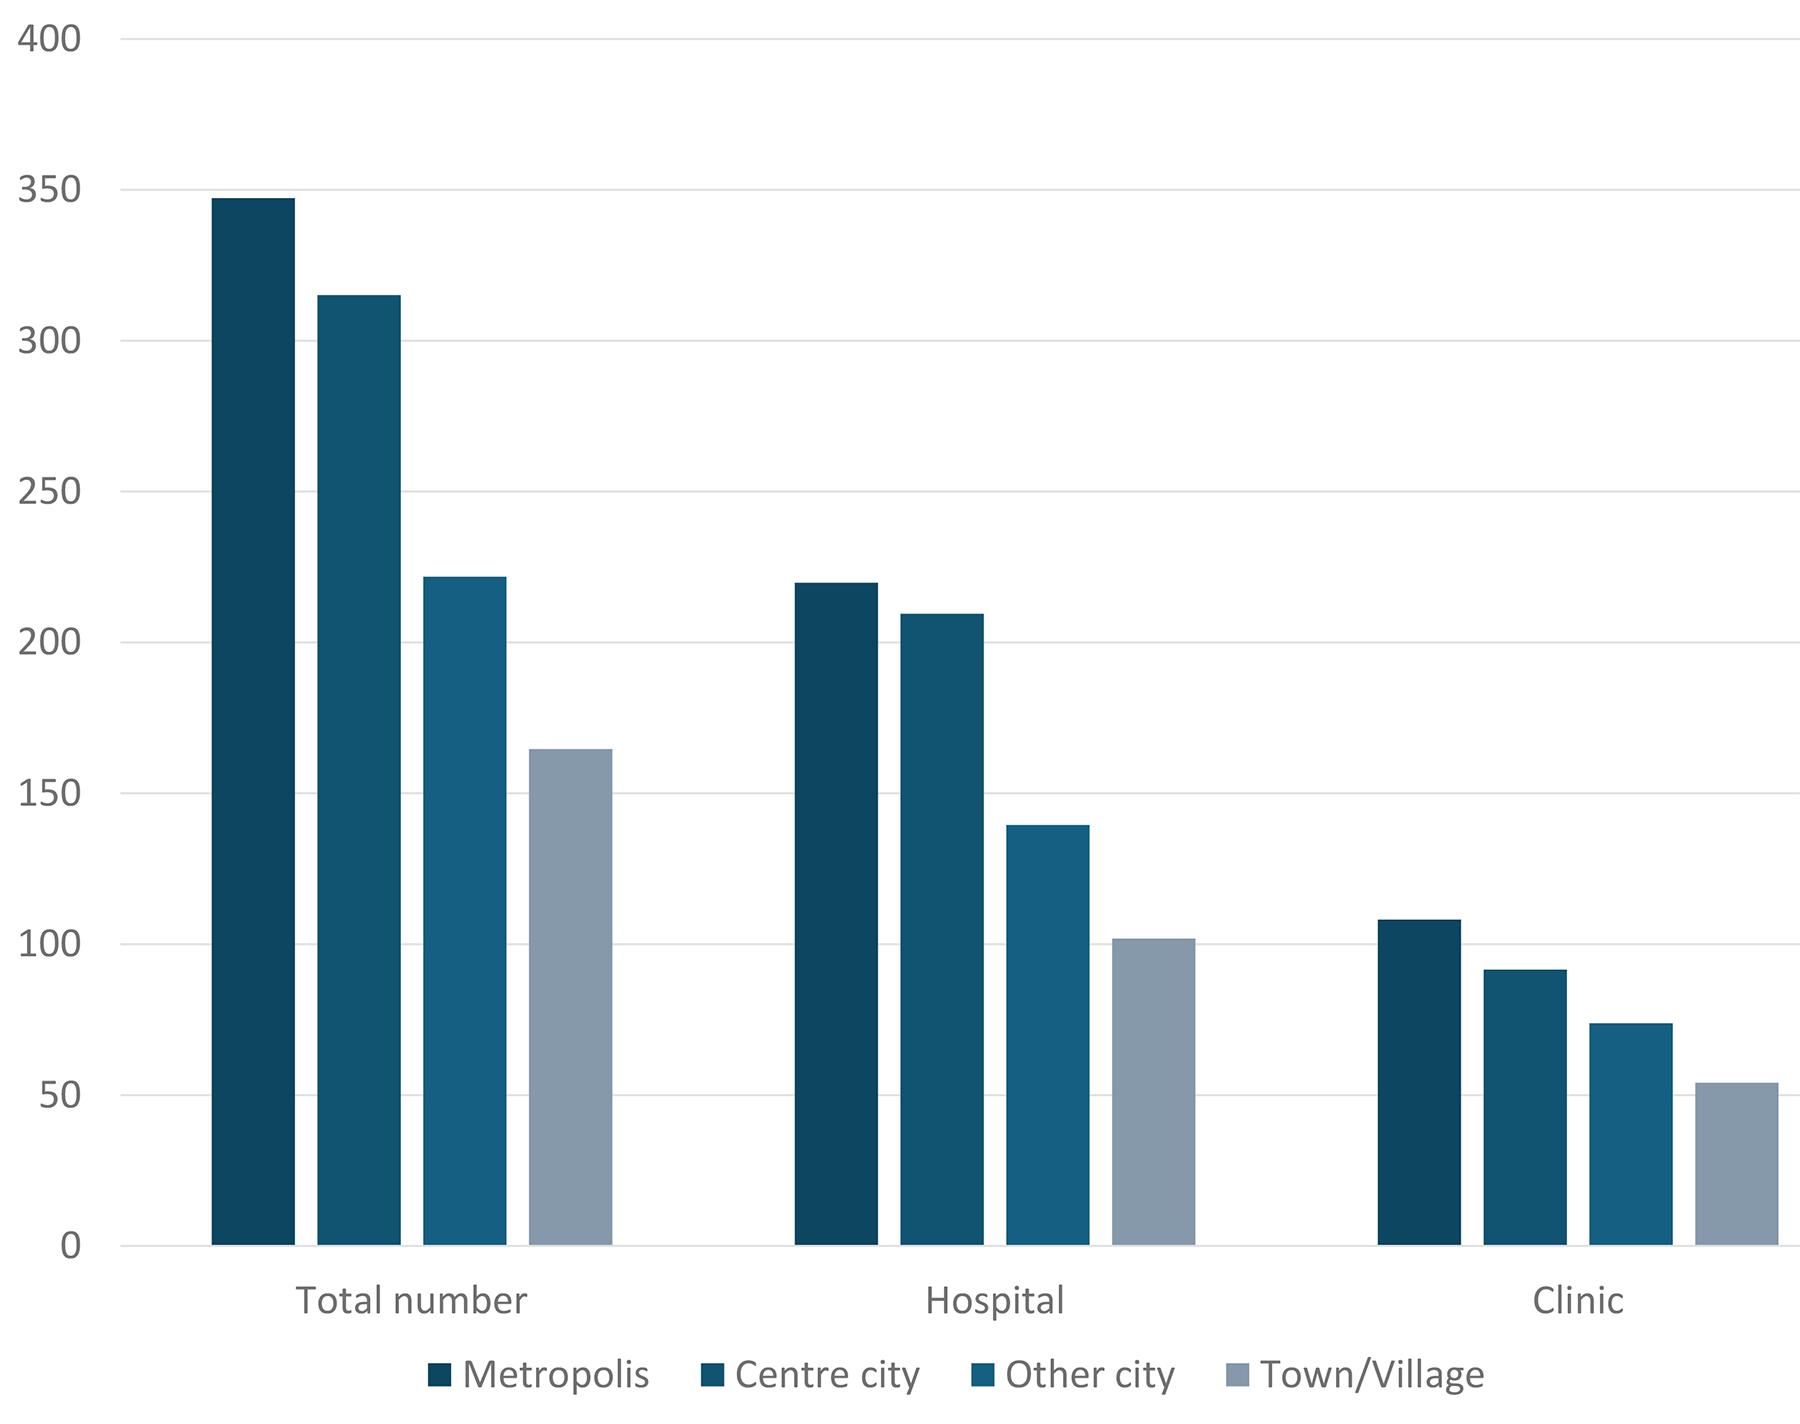 Figure 1: Number of physicians per 100,000 people across the Japanese administrative divisions.
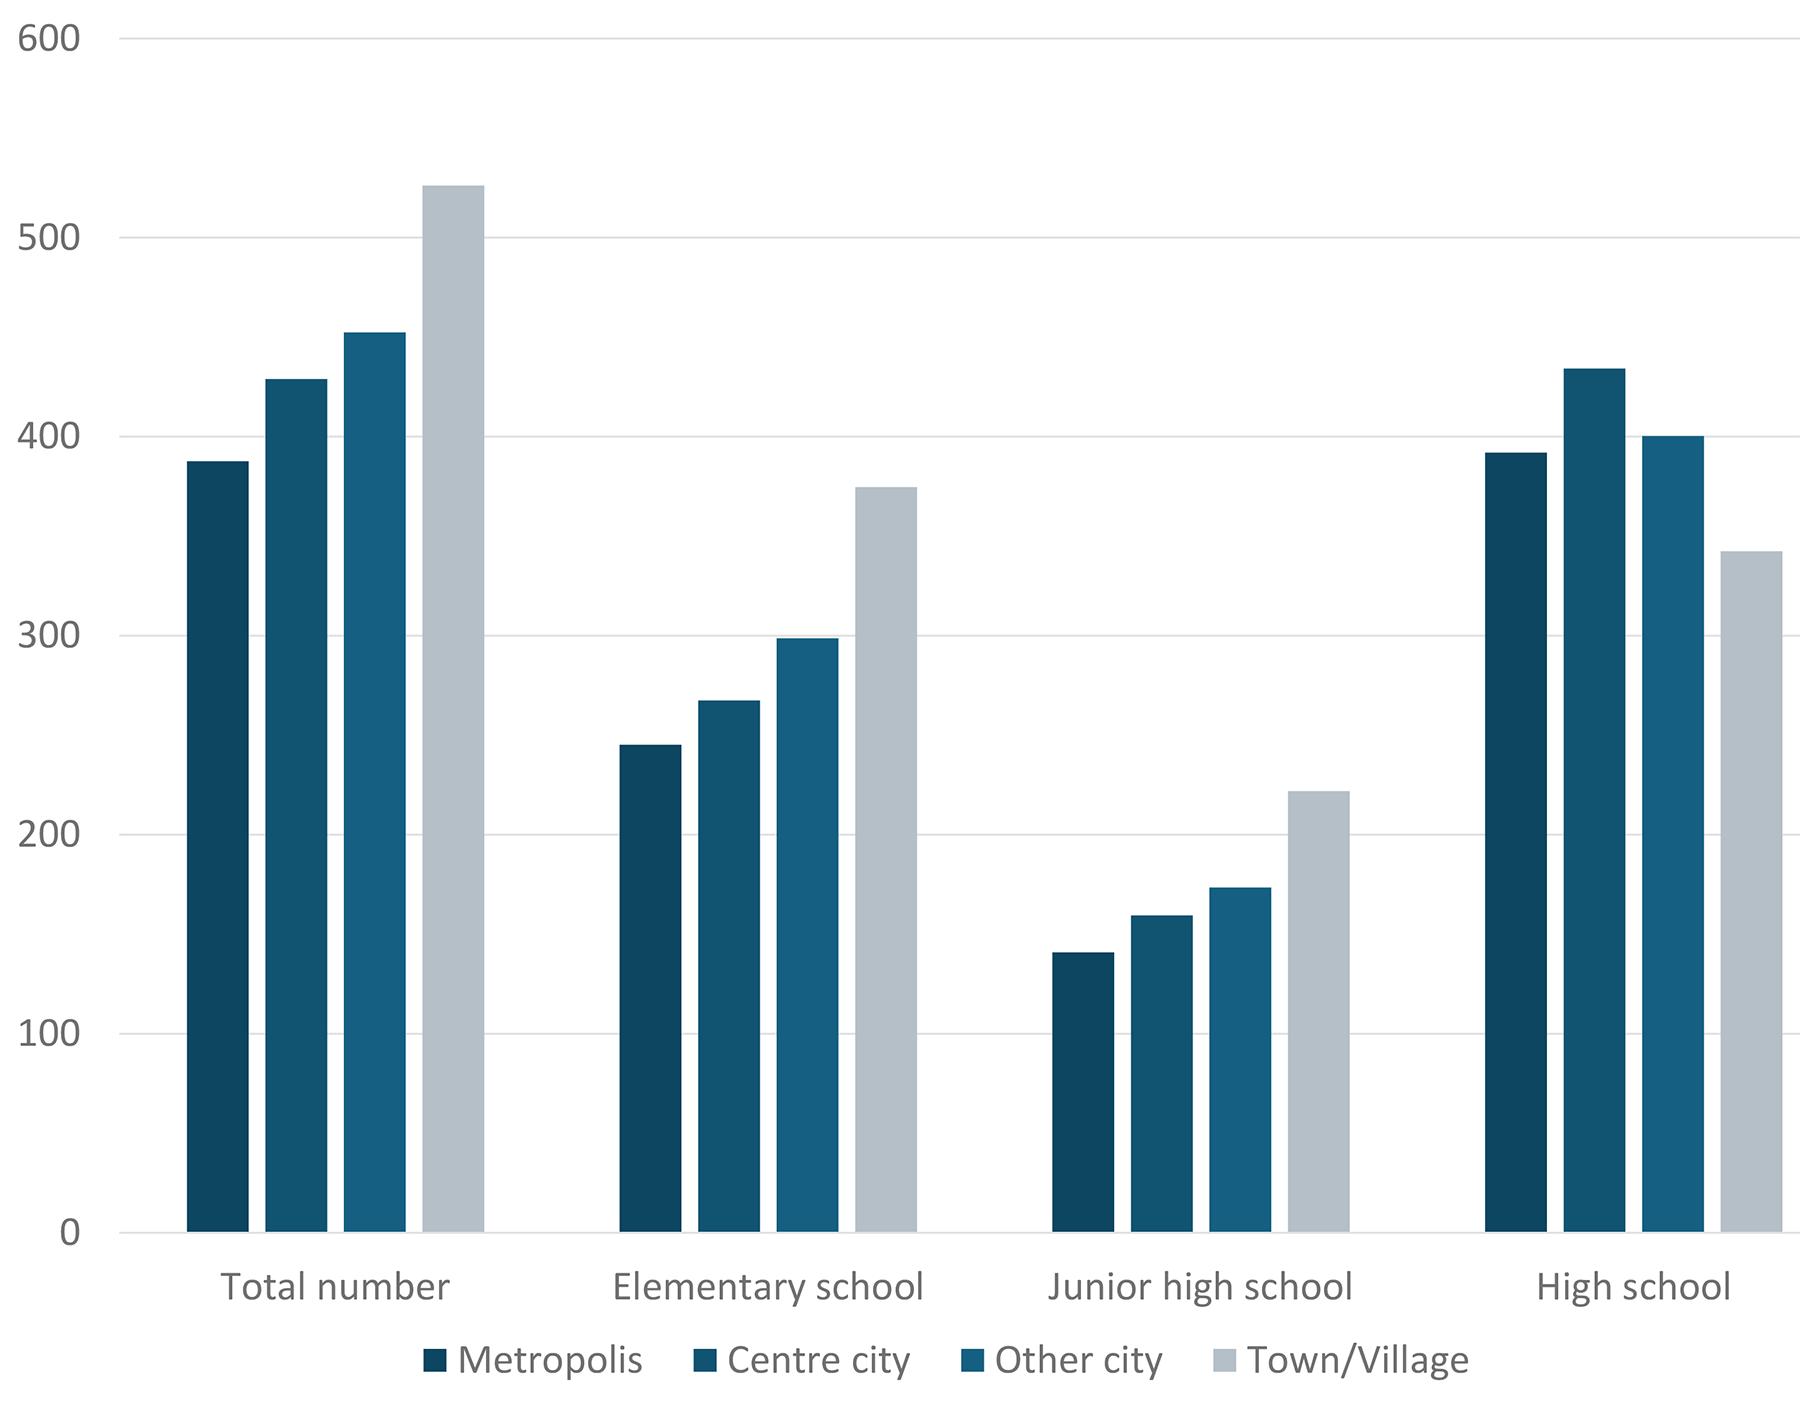 Figure 2: Number of teachers per 10,000 children across the Japanese administrative divisions.
Table 2 presents the same indicators by population density quartile. The highest density quartile accounted for 57.3% of the population but 61.3% of physicians, whereas the lowest density quartile accounted for 3.0% of the population but only 1.5% of physicians. In contrast, the lowest density quartile accounted for 2.5% of the population under 15 years but 4.6% of elementary school teachers and 5.0% of junior high school teachers. Similar differences were noted in comparisons between clinic physicians and elementary school teachers, clinic physicians and junior high school teachers, clinic physicians and elementary/junior high school teachers, as well as hospital physicians and high school teachers. Figures 3 and 4 illustrate the number of physicians per 100,000 people and the number of teachers per 10,000 children across the population density quartiles. This geographic classification method also showed a concentration of physicians in urban areas and a notable concentration of teachers in rural areas. In contrast to the classification based on administrative divisions, a concentration of high school teachers in rural areas was also observed.
Table 2: Japanese population, number of physicians, and number of teachers for each regional classification based on population density quartiles
| Population density |
Total population mean (%) |
Population <15 years mean (%) |
Population 15–19 years mean (%) |
Total physicians mean (%) |
Hospital physicians mean (%) |
Clinic physicians mean (%) |
Total teachers mean (%) |
Elementary school teachers mean (%) |
Junior high school teachers mean (%) |
Elementary and junior high school teachers mean (%) |
High school teachers mean (%) |
|
|---|---|---|---|---|---|---|---|---|---|---|---|---|
| ≥1119.93 |
151,713.97 (57.3) |
18,322.74 (58.1) |
6701.11 (56.8) |
439.18 (61.3) |
277.15 (60.7) |
141.04 (62.3) |
964.25 (51.1) |
459.40 (51.3) |
264.13 (50.6) |
723.53 (51.1) |
240.72 (51.1) |
|
| 227.97–1119.92 |
75,044.74 (28.4) |
9111.24 (28.9) |
3478.53 (29.5) |
207.47 (29.0) |
136.82 (30.0) |
61.15 (27.0) |
578.21 (30.6) |
269.92 (30.2) |
158.35 (30.3) |
428.28 (30.2) |
149.94 (31.8) |
|
| 59.16–227.96 |
29,793.45 (11.3) |
3321.97 (10.5) |
1295.47 (11.0) |
58.88 (8.2) |
36.41 (8.0) |
19.95 (8.8) |
260.97 (13.8) |
124.34 (13.9) |
73.22 (14.0) |
197.56 (13.9) |
63.40 (13.5) |
|
| ≤59.15 |
8040.41 (3.0) |
796.13 (2.5) |
315.26 (2.7) |
10.97 (1.5) |
6.31 (1.4) |
4.07 (1.8) |
84.63 (4.5) |
41.43 (4.6) |
26.28 (5.0) |
67.71 (4.8) |
16.92 (3.6) |
|
| Mean of total |
66,148.14 (100.0) |
7888.02 (100.0) |
2947.59 (100.0) |
179.13 (100.0) |
114.17 (100.0) |
56.55 (100.0) |
472.01 (100.0) |
223.77 (100.0) |
130.50 (100.0) |
354.27 (100.0) |
117.75 (100.0) |
|
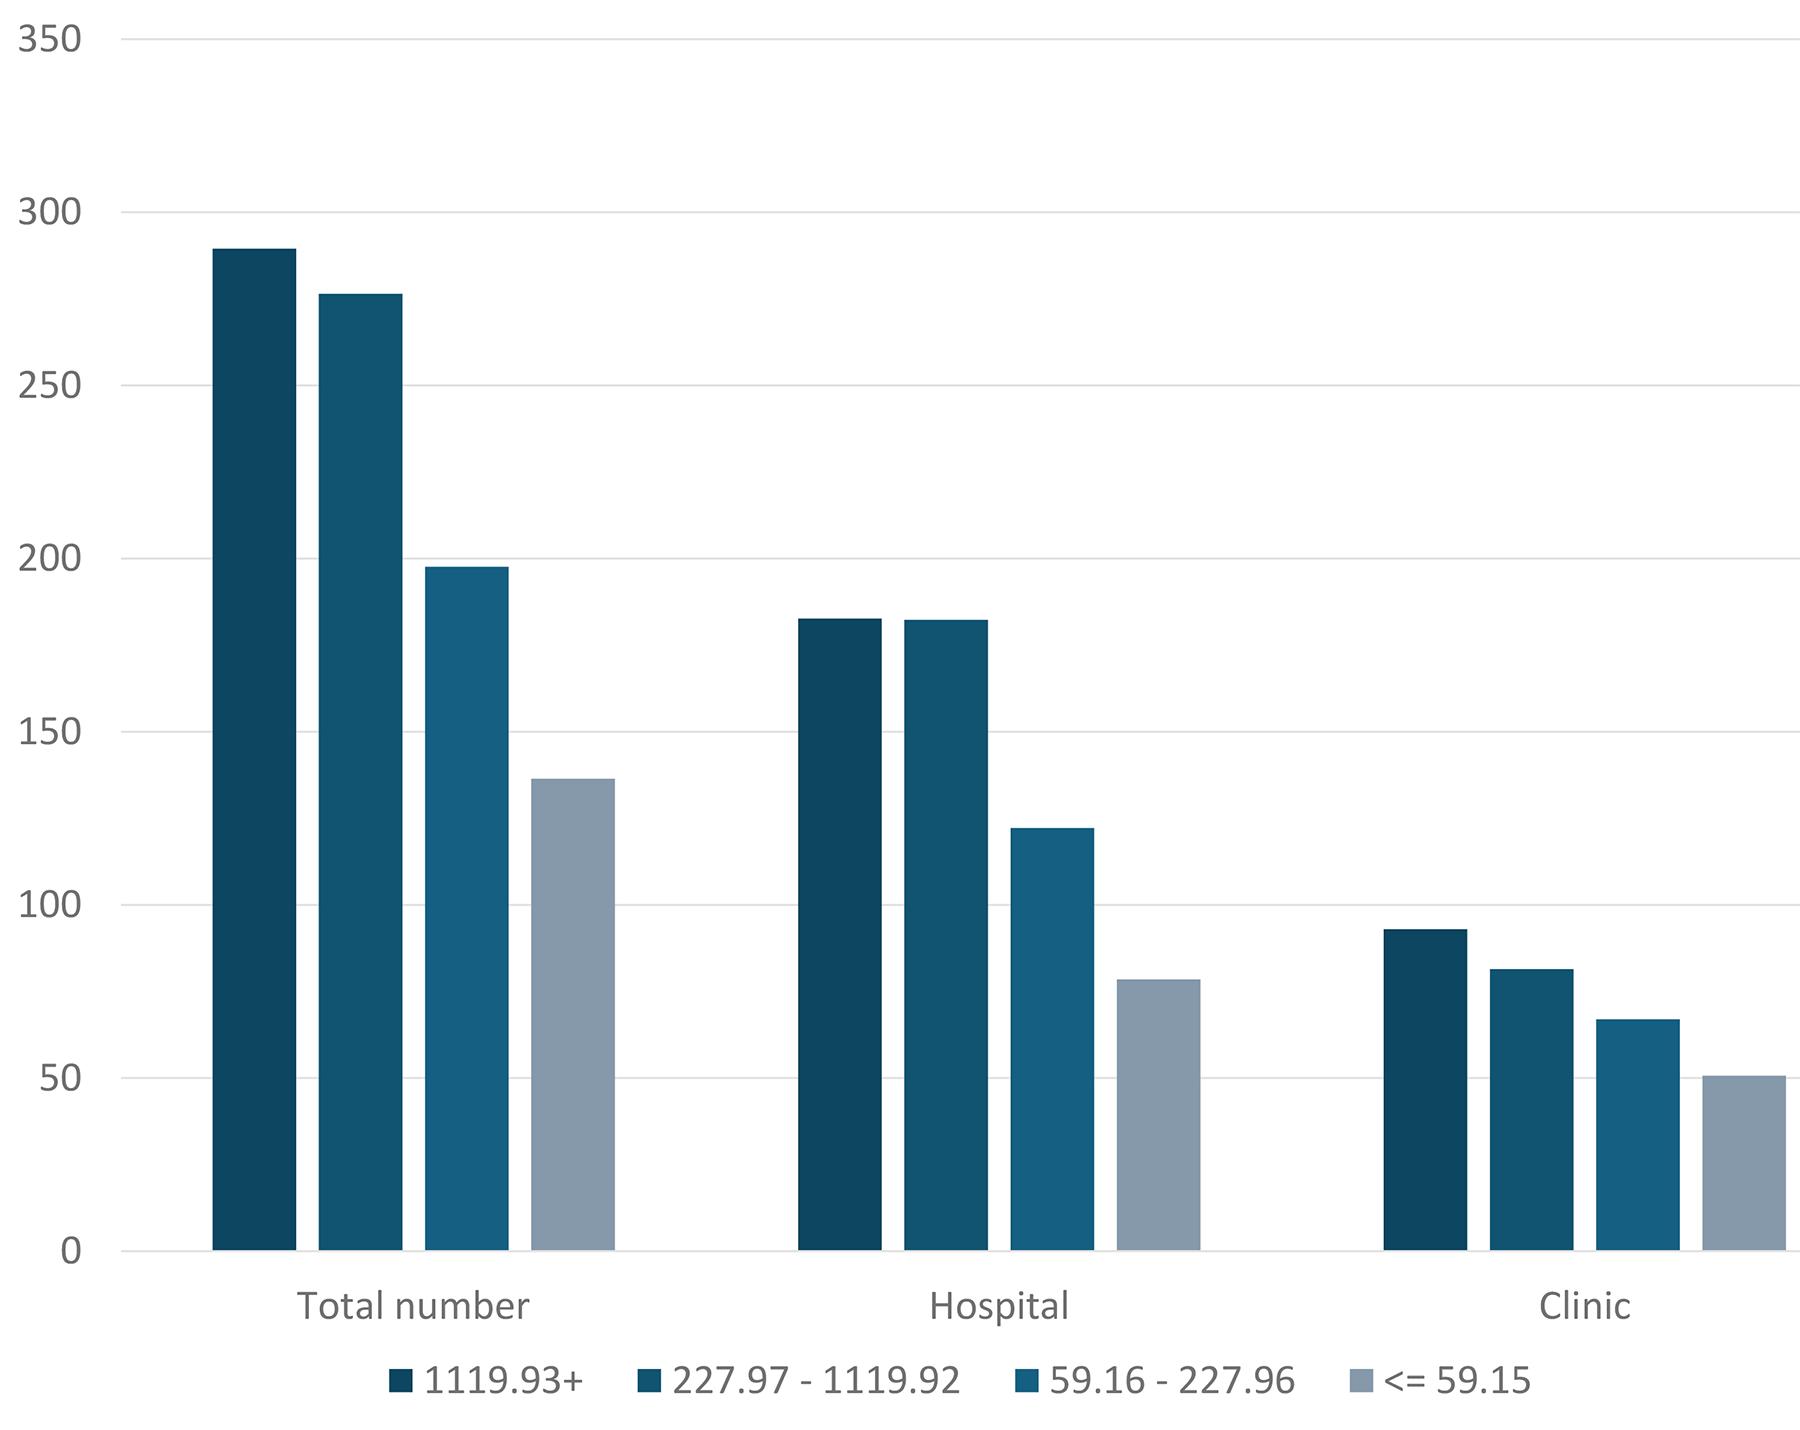 Figure 3: Number of physicians per 100,000 people across the Japanese population density quartiles.
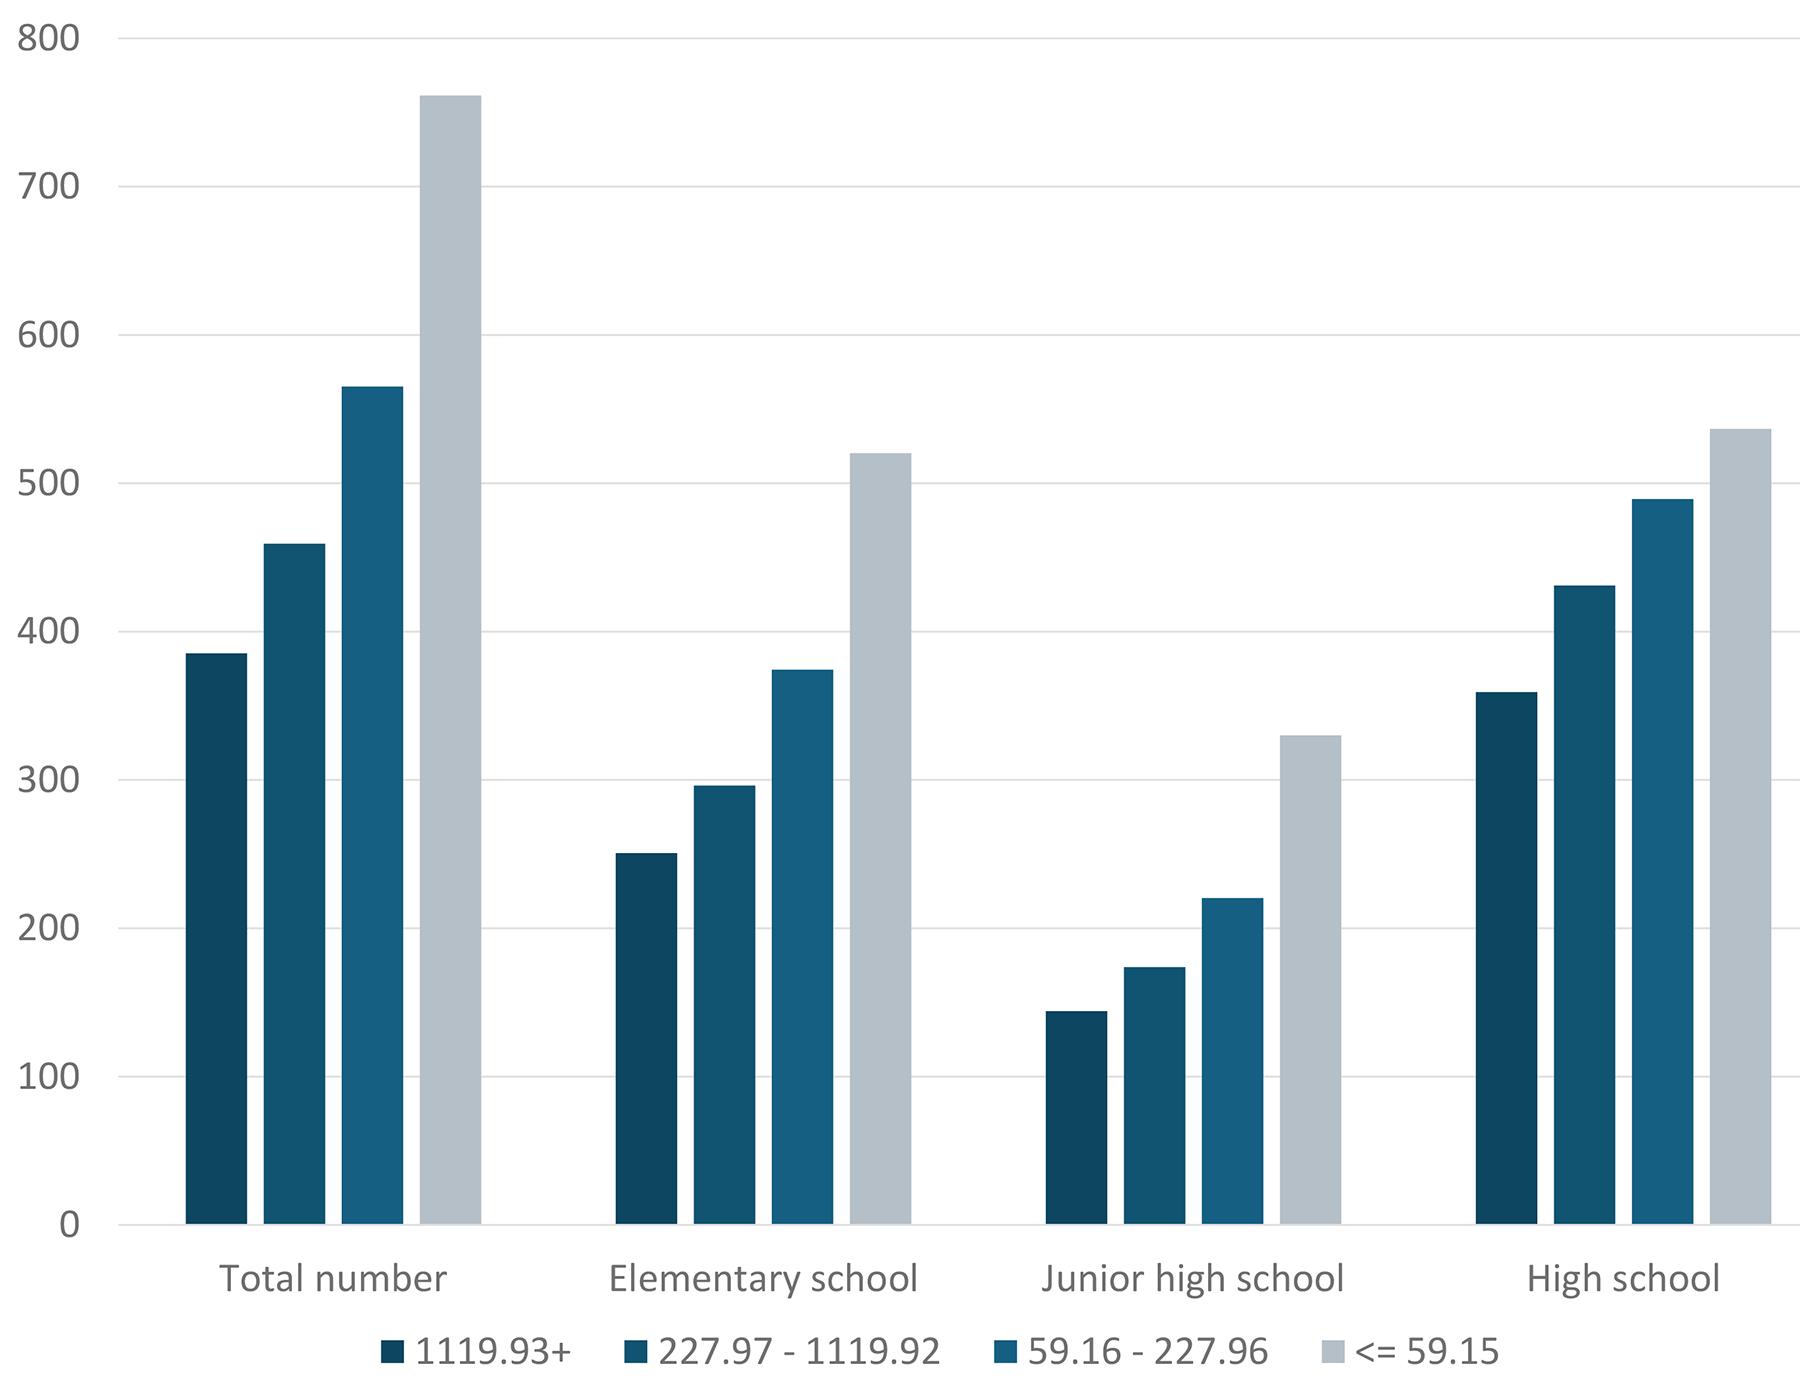 Figure 4: Number of teachers per 10,000 children across the Japanese population density quartiles.
Discussion
Workforce allocation systems and geographic distribution
The present study demonstrates that two essential service workforces operating under different institutional arrangements exhibit strikingly different geographic distribution patterns. Physicians are concentrated in urban areas, while teachers are distributed relatively evenly, or slightly more concentrated in rural areas. These patterns suggest that institutional design influences workforce distribution. In Japan, prefectural or municipal governments mostly employ and allocate teachers, ensuring staff are present in all regions with schools23-25. In contrast, physicians are largely free to choose their workplace, and employment decisions are mainly market-driven or based on individual institutions.
These institutional differences provide an important explanation for the observed contrast, although they should not be interpreted as the only possible explanation. Public employment does not always ensure equitable coverage; in some countries with similar systems, rural teaching or medical positions remain persistently unfilled. Although several countries have implemented different forms of public physician placement, only a few (eg Thailand) have shown significant effectiveness, and concerns remain about the long-term sustainability of these interventions26-29. The policy question is therefore not whether the teacher system should simply be copied, but which institutional elements, if any, could inform health workforce planning.
Rules, authority, and workforce distribution
After examining these data, it is useful to examine a hypothesis that, in the absence of an effective market solution, workforce distribution may be difficult to influence unless two conditions are present: explicit allocation rules and the authority to implement them. In the case of teachers in Japan, both conditions exist. Teacher staffing is largely determined by administrative rules based on student numbers and class organisation, resulting in clearly defined staffing requirements for individual municipalities and schools. In addition, prefectural governments possess the authority to assign personnel and fill positions throughout their jurisdictions30. As a result, teacher distribution is coordinated through a comprehensive system that combines allocation rules with workforce authority.
In contrast, physician distribution is governed by neither strong allocation rules nor effective allocation authority. Japan has introduced regional caps on the numbers of postgraduate clinical trainees and specialist trainees, but these regulations apply only to limited cohorts of early-career physicians. In addition, the caps themselves are relatively permissive and have not prevented the continued concentration of young physicians in major metropolitan areas.
With regard to allocation authority, there are limited exceptions. For example, prefectural governments exercise substantial influence over the placement of graduates from Jichi Medical University and physicians trained through regional quota programs that involve service obligations12. These programs represent important institutional responses to physician maldistribution. However, because they apply to only a small proportion of the physician workforce, they do not provide a comprehensive mechanism for influencing physician distribution at the national level. While such initiatives may produce meaningful benefits for communities, partial solutions alone are unlikely to substantially alter nationwide distribution patterns and may reduce attention to more fundamental structural reforms31.
Beyond these exceptions, there are no region-specific physician staffing quotas, and no public organisation possesses authority comparable to that exercised by prefectural governments in the teacher allocation system. Consequently, physician distribution remains largely dependent on institutional recruitment, individual career decisions, and market-based processes rather than coordinated workforce planning.
Although the direction of the findings is unsurprising, the magnitude of the contrast has not previously been demonstrated. Many policymakers and researchers have implicitly recognised these institutional differences, but few studies have directly contrasted their consequences using nationwide workforce data. The present study therefore moves the discussion from intuition to empirical observation.
More importantly, the findings help to clarify the extent to which public institutions, including government, may influence geographic workforce distribution. Discussions regarding physician maldistribution often focus on individual preferences, professional autonomy, or market forces. The present results suggest that the institutional capacity to establish allocation rules and exercise workforce authority may also be important determinants of geographic distribution.
The findings do not suggest that teachers are more altruistic than physicians. Teachers and physicians may both act according to ordinary professional, personal, and family considerations. The difference is that their choices occur within different institutional environments. Teachers typically work within systems in which school location, class organisation, and personnel transfers are administratively coordinated. Physicians, by contrast, often choose workplaces through institutional recruitment, specialty training pathways, and individual career preferences32,33. These differences may shape geographic distribution even when individual motivations are similar.
Economic and organisational feasibility
Another structural difference between education and health care is the financial basis of these. In Japan, compulsory education is provided mainly through public institutions: about 99% of elementary schools and 92% of lower secondary schools are publicly operated. These non-profit institutions are funded almost entirely by government budgets, which ensures a stable supply of teachers across all regions34,35. In contrast, the healthcare sector in Japan relies heavily on private providers. Publicly owned institutions make up only 14% of all hospitals and 22% of total hospital beds, making Japan ‘the most private-capital-dependent healthcare delivery system of any developed country’36.
However, the pressures faced by healthcare providers cannot be attributed solely to the predominance of private ownership. The financial environment created by the national health insurance system imposes strict reimbursement constraints on all hospitals, including public hospitals. As a result, even public hospitals, despite their nominal public status, must operate under conditions much closer to competitive market management than to the secure budgetary environment of public schools. This structural reality means that the challenges of maintaining clinics and hospitals in sparsely populated areas arise not only from private-sector economics but also from the universal fiscal pressures within Japan’s healthcare financing system. Therefore, improving the geographic equity of the physician workforce is inseparable from addressing these systemic financial constraints.
Implications for workforce policy
The present findings do not imply that the teacher allocation system should be directly transferred to health care. The two professions differ substantially in their training pathways, organisational structures, and workforce requirements. Nevertheless, the comparison highlights institutional features that may be relevant to future workforce policy.
Viewed through the lens of the teacher allocation system, geographically equitable workforce distribution appears to require both allocation rules and implementation authority. If policymakers wished to adopt a more coordinated approach to physician workforce distribution, several options could be considered. These might include the development of more explicit regional workforce planning mechanisms, stronger public support for rural healthcare institutions to ensure sustainable staffing regardless of local financial circumstances, or expansion of programs that combine public funding with service obligations, such as regional quota schemes. The purpose of this study is not to advocate any particular policy, but rather to illustrate how differences in institutional design may contribute to differences in workforce distribution.
Limitations
This study has several limitations. First, it is descriptive and cross-sectional, and therefore cannot establish causal relationships between institutional arrangements and workforce distribution. Second, physicians and teachers differ in job content, required workforce size, and service demand; the purpose of the comparison is therefore to contrast workforce allocation systems rather than professions themselves. Third, the denominators used for teachers were based on available age categories rather than exact school enrolment populations. Fourth, the analysis did not examine within-prefecture transfer rules, specialty-specific physician distribution, school size, or local labour-market conditions.
Conclusion
Japan shows contrasting geographic patterns between physicians and teachers. Physicians are concentrated in urban areas, whereas teachers are distributed more evenly or relatively more in rural areas. These findings do not imply that teacher allocation can be directly transferred to health care. Rather, they suggest that workforce distribution is shaped by institutional arrangements such as public employment, administrative assignment, financing, and professional mobility. Understanding these mechanisms may help inform future health workforce policy for rural and remote areas.
Acknowledgements
We thank Professor Norio Sakai of the Department of Molecular and Pharmacological Neuroscience, Hiroshima University Institute of Biomedical & Health Sciences, for his support in providing an environment that enabled TA to focus on completing this research and writing this article.
Conflicts of interest
The authors declare that they have no competing interests.
Funding
No funding was received for this study.
AI disclosure statement
This manuscript was translated from Japanese into English using ChatGPT (GPT-5.6 Sol), ChatGPT was also used to assist the authors during the revision process. The authors have verified accuracy of, and take responsibility for, the content.
Availability of data and materials
The datasets analysed in the current study are accessible via e-Stat Portal Site of Official Statistics of Japan: https://www.e-stat.go.jp