
Introduction
In the USA, primary care training is no longer a guarantee of future primary care capacity. This represents a problem for healthcare access across the US. The most dramatic impacts are found in rural and underserved areas that depend on primary care for 36% to 100% of total physicians1,2 The broadest scope generalists add important workforce versatility along with most needed health access, but the levels of nurse practitioners, physician assistants, and physicians remaining in the family practice mode of care have declined at the greatest rates.
Primary care studies include those who remain in primary care but fail to consider those who have departed primary care during training, at graduation and long after the completion of training3-6. Departures from primary care have been so consistent in the past decade that even the typical year or two of delay required to collect data and publish can result in primary care estimates that are too high and specialty care estimates that are too low.
Few comparative studies of multiple primary care forms are available. Studies consider two forms, but not all five primary care forms7-9. Primary care workforce studies fail to consider factors that limit primary care contributions, such as late entry into training (nurse practitioners, international medical graduates), low levels of activity in the US (nurse practitioners, physician assistants, international medical graduates), and lower volume of primary care delivered (nurse practitioners and physician assistants)6,10-13.
The US rewards career and location choices that are most closely associated with top concentrations of health resources, physicians, and specialists. Physician subspecialty salaries are multiple times higher than salaries for the basic health access careers. Salary differentials drive physician assistants and nurse practitioners away from primary care. Medical students and residents in training also experience primary care clinics that have gained a reputation for dysfunctional primary care that could influence career decisions away from choosing primary care or remaining in primary care14. Despite all of these areas of concern, studies of primary care have apparently been insufficient to influence needed change.
When healthcare studies fail to illustrate great and growing difficulties, it is time to re-examine the definitions, perspectives, tools, and approaches currently in use. Definitions that fail to capture departures from primary care fail to adequately define primary care. Perspectives that fail to capture health care for an entire nation fail the basic requirement of national health care design - consideration of an entire nation. Primary care and health access are not about the superiority of one form over another. The most important considerations are availability, consistency, continuity, and dependability. In the US at the current time, primary care is about resistance to powerful forces that destroy healthcare access. A measuring tool that can illustrate these most important concepts can improve understanding and help shape recovery of primary care and health access.
Methods
Nurse practitioner (NP), physician assistant (PA), internal medicine (IM), pediatric (PD), and family practice (FP) contributions to primary care were estimated for 2008 program graduates using data from recent studies. The calculations were the product of the following four factors:
- Factor 1: Primary care retention percentage remaining after specialization.
- Factor 2: Duration of career for the primary care form in years.
- Factor 3: Activity level as a percentage compared with all graduates.
- Factor 4: Volume of primary care delivery as a percentage compared with family physicians.
The calculation was designed to include the primary care contribution for each form of primary care graduate over an entire career. This allows comparisons between each form and also changes over time within each form, due to changes in policy or training. In addition, the cumulative changes for total primary care production can be determined for all forms, and the share of primary care for each type can be assessed.
Estimates of standard primary care years for family practice
Factor 1: Primary care retention percentage remaining after specialization: Family practice retention rates are about 98% over the first decade and the small fraction lost are often to other forms that deliver primary care. Approximately 87% of family physicians are listed in office-based primary practice activities in the Masterfile; however those remaining as not classified tend to be osteopathic physicians that are delivering top primary care levels. The American Medical Association Masterfile is the most comprehensive secondary database in the nation. Career fields include self-designated specialty and self-designated primary practice activities such as office based, hospital based, resident, teaching, administration and research. Family physicians not listed in office based primary practice activities also make primary care contributions1.
The estimate for primary care retention was 95% for 2008 family practice residency graduates.
Factor 2: Duration of career for the primary care form in years: Career length in family practice reaches 35 years as with other primary care physicians1,12
Factor 3: Activity level as a percentage compared with all graduates: The most recent family practice graduates are over 95% active in the Masterfile. Secondary databases are not the best source. Annual collections of data, such as physician assistant surveys or annual state surveys of primary care, are more consistent and timely.
The 88% activity level for the cross-section of primary care physicians in Vermont studies was used15.
Factor 4: Volume of primary care delivery as a percentage compared with family physicians: The volume of care delivered by family physicians was assigned a rating of 100% in order to establish comparisons with other forms of primary care12.
Estimates of standard primary care years for physician assistants
Physician assistant primary care estimates are backed by annual surveys that may be the only studies that capture important annual changes in primary care. Declines in primary care contributions have been steady since the creation of physician assistants with the brief exception of the 1990s. This policy period is an important natural experiment to understand. During this period of health reform, managed care, expanded population coverage (Medicaid expenditures for care of the poor doubled), and primary care reimbursement improvement, there were actually returns of physician assistants (all graduates and new graduates) and internal medicine residents (new graduates) back to a majority remaining in primary care. The end result of peak primary care policy was a maximal level of primary care in all forms. Medical student choice of family medicine reached all time peak levels during this optimal primary care policy era that is in marked contrast to the present era.
Physician assistants have been decreasing in family practice, primary care, and rural percentages at 1 to 2 percentage points a year for over a decade in annual surveys, representing the entire active physician assistant population. All three changes are related because physician assistants are leaving associations with family physicians that have the top rural and underserved and primary care contributions in the nation. Physician assistants working with family physicians have 30% rural location or double the rural location rate of other physician assistant specialties. In 1984 approximatley 56% of physician assistants worked with family physicians. By 2007 only 25% were working with family physicians. For physician assistants known to be in primary care in 1991, over 30% had departed by 200016. Additional studies by Larson, Hart, Hooker, and the American Academy of Physician Assistants were used to determine the primary care factors6,7,9-13.
Factor 1: Primary care retention percentage remaining after specialization: Primary care retention was 35% for 2007 annual surveys. Steady declines for over a decade at rates of 1-3 percentage points a year indicate that 2008 graduates would have less than 33% retention in primary care. Further declines in the years after graduation would put physician assistant contributions below 30%, and as low as 25% without changes in the market forces, health policies, and salary differentials that drive specialization.
The estimate for physician assistant primary care retention was 32%.
Factor 2: Duration of career for the primary care form in years: Physician assistants have changed from older age entry with more life and health experiences to become the youngest to enter patient care responsibilities. Primary care, rural, and underserved contributions are generally highest for primary care graduates entering careers at older ages.
Physician assistants have the potential to work more than 35 years and changes suggest that this level will not be exceeded.
Factor 3: Activity level as a percentage compared with all graduates: Physician assistant departures from active practice have accelerated after the first 15 years. Inactivity levels were 7.5% at 6 years, 15% at 11 years, and 30% at 19 years16. Because nurse practitioners and physician assistants were older in the first classes of graduates, it is difficult to project activity, retirement, or career duration. The Vermont AHEC studies generated 72% activity levels for physician assistants using 40 hours a week15.
The 72% activity level was used for 2008 physician assistants.
Factor 4: Volume of primary care delivery as a percentage compared with family physicians: Studies indicate that physician assistants have 75% of the primary care volume of a family physician, but changes in age, training focus, and previous primary care experience may impact this ability17.
The 75% primary care volume estimate was used in this study.
Estimates of standard primary care years for internal medicine residency graduates
Estimates were generated for the two major types of internal medicine graduates: US medical school graduates (IM) and international medical school graduates (IM IMG).
Factor 1: Primary care retention percentage remaining after specialization: Declines have been 250 to 350 fewer graduates beginning in primary care with each class year. Primary care intention was found in 25% of the 2005 internal medicine residency graduates5. Internal medicine in the 1990s became a more flexible form of primary care with departures at 2 percentage points for each year after graduation18. Changes since 2005 with a rapid increase in hospitalist careers suggest even more rapid departures. Declines are likely to continue because only 19% plan to begin careers in primary care19. General internal medicine has also suffered from the lowest physician satisfaction levels20. Studies fail to capture the rapid primary care declines or the increased difficulties accessing primary care internal medicine with 43.8% accepting no new patients in states such as Vermont. Slow steady decreases in internal medicine primary care physicians are evident in these annual surveys15.
The 2008 graduates were estimated to have 20% primary care retention rates. The same estimate was used for international medical graduates.
Factor 2: Duration of career for the primary care form in years: Internal medicine residency graduates remained with 35 year career length estimates. The international medical graduates have an 8 year average career loss due to delays in entry, with a 27 year career length.
Factor 3: Activity level as a percentage compared with all graduates: Internal medicine physicians have the same activity levels as other primary care physicians. International medical graduate internal medicine physicians have different activity in the US. Approxomately 20% depart for home nations and 8% remain chronically unemployed13. Other graduates leave after training to pursue opportunities in other nations.
United States graduate internal medicine physicians share the 88% active level of other primary care forms. International graduates are estimated to have 58% practice activity in the US.
Factor 4: Volume of primary care delivery as a percentage compared with family physicians: The internal medicine volumes of primary care were 86% compared with family physicians1,12. International medical graduates were estimated to have lower volumes at 80% although lower levels are possible due to the many adjustments and transitions required.
Estimates of standard primary care years for pediatricians
Factor 1: Primary care retention percentage remaining after specialization: Pediatricians in primary care tend to remain relatively committed before, during, and after training. Steady declines have been seen in the most recent decade. For many decades approximately 70-80% of pediatric residency graduates have remained in primary care. Numerous factors have changed this retention level. Fewer children in the US, more primary care pediatricians, changes in Medicaid support for lower income children, increased competition from other primary care (and non-primary care) sources, and a narrower range of practice locations (fewer rural or underserved) have made it more difficult for pediatric residency graduates to remain in primary care1,21-23. Despite these changes the existing primary care pediatricians remain among the most satisfied physicians20. The recent declines for office-based pediatricians found in the Masterfile are consistent with primary care retention declines below 60%, and are below 40% in the medical schools that have the more exclusive selection processes that are seen in nearly all medical schools. Pediatric workforce studies acknowledge a wide range of estimates, depending on the criteria used, but a most recent estimate was 62% primary care retention for males and 72.7% for females24.
The estimate for primary care retention for 2008 pediatric residency graduates was 60%.
Factor 2: Duration of career for the primary care form in years: Pediatricians share the 35 year career estimate of other primary care physicians.
Factor 3: Activity level as a percentage compared with all graduates: Pediatric activity levels remain estimated at 88%15.
Factor 4: Volume of primary care delivery as a percentage compared with family physicians: Pediatricians deliver 95% of the volume of a family physician1,12.
Estimates of standard primary care years for nurse practitioners
Few areas of workforce are as confusing as the nurse practitioner workforce. To obtain even the most basic primary care retention and practice activity percentages, an accurate denominator is needed. This is difficult because thousands of nurse practitioners 'disappear' each year as they move to different states, no longer list themselves as nurse practitioners, or no longer maintain a license. Nurse practitioners do not use the Masterfile type databases that are used for physicians and physician assistants. Blanks appear in critical areas such as specialty rates even in recent published review studies7. Studies often do not compensate for the fact that nurse practitioners who have primary care training (pediatric, adult, or family nurse practitioners) are often found practicing in hospitals, specialty clinics, or emergency rooms25. Missing data are most likely to involve nurse practitioners in hospital careers, those who are inactive, those who are without a license, and those in states that fail to report data. Additional references were used for nurse practitioner contributions7,17,25,26.
Factor 1: Primary care retention percentage remaining after specialization: Nurse practitioner estimates of primary care began with the 2004 annual graduate survey. Goolsby assembled 22 000 full time equivalents (FTE) of primary care in up to three different locations from 39 000 responses10,11. This appears to be a 56% primary care level but some variation is possible depending on the definition of an FTE. The use of a 32 to 36 hour week is standard in nurse practitioner studies. If 36 hours was used, a change to a more consistent 40 hours a week would result in 51% primary care. Using physician hours of 52-56 hours, the primary care calculation for nurse practitioners would be 38%. Despite these obvious difficulties, the beginning point was considered to be 56% primary care retention.
Further adjustments are needed because nurse practitioners define primary care differently, and because primary care attrition has been rapid since the previous 2004 study. The nurse practitioner definitions for primary care include 11% in women's health (not nurse-midwives) and 4% in geriatrics. These are areas not included in physician and physician assistant calculations of primary care and are also low patient care volume areas different from family practice, internal medicine, and pediatric physician primary care forms. To obtain the comparable primary care measurement, 15 percentage points (11 + 4) were subtracted, resulting in 41% primary care retention. Finally, adjustments must include declines for each class year over the past 4 years. Estimates must allow for rapid departures of nurse practitioners to cardiology (6%), other internal medicine specialty careers, emergency care, and other specialties. Numerous reviews were required to match up specialization rates to primary care retention rates to gain some agreement.
Estimates of 35% were used for the primary care retention rates for the 2008 nurse practitioner graduates over the next 27 years of their career.
Factor 2: Duration of career for the primary care form in years: Career length is limited in nurse practitioners by late entry into training. Initial nurse practitioners had delays in entry averaging 10 years but earlier entry results in only 8 years lost in recent graduates. Entry into nursing also involves a wide range of ages. A wide range of age entry variations and variations in nurse practitioner training length from 15-40 months complicate nurse practitioner calculations10,27.
Estimates of 27 year career durations were used for 2008 nurse practitioner graduates.
Factor 3: Activity level as a percentage compared to all graduates: Nurse practitioners had the lowest activity levels at 62% in studies of practitioners in the field using 40 hours as a work week15. Nursing forms all have a variety of activity levels but are generally 70% or below25,28. Also the nurse practitioner contributions are from those in older age ranges, which is likely to limit contributions. Older age and use for certain duties may also help explain levels as high as 15% of nurse practitioners listed in administrative activities10,11,29. Estimates were not corrected for declines in primary care activity related to administrative losses because field estimates were used.
Nurse practitioner activity levels were estimated at 62%.
Factor 4: Volume of primary care delivery as a percentage compared to family physicians: Nurse practitioners have the lowest volume of primary care with two-thirds of the volume of a physician assistant with the volume of a physician assistant at 75% of the volume of a family physician17,30.
The estimate for nurse practitioners is 50% of the volume of a family physician.
Regarding nurse, physician assistant, and nurse practitioner primary care contributions
Nurses make contributions to primary care before, during, and after physician or practitioner encounters. Losses of nursing can represent a problem, especially when shortages of nursing faculty impair the production of nurses. Nursing shortage estimates are of approximately 320 000 for the year 2020. This is approximately the same as the 320 000 who are likely to have been trained as nurse practitioners and nurse anesthetists by 2020. Significant numbers of physician assistants have also been previously involved in various forms of nursing25.
No adjustments were made for any losses of primary care volume resulting from insufficient levels of primary care nursing, resulting from rapid increases in primary care nursing duties to coordinate patients that have been under the care of hospitalists or urgent care centers, and resulting from massive increases in the verifications of patient eligibility for even basic drugs, treatments, and consultations. One of the major problems apparent in cost control measures is that few if any studies measure the consequences of cost control measures. Cost control studies and interventions can introduce complications and obstacles that can impair health care delivery.
Final calculations and adjustments for rural or underserved location contributions
On the basis of these data, an estimate of standard primary care years likely to be provided by a 2008 graduate was calculated for each of the primary care professions as follows:
Factor 1 x Factor 2 x Factor 3 x Factor 4 = Standard primary care years.
Further adjustments were then made to estimate their contribution to rural and underserved communities. Steady deteriorations in rural and in underserved location rates have been seen in the more flexible forms of primary care. Family practice has emerged as the leader in distribution, with 20% remaining in rural locations and 15% found in underserved locations (zip code with 19% or more in poverty or a Community Health Center or a whole-county primary care shortage area at the zip code). These rates are both double the average levels for other forms of primary care and for physician workforce in the US at 10% rural and 7-8% underserved. Masterfile zip code practice locations for recent internal medicine and pediatric primary care physicians were used.1 Internal medicine and pediatric primary care training forms have been moving away from rural and underserved careers and primary care careers for decades1,18,21-23.
Due to the lack of comparable data using practice zip codes, nurse practitioners were rated at the same rural and underserved distribution levels as family physicians, although declines have been steady. Physician assistant data documents 15% rural location rates and changes in physician assistant employers indicate declines in underserved contributions. An estimate of 12% underserved location was made. There was no adjustment made for future changes that would reduce rural and underserved primary care workforce over the next 2 or 3 decades of the 2008 graduates. As nurse practitioners and physician assistants are accepted as health professionals and are actively recruited as higher paid specialists, their primary care and underserved distributions can only decline.
Results
The resultant estimates of primary care workforce years for a 2008 graduate are presented in Table 1.
Table 1: Estimates of primary care workforce years for a 2008 graduate
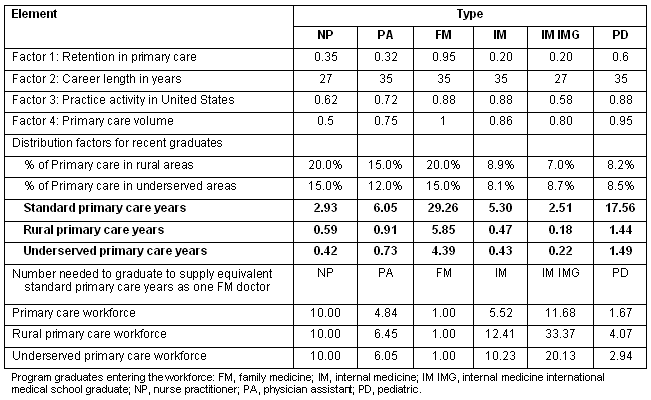
From these data, it can be seen that a replacement for a single family physician would take 10 nurse practitioners, or 5 physician assistants, or 5-6 internal medicine residency graduates, or 11-12 IMG internal medicine residency graduates or 1.7 pediatricians to contribute the same 29.3 standard primary care workforce years. The rural primary care and underserved primary care ratios are even higher for other forms of primary care that have lower rural or underserved location rates than family physicians.
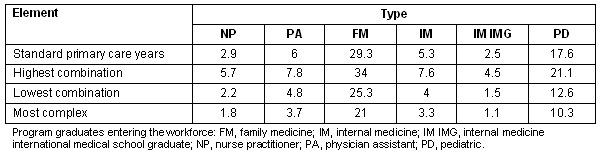
High, low, and lowest range estimates can be prepared using combinations of the highest available factors, combinations of the lowest, or situations likely to involve the most complex primary care situations. The most complex situations involve primary care forms involved in teaching, administration, or supervisory roles; situations with lower volume care (geriatrics, women's health, procedures); locations with patient populations with high no-show rates and unused capacity; or dysfunctional settings with poor support and numerous problems. These data are presented in Table 2.
Table 2: High and low ranges for estimated standard primary care years
Discussion
The strength of any research study is complete data. The standard primary care workforce year tool reveals that a major weakness of previous primary care workforce studies is missing data. Primary care studies must include entire populations of those trained in primary care. Missing graduates impair calculations of FTEs, practice activity levels, and specialization rates.
With limited outcomes data, there is limited understanding of important changes in primary care capacity.
The major limitation of any workforce study is assumptions. The author attempted to document the assumptions used for the estimates and the ranges of possibilities to allow scrutiny such that estimates can be improved in future studies. One of the limitations of the study is the same as that of most workforce studies at the current time. This study is just as likely to overestimate primary care, rural, and underserved contributions in internal medicine, physician assistants, and nurse practitioners as departures are likely to continue to increase throughout the 2 or 3 decades remaining in the careers of 2008 graduates. Family practice and pediatric contributions have so far remained more reliable over the years after graduation. Neither has been subjected to the temptation of higher salaries for leaving primary care, although this could change.
New terminology can also help in understanding primary care. 'Permanent' and 'flexible' are useful terms to describe the family practice residency graduates who are policy resistant and remain while other forms are policy sensitive. While family practice remains policy resistant once trainees reach residency training, the students facing the permanent primary care choice of family medicine during medical school are not policy resistant. The decision for family medicine is currently the most important decision in all of health care for those in need of primary care and health access. Once this decision is made, the US enjoys 29 years of primary care with optimal distribution. Once medical students pass on this decision, the opportunity is lost. It is most difficult to make a permanent primary care decision in the current policy era.
The failure of medical students to trust the choice of the remaining permanent form, rapid declines in primary care retention in the flexible forms, and progressive losses of rural and underserved workforce would seem to dictate loss prevention strategies in training and policy or major reforms. No such decisions are being made. In fact, the diversions away from primary care are increasing with new specialty tracks added each year to nurse practitioner and physician assistant training, more urgent care clinics, emergency care expansions, and increases in hospitalist forms. These deficits force healthcare systems to use expensive temporary solutions for nursing and physician workforce. Those employed by such agencies can often have better pay, have more flexible hours, and have fewer responsibilities. A vicious cycle is created with more leaving continuity care for temporary care forms and specialty careers.
Those in most need of healthcare workforce can actually contribute to the decline of primary care capacity. Rural and underserved clinics and hospitals have been granted the ability to use capitation or cost-based mechanisms that are more supportive than the current reimbursement mechanisms. Healthcare administrators can use this ability to pay the additional costs for hospitalists, rural emergency physicians, or temporary primary care physicians. Unfortunately those who fill these contracted positions often leave the continuity primary care practices most needed for health access.
It is a worst-case scenario for the primary care capacity pool. The supply line leaks potential primary care before it can reach the pool. Existing primary care capacity leaks out of widening cracks in the pool wall. New healthcare entities actively tap into the primary care pool to drain capacity. Differentials between primary care and specialty salaries and support levels, as well as failures in basic health access design, continue to drive this vicious cycle.
Conclusions
The standard primary care year allows different forms of primary care to be compared according to the time spent delivering primary care throughout an entire career. Adjustments can be made for changes in specialization, activity, career length, and volume. Activity, career length, and volume appear to be determined by the type of training form. The major changes have been in specialization rates with a pattern of decreasing primary care retention for all of the flexible training forms over time, and for policy eras that are less supportive of primary care.
A generic focus on additional primary care graduates will not restore health access in the US at the current time. Health access workforce recovery requires a primary care form with the highest level of retention in primary care, the longest career length, top practice activity levels, maximal primary care volume, and broadest distribution. Policies or incentives that rapidly increase the production of family physicians appear to be a best practices choice for a return to efficiency, effectiveness, versatility, and dependability in primary care.
Acknowledgements
The author acknowledges the Robert Graham Center for early technical assistance, Jennifer Richmond for editing assistance, the American Academy of Physician Assistants for their willingness to share workforce data at their web site with an entire nation, and the devoted primary care practitioners who continue to serve the health access needs of the United States.
References
1. Medical Marketing Service. AMA Physician Masterfile. (Online) 2005. Available: www.mmslists.com (Accessed 1 July, 2005).
2. Hyer JL, Bazemore AW, Bowman RC, Zhang X, Petterson S, Phillips RL. Rural origins and choosing family medicine predict future rural practice. American Family Physician 2007; 76: 207.
3. Mazzolini J. Visa program not helping ease Ohio's primary care doctors shortage. (Online) 2008. Available: http://www.cleveland.com/ (Accessed 1 August 2008).
4. Pugno PA, McGaha AL, Schmittling GT, DeVilbiss A, Kahn NB Jr. Results of the 2007 National Resident Matching Program: family medicine. Family Medicine 2007; 39(8): 562-571.
5. Garibaldi RA, Popkave C, Bylsma W. Career plans for trainees in internal medicine residency programs. Academic Medicine 2005; 80(5): 507-512.
6. American Academy of Physician Assistants. Data and statistics. (Online) 2006. Available: http://www.aapa.org/research/index.html (Accessed 26 October 2006).
7. Hooker RS. Physician assistants and nurse practitioners: the United States experience. Medical Journal of Australia 2006; 185(1): 4-7.
8. Larson EH, Palazzo L, Berkowitz B, Pirani MJ, Hart LG. The contribution of nurse practitioners and physician assistants to generalist care in Washington State. Health Services Research 2003; 38(4): 1033-1050.
9. Grumbach K, Hart LG, Mertz E, Coffman J, Palazzo L. Who is caring for the underserved? A comparison of primary care physicians and nonphysician clinicians in California and Washington. Annals of Family Medicine 2003; 1(2): 97-104.
10. Goolsby M. National NP sample survey comparisons over 15-year period. (Online) 2004. Available: http://66.219.50.180/NR/rdonlyres/ewz24bs6jt72aeldxgvk3woyo4dhasuc5hvwpt65bs2iyej2edd3723ri3ggb
wiptvoym2x7o37rwridsnb2tf3gfxh/2004NatlNPSampleSurveyWeb.pdf
(Accessed 22 February 2007).
11. Goolsby MJ. AANP Survey Report 2002. (Online) 2002. http://66.219.50.180/NR/rdonlyres/ejazrhpkecffex5r25nono4434d3mr6p3s4ferrdkch5hreqjyxoid22tacrzfyzv7uav2bgvjt6oo/
AANP%2bWebsite%2bPreliminary%2bReport.ppt (Accessed 1 August 2008).
12. American Medical Association. Physician Socioeconomic Statistics 1987-2005. Chicago, IL : AMA, 2005.
13. International Medical Graduate Section of the American Medical Association. Report on International Medical Graduates. Chicago, IL: AMA, 2007.
14. Keirns CC, Bosk CL. Perspective: the unintended consequences of training residents in dysfunctional outpatient settings. Academic Medicine 2008; 83(5): 498-502.
15. Vermont AHEC. AHEC's Vermont Primary Care Summary Report 2006. Burlington, VT: University of Vermont AHEC Program, 2006.
16. Larson E, Hart LG. Geographic and demographic dimensions of the adoption of a health workforce innovation: physician assistants in the United States, 1967-2000. Working Paper #105. Available: http://depts.washington.edu/uwrhrc/uploads/CHWSWP105.pdf (Accessed October 2007).
17. Larson EH, Hart LG, Ballweg R. National estimates of physician assistant productivity. Journal of Allied Health 2001; 30(3): 146-152.
18. Sox HC. Leaving (internal) medicine. Annals of Internal Medicine 2006; 144(1): 57-58.
19. Sox H. Career Changes in Medicine: Part II. Annals of Internal Medicine 2007; 145(10): 782-783.
20. Leigh JP, Kravitz RL, Schembri M, Samuels SJ, Mobley S. Physician career satisfaction across specialties. Archives of Internal Medicine 2002; 162(14): 1577-1584.
21. Randolph GD, Pathman DE. Trends in the rural-urban distribution of general pediatricians. Pediatrics 2001; 107(2): E18.
22. Committee on Pediatric Workforce. Pediatrician workforce statement. Pediatrics 2005; 116(1): 263-269.
23. Shipman SA, Lurie JD, Goodman DC. The general pediatrician: projecting future workforce supply and requirements. Pediatrics 2004; 113(3 pt 1): 435-442.
24. Althouse LA, Stockman JA 3rd. Pediatric workforce: a look at general pediatrics data from the American Board of Pediatrics. Journal of Pediatrics 2006; 148(2): 166-169.
25. Health Resources and Services Administration. The registered nurse population: findings from the 2004 National Sample Survey of Registered Nurses. Rockville, MD: 2004.
26. Goolsby MJ. 2001-2002 AANP national nurse practitioner practice site survey. Journal of American Academic Nurse Practitioners 2003; 15(11): 482-484.
27. Hooker RS, Berlin LE. Trends in the supply of physician assistants and nurse practitioners in the United States. Health Affairs (Millwood) 2002; 21(5): 174-181.
28. Running A, Calder J, Mustain B, Foreschler C. A survey of nurse practitioners across the United States. Nurse Practitioner 2000; 26(6): 15-16, 110-116.
29. Goolsby MJ. 2004 AANP National Nurse Practitioner Sample Survey, part I: an overview. Journal of American Academic Nurse Practitioners 2005; 17(9): 337-341.
30. Hooker R. The economic basis of physician assistant practice. Physician Assistant 2000; 24(4): 51-56.