


 download PDF
Introduction
Rabies is one of the oldest known zoonotic diseases caused by a virus, and death nearly always follows once an animal or human has been clinically ill1. Rabies affects the central nervous system of all endothermic animals, including humans2. Carnivorous animals such as dogs, cats, foxes, jackals, bats, raccoons and skunks (depending on the continent) are rabies reservoirs3. Rabies transmits to humans through close contact with the saliva (from a bite or scratch) of infected animals. The effect of rabies virus exposure depends on a number of factors, including the severity of the wound(s), the anatomical site of the bite on the body, the viral quantity and variant (genotype) inoculated into the wound(s), and the timeliness of post-exposure prophylaxis4. In 99% of human cases, domestic dogs are responsible for rabies virus transmission. However, other domestic animals, and wild animals, may also be the victims of the disease5.
Rabies is of significant economic and public health importance in areas where it is endemic. It is included in the list of transmissible diseases considered to be of socioeconomic and/or public health importance within countries6. Despite this, rabies is considered one of the neglected tropical diseases. The main reason for rabies to remain a neglected zoonotic disease in many developing countries, including those in Asia and Africa, is a lack of specific diagnostic and surveillance techniques7.
Rabies affects mainly low- and middle-income countries8. The disease has worldwide distribution, except in some countries where there is a strict quarantine system, a rigorous eradication program, or natural barriers like mountains and rivers7. Rabies occurs in more than 150 countries and territories. Canine rabies causes an estimated 61,000 deaths per year within the wider international community, of which 56% and 44% of the deaths occur in Asia and Africa, respectively4. According to WHO, dog-mediated rabies causes costs of A$6.23 (US$8.6) billion each year9. Rabies remains a very serious public health concern in most developing countries, where urban and suburban rabies are more prevalent and dogs (especially stray dogs) appear to be the main reservoir for disease transmission10.
In Ethiopia, a retrospective review of human rabies exposure cases revealed significant regional variation. In the Tigray Regional State (2012–2015) in northern Ethiopia, incidence rates ranged from 35.8 to 89.8 per 100,000 inhabitants per year11, while in subcities of the Ethiopian capital, Addis Ababa (2015–2019), cumulative incidence ranged from 0.1 to 24.8 per 100,000 inhabitants per year12. However, the actual burden of the disease is likely much higher due to substantial underreporting. Many cases go unreported or are not brought to health centers, primarily due to low public awareness of rabies and limited access to healthcare services13,14.
A systematic and meta-analysis of rabies incidence in Ethiopia reported an annual pooled incidence rate of human exposure to suspected rabid animals of 33.65 (95% confidence interval (CI)=31.82–35.49) per 100,000 humans and suspected rabies deaths in humans of 4.57 (95%CI=2.93–6.21) per one million humans annually15. Moreover, a retrospective study (1990–2000) indicated that, of 1936 laboratory-confirmed rabies cases in Addis Ababa, 1724 were dogs, 116 cats, 37 cattle, 13 horses, 19 donkeys, 13 sheep and goats, 7 hyenas, and 7 monkeys16.
In the North Western Zone of Tigray, a 4-year (2012–2015) retrospective study reported 2180 human rabies exposure cases in Suhul General Hospital. The majority were males (63%) aged >15 years. The calculated incidences per 100,000 population were 35.5, 63, 89.9 and 73.1 for the years of 2012, 2013, 2014, and 2015, respectively11. Furthermore, a 5-year (2014–2018) retrospective study conducted in Axum General Hospital, Central Zone of Tigray, showed a total of 2404 human rabies exposure cases out of which 59% were males aged >15 years17.
In the control and prevention of rabies, among other factors such as vaccination, surveillance, and dog management, the awareness of the community plays important role. Knowledge, attitudes, and practices (KAP) studies have been used widely to enhance community knowledge and thus change attitude and improve practices that may aid in disease prevention and control18. Hence, assessing the KAP of the community on rabies is an essential intervention in the control and prevention of rabies. However, generally in Ethiopia and specifically in the project area, there are few public KAP studies on rabies. A cross-sectional study conducted in and around Gondar, north-western Ethiopia, reported that out of the total (N=384) respondents, 51% had poor KAP on rabies. Educational status (χ2=21.152), monthly income (χ2=23.059), sex (χ2=11.249), source of information (χ2=8.594) and residence (χ2=4.109) were significantly associated with KAP scores (p<0.05)19. Another study, conducted in Addis Ababa, reported the levels of KAP of the community concerning rabies as follows. Out of the total (N=1260) respondents, 75% had a moderate level of knowledge, 52% had an intermediate attitude towards rabies, and 67% had an intermediate level of knowledge of practices towards rabies20.
Mapping the knowledge, perceptions, and existing practices regarding rabies is considered an important milestone in the control and prevention of the disease. As indicated above, although the magnitude and distribution of rabies exposure – both generally in Ethiopia and specifically in Tigray – is high, there has been no coordinated study on the community’s KAP concerning rabies in the Tigray Region.
Therefore, this study was designed to assess the community's level of KAP towards rabies, as well as to retrospectively analyze human and animal rabies exposure cases over the past 5 years in the project area.
Methods
Study area
The study was conducted in Raya-Alamata woreda and Ofla/Korem woreda of the Southern Zone of Tigray Regional State (Fig1), northern Ethiopia. Raya-Alamata and Ofla/Korem woredas are located at 577 km and 615 km north of the Ethiopian capital Addis Ababa, respectively.
Raya-Alamata woreda is a lowland area located at 12°25′ north and 39°33′ east, with an elevation of 1520 m above sea level. Out of the total population 33,876 (28.4%) are urban, and 85,403 (71.6%) are rural residents21. In the woreda there is one general hospital, which provides health services to the general population. There is also one medium-level veterinary clinic, which provides veterinary services to animal owners of the woreda.
Ofla/Korem woreda is located at 12°30′ north, 39°31′ east, and an elevation of 2539 m above sea level. During 2007, the national census of Ethiopia reported a human population of 16,856 (11.7%) urban and 126,889 (88.3%) rural22. In the woreda there is one general hospital and one medium-level veterinary clinic, which give health services to the human and animal populations, respectively.
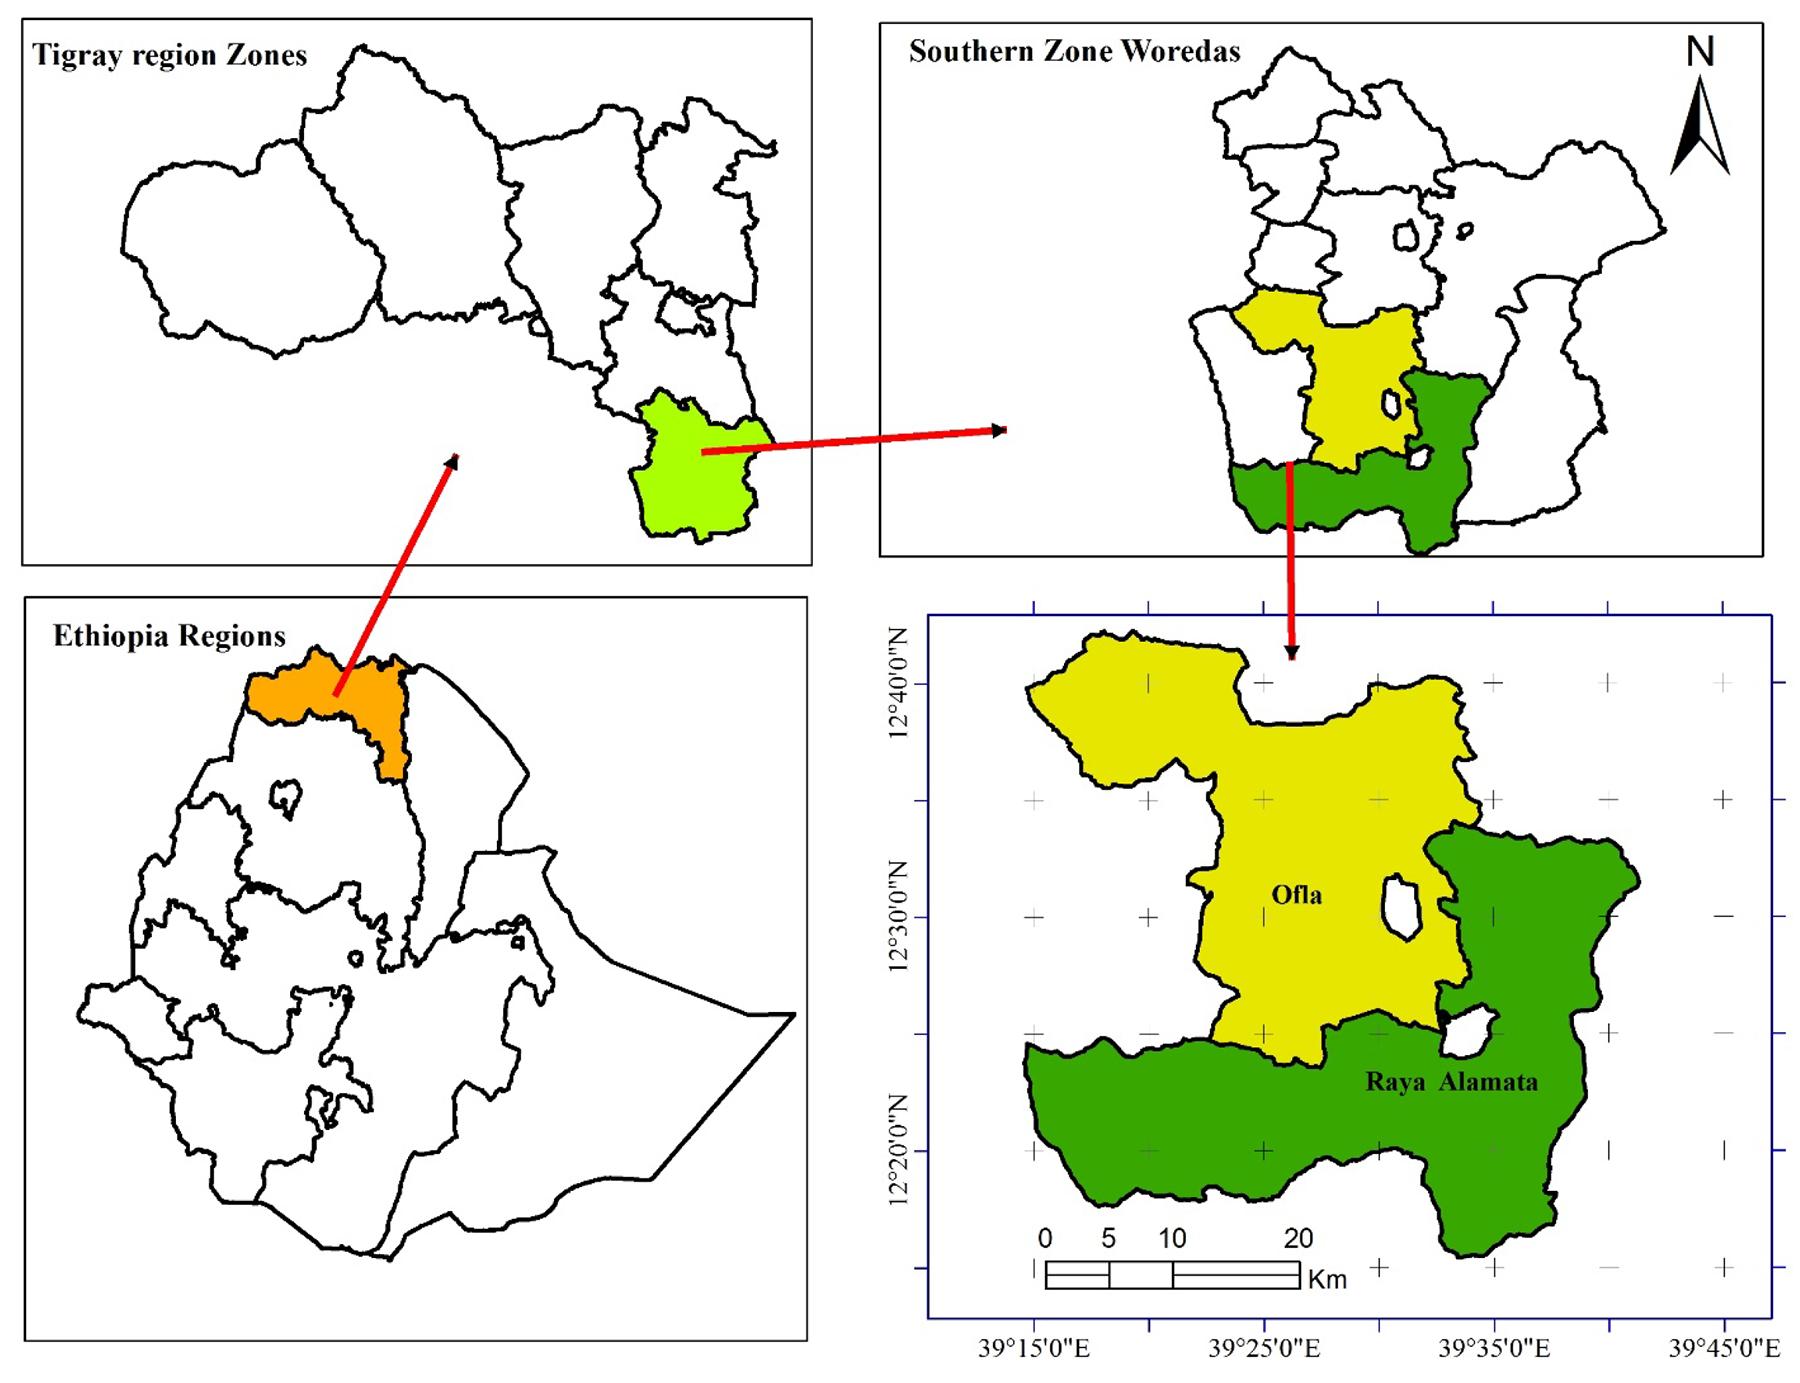 Figure 1: Map of the study area (created by ArcGIS_WGS_1984), Tigray, northern Ethiopia.
Study population
The study population for the KAP study was the human population at household level. For the retrospective study, the population was human and animal rabies cases (2017–2021) from the registration logbook of the general hospitals and medium-level veterinary clinics of the respective woredas.
Study design
A quantitative cross-sectional study, from September 2021 to August 2023, was conducted in the study area. A structured and close-ended questionnaire was developed to collect data for the KAP of the community on rabies, and various demographic data (sex, residence, age, occupation, educational status, and dog ownership) of the respondents. Retrospective 5-year (2017–20210) records of human and animal rabies exposures were collected from the registration logbooks of the hospitals and veterinary clinics of the respective woredas.
Sample size determination
For the KAP study, the required sample size determination was calculated as per Yamane’s recommendation considering 95% confidence interval and 5% absolute precision levels23, and 10% non-response rate. The calculated sample size was 437.
Sampling methods
A multistage sampling technique was employed for this study. Out of the total five woredas in the Southern Zone of Tigray, two (Raya-Alamata and Ofla/Korem) were purposively selected based on their geographical characteristics (highland and lowland) and the presence of relatively large veterinary clinics and human general hospitals. From each selected woreda, three kebeles (the lowest administrative units) were randomly selected. The selected kebeles and their respective populations were as follows:
- Raya-Alamata woreda: Waja-Timuga (n=14,284), Kebele 1 (n=11,204), and Kebele 2 (n=14,180)
- Ofla/Korem woreda: Adigolo (n=12,060), Hashenge (n=8322), and Harle (n=6239).
The predetermined sample size (N=437) was proportionally distributed among the selected kebeles based on their population sizes. Referring to the above proportion of urban and rural population of the studied area, at least 71.6% of the samples were drawn from the rural population. Within each selected kebele, households were chosen using a systematic random sampling technique. In each household, the household head was selected for the face-to face interview, provided that he/she was aged >15 years and had resided in the woreda for at least 6 months. If no eligible respondent was found in a selected household, the next household was approached until the required sample size was reached.
Data collection
To assess the community KAP about rabies, each respondent was asked, face-to-face, seven questions regarding knowledge, seven questions regarding attitude, and six questions regarding practices. The questionnaires were pretested before administration and adjusted accordingly. The procedure for pretesting the questionnaire included several steps. First, the draft questionnaire was reviewed and commented on by subject-matter experts. Second, it was administered to a small representative group to evaluate its clarity, flow, length, and response options. Third, the questionnaire was assessed for its simplicity and suitability for data entry.
For knowledge study
For the knowledge study, respondents received one mark for each question answered correctly and zero marks for each incorrect response. The responses for which respondents gave the correct answer were counted, and total knowledge was scored. The score varied from 1 to 7, and the mean score was computed by determining the total knowledge score of all respondents. Respondents who scored greater than or equal to the mean value of 4.5 were grouped as having good knowledge and coded as 0, whereas those who scored less than the mean value were grouped as having poor knowledge and coded as 1.
For attitude study
For attitude, there were seven positive statements with five choices: ‘strongly agree’, ‘agree’, ‘neutral’, ‘disagree’, and ‘strongly disagree’, with scores of 5, 4, 3, 2, 1, respectively. The score varied from 17 to 35, and all individual answers were summed for the total score and calculated for the mean value (26.25). Respondents who scored greater than or equal to the mean value were grouped as having a positive attitude level and coded as 0, whereas the respondents who scored less than the mean value were grouped as having a poor attitude level and coded as 1.
For practice study
Regarding practice, respondents received one mark for each question answered correctly and zero marks for each incorrect response. The responses for which respondents gave the correct answer were counted, and the total practice was scored. The score varied from 0 to 7, and the mean score was computed by determining the total practice score of all respondents. Respondents who scored greater than or equal to the mean value of 3.11 were grouped as having good practice and coded as 0, whereas those who scored less than the mean value were grouped as having poor practice and coded as 1.
For overall knowledge, attitude, and practice
To determine the overall KAP of respondents’ total knowledge scores, the total attitude score and total practice score were summed together, and the mean score was computed. Respondents who scored greater than or equal to the mean value of 33.8 were grouped as having good KAP and coded as 0, whereas those who scored less than the mean value were grouped as having poor KAP and coded as 1.
Data collection for retrospective study
For the retrospective study, data on human and animal rabies cases from the previous 5 years (2017–2021) were collected from the registration logbooks of general hospitals and medium-scale veterinary clinics in the respective woredas.
Data management and analysis
The data on KAP from the questionnaire survey, as well as from the rabies post-exposure prophylaxis registration book in human hospitals and animal rabies exposure records from veterinary clinics, were entered into an Excel sheet. The data were then exported to the Statistical Package for the Social Sciences v20 (IBM Corp; https://www.ibm.com/products/spss-statistics) for analysis. Descriptive statistics (frequency and percentage) were performed and presented in tables to summarize the data. Logistic regression was used to assess the association between independent variables and the dependent variable (KAP) of the community regarding rabies. In the bivariate analysis, variables with p-values less than 0.25 were selected for multivariate regression analysis because they were considered to have potential predictive effects on the response variable, as their associations may be masked by confounding or suppression effects. Therefore, this threshold was used as a screening criterion to allow variables to be included in the multivariate regression analysis. In the multivariate regression analysis, at 95% confidence interval (CI), variables with a p-value less than 0.05 were considered as statistically significant.
Ethics approval
This study was approved by the institutional review board (MU-IRB 1898/2021, July 01/20210) hosted at College of Health Sciences, Mekelle University, Ethiopia. Informed consent was obtained from all study participants after explaining the purpose and objectives of the study.
Results
Sociodemographic information of the community
During the study, a total of 437 respondents were interviewed. The majority of the respondents were males (351, 80.3%). The ages of respondents were classified as ≤30, 31–45, and ≥46 years, comprising about 49 (11.2%), 194 (44.4%), and 194 (44.4%) respondents, respectively. The majority of the respondents lived in rural areas (270, 61.8%). The majority of the respondents (301, 68.9%) had no formal education, followed by those with only primary education (57, 13.0%). Most of the respondents (243, 55.6%) were farmers. Of the total respondents, 115 (26.3%) had dogs (Table 1).
Table 1: Sociodemographic information of respondents in study area (N=437)
| Variable | Frequency | % | |
|---|---|---|---|
| Sex | Female | 86 | 19.7 |
| Male |
351 |
80.3 | |
| Residence | Urban | 167 | 38.2 |
| Rural |
270 |
61.8 | |
| Age group (years) | ≤30 | 49 | 11.2 |
| 31–45 |
194 |
44.4 | |
| ≥46 |
194 |
44.4 | |
| Occupation | Civil servant | 26 | 5.9 |
| Farmer |
243 |
55.6 | |
| Woman working at home |
67 |
15.5 | |
| Other |
101 |
23.1 | |
| Educational status | No formal education | 301 | 68.9 |
| Primary education |
57 |
13 | |
| Secondary education |
49 |
11.2 | |
| Higher education |
30 |
6.9 | |
| Dog ownership | Did not have dog | 322 | 73.7 |
| Had dog |
115 |
26.3 | |
Community knowledge regarding rabies
According to this study, more than half of the respondents (229, 52.4%) had poor knowledge of rabies. All respondents had heard about rabies. However, the majority (333, 76.2%) were found to have misconceptions about the causative agent, believing that thirst and starvation cause rabies. Most study respondents (293, 67.0%) knew that the species affected by rabies include canines, cattle, equines, and humans, and 400 (91.5%) recognized that rabies can be transmitted from animals to humans (Table 2).
Table 2: Frequency of respondent knowledge regarding rabies in study area (N=437)
| Question/statement | Response | Frequency | % |
|---|---|---|---|
| Have you heard about rabies? | Yes | 437 | 100 |
|
No |
0 |
0 | |
| What is the cause of rabies? | Virus | 103 | 23.6 |
|
Thirst and starvation |
333 |
76.2 | |
| Species affected by rabies are canines, cattle, equines, and humans. | Yes | 293 | 67.0 |
|
No |
144 |
33.0 | |
| Sources of rabies are domestic dogs, cats, bats, and wild canines. | Yes | 238 | 54.5 |
|
No |
199 |
45.5 | |
| Clinical signs and symptoms of rabies are salivation and change in behaviour, biting, cease eating and drinking. | Yes | 220 | 50.3 |
|
No |
217 |
49.7 | |
| Rabies can be transmitted from animals to humans. | Yes | 400 | 91.5 |
|
No |
37 |
8.5 | |
| Rabies can be transmitted by biting, contact of saliva with wounds and open mucous membrane. | Yes | 284 | 65 |
|
No |
153 |
35 |
Community attitudes regarding rabies
According to this study, more than half (240, 54.9%) of respondents had a negative attitude towards rabies. The results of the study revealed that community attitudes regarding the statement ‘Rabies is fatal’ were as follows: 110 (25.2%) strongly agreed, 206 (47.1%) agreed, 15 (3.4%) were neutral, 101 (23.1%) disagreed, and 5 (1.1%) strongly disagreed. For the statement ‘Stray dogs are dangerous’, 43 (9.8%) strongly agreed, 290 (66.4%) agreed, 97 (22.2%) were neutral and 7 (1.6%) disagreed.
Regarding the statement ‘Rabies can be prevented by educating people’, 83 (19.0%) strongly agreed, 249 (57.0%) agreed, 59 (13.5%) were neutral, and 46 (10.5%) disagreed. For the statement ‘Rabies is prevented by the killing of stray dogs’, 72 (16.5%) strongly agreed, 269 (61.6%) agreed, 85 (19.5%) were neutral, 17 (3.9%) disagreed, and 1 (0.2%) strongly disagreed.
For responses to the statement ‘Rabies can be prevented by mass vaccination of dogs’, 77 (17.6%) respondents strongly agreed, 196 (44.9%) agreed, 31 (7.1%) were neutral, 132 (30.2%) disagreed, and 1 (0.2%) strongly disagreed. For the statement ‘After being bitten by a rabid animal, washing with soap and water and going to a medical center is necessary’, 45 (10.3%) respondents strongly agreed, 349 (79.9%) agreed, 3 (0.7%) were neutral, and 40 (9.2%) disagreed. Regarding the statement ‘A bitten human cannot be cured after showing clinical signs’, 57 (13.1%) respondents strongly agreed, 240 (54.9%) agreed, 4 (0.9%) were neutral, 135 (30.9%) disagreed, and 1 (0.2%) strongly disagreed (Table 3).
Table 3: Frequency of community attitudes regarding rabies in study area (N=437)
| Statement | Response | Frequency | % |
|---|---|---|---|
| Rabies is fatal. | Strongly agree | 110 | 25.2 |
| Agree |
206 |
47.1 | |
| Neutral |
15 |
3.4 | |
| Disagree |
101 |
23.1 | |
| Strongly disagree |
5 |
1.1 | |
| Stray dogs are dangerous. | Strongly agree | 43 | 9.8 |
| Agree |
290 |
66.4 | |
| Neutral |
97 |
22.2 | |
| Disagree |
7 |
1.6 | |
| Rabies can be prevented by educating people. | Strongly agree | 83 | 19.0 |
| Agree |
249 |
57.0 | |
| Neutral |
59 |
13.5 | |
| Disagree |
46 |
10.5 | |
| Rabies is prevented by killing stray dogs. | Strongly agree | 72 | 16.5 |
| Agree |
269 |
61.6 | |
| Neutral |
85 |
19.5 | |
| Disagree |
17 |
3.9 | |
| Strongly disagree |
1 |
0.2 | |
| Rabies can be prevented by mass vaccination of dogs. | Strongly agree | 77 | 17.6 |
| Agree |
196 |
44.9 | |
| Neutral |
31 |
7.1 | |
| Disagree |
132 |
30.2 | |
| Strongly disagree |
1 |
0.2 | |
| After being bitten by a rabid animal, wash with soap and go to the medical center. | Strongly agree | 45 | 10.3 |
| Agree |
349 |
79.9 | |
| Neutral |
3 |
0.7 | |
| Disagree |
40 |
9.2 | |
| A bitten human can’t be cured after showing clinical signs of rabies. | Strongly agree | 57 | 13.1 |
| Agree |
240 |
54.9 | |
| Neutral |
4 |
0.9 | |
| Disagree |
135 |
30.9 | |
| Strongly disagree |
1 |
0.2 |
Community practices regarding rabies
Results for respondents’ practice regarding rabies revealed that more than half (245, 56.1%) had poor practice. The study showed that 80 (18.3%) of respondents vaccinated their dog, 57 (13.0%) had a vaccine certificate, and 327 (74.8) of the respondents did not keep their dog indoors. A total of 332 (76.0%) had a willingness to take training, and 350 (80.1%) replied that they would kill an animal after it became rabid. A total of 199 (45.5%) respondents said they used traditional treatments for those exposed to rabies (Table 4).
Table 4: Frequency of community practices regarding rabies in study area (N=437)
| Question/statement | Response | Frequency | % |
|---|---|---|---|
| Do you vaccinate your dog? | Yes | 80 | 18.3 |
| No |
357 |
81.7 | |
| Do you have a vaccination certificate for your dog? | Yes | 57 | 13.0 |
| No |
380 |
87.0 | |
| Do you keep your dog indoors or tied up? | Yes | 110 | 25.2 |
| No |
327 |
74.8 | |
| Are you willing to take training? | Yes | 332 | 76.0 |
| No |
105 |
24.0 | |
| Action-taking for rabid dogs | Tie | 87 | 19.9 |
| Euthanasia |
350 |
80.1 | |
| Action-taking for exposed human | Traditional treatment | 199 | 45.5 |
| Post-exposure vaccine |
238 |
54.5 |
Factors associated with community knowledge regarding rabies
The adjusted odds ratio of the present study of the multivariate logistic regression of knowledge in relation to sociodemographic factors revealed that living in a rural area (adjusted odds ratio (AOR)=5.08; p=0.002), being a farmer (AOR=3.99; p=0.022), being a woman working at home (AOR=48.70; p=0.003) and who did not own dog (AOR=473.20; p<0.001) were independent predictors of poor knowledge (Table 5).
In the present study, respondents who lived in rural areas were 5.08 times (95%CI=1.86–13.92) less likely to be knowledgeable than urban residents. Women at home were 48.70 times (95%CI=3.70–640.51) less likely to be knowledgeable than civil servants. Farmer respondents were 3.99 times (95%CI=1.46–134.25) less likely to be knowledgeable than civil servants. Respondents who did not have a dog were 473.20 times (CI=62.55–3579.84) less likely to be knowledgeable than dog owners.
Although the associations were not statistically significant (p>0.05), both sex and age showed potential effects on respondent level of knowledge. Female respondents had lower odds of having good knowledge compared to males (OR=0.79). Respondents aged 31–45 years had 20% lower odds (OR=0.80) of good knowledge compared to those aged ≥46 years, while those aged ≤30 years had 31% lower odds (OR=0.69) than those aged ≥46 years.
Table 5: Logistic regression results of community knowledge in relation to sociodemographic factors in study area (N=437)
| Variable |
Knowledge |
COR (95%CI) | p-value | AOR (95%CI) | p-value | ||
|---|---|---|---|---|---|---|---|
|
Good (%) |
Poor (%) |
||||||
| Sex | Female | 25 (12) | 61 (26.6) | 2.61 (1.59–4.43) | <0.001 | 1.27 (0.36–4.53) | 0.714 |
| Male |
183 (88) |
168 (73.4) | |||||
| Residence | Urban | 122 (58.7) | 45 (19.7) | ||||
| Rural |
86 (41.3) |
184 (80.3) | 15.80 (3.78–8.89) | <0.001 | 5.08 (1.86–13.92) | 0.002 | |
| Occupation | Civil servant | 25 (12) | 1 (0.4) | ||||
| Farmer |
90 (43.3) |
153 (66.8) | 142.5 (5.66–318.99) | <0.001 | 3.99 (1.46–134.25) | 0.022 | |
| Woman working at home |
9 (4.3) |
58 (25.3) | 161 (19.37–1340.27) | <0.001 | 48.70 (3.70–640.51) | 0.003 | |
| Other |
84 (40.4) |
17 (7.4) | 5.06 (0.64–39.92) | 0.124 | 4.27 (0.50–36.27) | 0.184 | |
| Dog ownership | Did not have dog | 94 (45.2) | 228 (99.6) | 273.14 (40.34–2130.11) | <0.001 | 473.20 (62.55–3579.84) | <0.001 |
| Had dog |
114 (54.8) |
1 (0.4) | |||||
AOR, adjusted odds ratio. CI, confidence interval. COR, crude odds ratio.
Factors associated with community attitudes regarding rabies
The AOR analysis revealed that being female (AOR=4.43; 95%CI=2.07–9.49; p<0.001), living in a rural area (AOR=17.89; 95%CI=9.34–34.66; p<0.001), and not owning a dog (AOR=215.31; 95%CI=61.28–756.46; p<0.001) were significantly associated with higher odds of having a poor attitude.
Although not statistically significant, respondents aged 31–45 years had lower odds (AOR=0.741; 95%CI=0.40–1.38) of having a poor attitude compared to those aged ≥46 years. Conversely, respondents aged ≤30 years had 1.6 times higher odds of having a poor attitude compared to those aged ≥46 years, though this result was also not statistically significant (Table 6).
Table 6: Logistic regression results of community attitudes in relation to sociodemographic factors in study area (N=437)
| Variable |
Attitude |
COR (95%CI) | p-value | AOR (95%CI) | p-value | ||
|---|---|---|---|---|---|---|---|
|
Good (%) |
Poor (%) |
||||||
| Sex | Female | 24 (12.2) | 62 (25.8) | 2.51 (1.49–4.20) | <0.001 | 4.43 (2.07–9.49) | <0.001 |
| Male |
173 (87.8) |
178 (74.2) | |||||
| Age group (years) | ≤30 | 13 (6.6) | 36 (15) | 2.07 (1.03–4.14) | 0.042 | 1.60 (0.47–5.44) | 0.454 |
| 31–45 |
101 (51.3) |
93 (38.8) | 0.66 (0.44–0.97) | 0.064 | 0.741 (0.40–1.38) | 0.344 | |
| ≥46 |
83 (42.1) |
111 (46.2) | |||||
| Residence | Urban | 221 (61.4) | 46 (19.2) | ||||
| Rural |
76 (38.6) |
194 (80.8) | 6.36 (4.14–9.76) | <0.001 | 17.89 (9.34–34.66) | <0.001 | |
| Dog ownership | Did not have dog | 86 (43.7) | 236 (98.3) | 76.1 (27.25–212.79) | <0.001 | 215.31 (61.28–756.46) | <0.001 |
| Had dog |
111 (56.3) |
4 (1.7) | |||||
AOR, adjusted odds ratio. CI, confidence interval. COR, crude odds ratio.
Factors associated with community practices regarding rabies
The AORs from the multivariate logistic regression analysis revealed that secondary education status (AOR=0.03; p=0.035), not owning a dog (AOR=53.02; p=0.013), poor knowledge (AOR=10.30; p=0.03), and poor attitudes (AOR=614.67; p<0.001) were independent predictors of poor practice. Respondents who had completed secondary education had odds of better practices that were 0.03 (95%CI=0.001–0.778) times those of respondents who had higher education.
Those who did not own a dog had odds of better practices that were 53.02 (95%CI=2.32–1209.50) times lower than for those who owned a dog. The odds of poor practice were 10.30 (95%CI=1.22–87.14) times higher in respondents with poor knowledge than those having good knowledge. Furthermore, attitude was found to determine the practices of respondents. People having poor attitudes towards rabies management practices had odds that were 614.67 (95%CI=75.43–5008.86) times lower than their counterparts with good attitudes towards rabies management.
Both residence and age of respondents were found to affect practices of respondents on prevention and control of rabies, though it was not statistically significant (p>0.05). People residing in rural areas had odds of poor practice that were 3.5 (95%CI=0.40–31.21) times higher than their urban resident counterparts. According to age group, respondents aged ≤30 years were found to have odds of better practice that were 4.2 (95%CI=0.13–137.95) times lower than those aged 46 years or more. Furthermore, respondents aged 31–45 years had odds of better practice that were 0.89 (95%CI=0.14–5.59) times higher than respondents aged ≥46 years (Table 7).
Table 7: Logistic regression results of community practice in relation to sociodemographic factors (N=437)
| Variable |
Practices |
COR (95%CI) | p-value | AOR (95%CI) | p-value | ||
|---|---|---|---|---|---|---|---|
|
Good (%) |
Poor (%) |
||||||
| Sex | Female | 24 (12. 5) | 62 (25.3) | 2.34 (1.42–4.1) | <0.001 | 1.67 (0.22–12.94) | 0.623 |
| Male |
168 (87.5) |
83 (74.7) | |||||
| Age group (years) | ≤30 | 13 (6.8) | 36 (14.7) | 1.79 (0.91–3.55) | 0.090 | 4.20 (0.13–137.95) | 0.421 |
| 31–45 |
102 (53.1) |
92 (37.6) | 0.61 (3.97– 8.88) | 0.011 | 0.89 (0.14–5.59) | 0.901 | |
| ≥46 |
77 (40.1) |
117 (47.8) | |||||
| Residence | Urban | 118 (61.5) | 49 (20) | ||||
| Rural |
74 (38.5) |
196 (80) | 6.378 (4.16–9.77) | <0.001 | 3.52 (0.40–31.21) | 0.258 | |
| Educational status | Secondary education | 4 (22.9) | 5 (2) | 3.295 (0.366–29.67) | 0.280 | 0.03 (0.001–0.778) | 0.035 |
| Primary education |
54 (28.1) |
3 (1.2) | 1.61 (0.60–16.19) | 0.685 | 0.13 (0.01–2.27) | 0.160 | |
| No formal education |
65 (33.9) |
236 (96.3) | 105.29(14.08–787.627.29) | <0.001 | 0.00 (0.00–∞) | 0.998 | |
| Higher level |
29 (15.1) |
1 (0.4) | |||||
| Dog ownership | Did not have dog | 79 (41.1) | 243 (99.2) | 173.79 (41.96–719.694) | <0.001 | 53.02 (2.32–1209.50) | 0.013 |
| Had dog |
113 (58.9) |
2 (0.8) | |||||
| Knowledge | Good | 190 (99) | 18 (7.3) | ||||
| Poor |
2 (1) |
227 (92.7) | 1198 (274–5229) | <0.001 | 10.30 (1.22–87.14) | 0.03 | |
| Attitudes | Good | 188 (97.9) | 9 (3.7) | 3042 (717.92–12889.74) | <0.001 | 614.67 (75.43–5008.86) | <0.001 |
| Poor |
4 (2.1) |
236 (96.3) | |||||
AOR, adjusted odds ratio. CI, confidence interval. COR, crude odds ratio.
Factors associated with community overall KAP regarding rabies
The overall KAP of the participants was found to be below average. A total of 53.1% of respondents had poor overall KAP, while the remaining 46.9% had good overall KAP. Being female (AOR=4.59; p<0.001) and living in a rural area (AOR=8.02; p<0.001) were identified as independent predictors of poor KAP. However, age showed no statistically significant association with overall KAP (p>0.05) (Table 8).
Some independent variables were omitted because some factors did not have any significant influence on overall KAP (p>0.05).
Table 8: Logistic regression results of community overall KAP in relation to sociodemographic factors in study area (N=437)†
| Variable |
Overall KAP |
COR (95%CI) | p-value | AOR (95%CI), | p-value | ||
|---|---|---|---|---|---|---|---|
|
Good (%) |
Poor (%) |
||||||
| Sex | Female | 25 (12.2) | 61 (26.3) | 2.57 (1.54–4.28) | <0.001 | 4.59 (2.5–8.43) | <0.001 |
| Male |
180 (87.8) |
171 (73.7) | |||||
| Age group (years) | ≤30 | 15 (7.3) | 34 (14.7) | 1.77 (0.9–3.46) | 0.096 | 1.32 (0.63–2.76) | 0.464 |
| 31–45 |
105 (51.2) |
8 (38.4) | 0.66 (0.44–0.99) | 0.043 | 0.68 (0.43–1.07) | 0.09 | |
| ≥46 |
85 (41.5) |
10 (47.8) | |||||
| Residence | Urban | 123 (60) | 44 (19) | ||||
| Rural |
82 (40) |
188 (81) | 6.41 (4.17–9.86) | <0.001 | 8.02 (4.95–13.01) | <0.001 | |
† Despite acceptable model discrimination, some predictors showed unstable estimates with wide confidence intervals, possibly due to strong associations between predictors and outcome.
AOR, adjusted odds ratio. CI, confidence interval. COR, crude odds ratio. KAP, knowledge, attitudes, and practices.
Retrospective data of human rabies exposure
In the studied area, 375 human rabies exposures were recorded. The sex-specific distribution of the data showed that the majority of rabies exposures were males, accounting for 303 cases (80.8%). Children aged <13 years were the most affected age group, with 162 cases (43.2%). This study showed that a greater number of human rabies exposures, 323 cases (86.1%), occurred among people from rural areas. The majority of human rabies exposure cases, 372 (99.2%), were caused by dogs, while 3 cases (0.8%) were caused by donkeys. A significant number of rabies exposures were reported during the summer and spring, with 269 cases (71.7%) and 68 cases (18.1%), respectively. In contrast, a lower proportion of exposures occurred during the fall (30 cases, 8%) and winter (8 cases, 2.1%). A total of 42 individuals (11.2%) did not receive post-exposure prophylaxis (Table 9).
Table 9: Retrospective data for human rabies exposure in study area (2017–2021) (N=375)
| Variable | Frequency | % | |
|---|---|---|---|
| Hospital | Raya-Alamata | 321 | 85.6 |
| Ofla/Korem |
54 |
14.4 | |
| Residence | Rural | 323 | 86.1 |
| Urban |
52 |
13.9 | |
| Sex | Male | 303 | 80.8 |
| Female |
72 |
19.2 | |
| Age group (years) | 0–12 | 162 | 43.5 |
| 13–24 |
88 |
23.5 | |
| 25–64 |
56 |
15.0 | |
| >65 |
69 |
18.0 | |
| Occupation | Employed | 3 | 0.8 |
| Unemployed |
46 |
12.3 | |
| Farmer |
154 |
41 | |
| Student |
147 |
39.2 | |
| Woman working at home |
25 |
6.7 | |
| Post-exposure prophylaxis taken | Yes | 333 | 88.8 |
| No |
42 |
11.2 | |
| Type of exposure | Bite | 369 | 98.4 |
| Contact |
6 |
1.6 | |
| Responsible animal | Dog | 372 | 99.2 |
| Donkey |
3 |
0.8 | |
| Site of exposure | Hand | 53 | 14.1 |
| Other body part |
14 |
3.7 | |
| Leg |
307 |
81.9 | |
| Face |
1 |
10.3 | |
| Season of bite | Summer | 269 | 71.7 |
| Autumn |
30 |
8 | |
| Winter |
8 |
2.1 | |
| Spring |
68 |
18.1 | |
Retrospective data of animal rabies exposure
In the present study, 71 animal exposure cases were obtained from the medium level-veterinary clinics of the two woredas. The majority affected animals were canines (45, 63.4%) followed by bovines (17, 23.9%) (Table 10). Animal rabies cases were not confirmed by a laboratory test examination due to lack of laboratory facilities.
Table 10: Retrospective data for animal rabies exposures in study area (2017–2021(N=71)
| Species | District |
Total n (%) |
|
|---|---|---|---|
|
Raya-Alamata n (%) |
Ofla/Korem n (%) |
||
| Canine | 25 (62.5) | 20 (64.5) | 45 (63.4) |
| Bovine | 10 (25) | 7 (22.6) | 17 (23.9) |
| Equine | 5 (12.5) | 3 (9.7) | 8 (11.3) |
| Ovine | – | 1 (3.2) | 1 (1.4) |
Discussion
In this study, more than half (53.1%) of the respondents demonstrated poor KAP regarding rabies. This aligns with a study by Yalemebrat et al24 who reported 60.3% poor KAP in Debark District, north-western Ethiopia. The low KAP levels may stem from limited community awareness, cultural beliefs, low education levels, personal experience, and lack of access to information. Female respondents were also found to be 4.59 times more likely to have lower KAP than males (95%CI=2.5–8.43; p<0.001), consistent with findings from Jimma, south-western Ethiopia, by Abdela et al18, who reported a value of 37.1 times. This could be because males are more involved in outdoor activities, which expose them to more rabies-related information. Moreover, urban residents demonstrated significantly better knowledge than rural residents. Rural dwellers were 8.02 times more likely to have lower KAP (95%CI=4.95–13.01; p<0.001), consistent with findings from Jimma, south-western Ethiopia, where urban residents were 4.35 times more likely to have better knowledge than those living rurally18. This is likely due to urban areas having better access to information, veterinary services, and health education.
The present study also found that 52.4% of respondents had poor knowledge, 54.9% had poor attitudes, and 56.1% had poor practices. Hagos25 reported higher KAP in Mekelle (knowledge, 56.1%; attitude, 56.2%; practice, 61.3%). This could be attributed to Mekelle's urban status (as the capital of Tigray), where residents likely receive more informal and formal health education than the mostly rural and less-educated respondents in the present study.
In terms of treatment preferences, according to the present study 45.5% of respondents favored traditional treatment, while 54.5% preferred post-exposure vaccination. These findings are similar to those in south-western Ethiopia, where 30.4% preferred traditional remedies, 3.7% spiritual healers, and 65.9% vaccines18. Reasons for choosing traditional methods include lack of awareness about vaccination and poor accessibility to health services, emphasizing the need for health education and improving the health system coverage.
Women at home and farmers were 48.70 and 3.99 times more likely to have lower knowledge levels, respectively, than civil servants, likely due to literacy gaps. Civil servants, being more educated, have greater access to rabies-related information. Moreover, respondents without dogs were 473.20 times more likely to have poorer knowledge compared to dog owners. A previous study noted that non-dog owners were 2.9 times more likely to have poor knowledge18. Dog ownership often leads to more exposure to veterinary information, especially during vaccination.
Among those surveyed, 97% of respondents who completed secondary education demonstrated good practices, sometimes even better than those with higher education. This may be because many secondary school graduates own dogs and receive information directly from veterinarians during vaccination campaigns.
According to this study, participants with poor knowledge and attitude were 10.30 and 614.67 times more likely to demonstrate poor practices, respectively. This underscores the link between knowledge, attitudes, and practices, suggesting that better education can improve behavior.
In the study area, 375 human rabies exposures were reported in general hospitals, while 71 animal cases were recorded in veterinary clinics. Dogs were responsible for 98.4% (369 cases) of human exposures, consistent with studies by Yibrah and Damtie26, and Teklu et al11, who also found that all cases were dog-related. This reflects the high level of human–dog interaction in Ethiopia, particularly in rural areas where dog ownership is common. While the exact statistic (‘at least one dog per rural household’) is hard to find in census-level data, multiple peer-reviewed studies and reports do support the general observation that dog ownership in rural Ethiopian households is very high, often approaching or exceeding one dog per household. Additionally, despite the increasing number of stray dogs in the country, there is no regular or systematic vaccination program for dogs.
Most human rabies cases (303, 80.8%) occurred in males, aligning with studies in Tigray11 and north-western Ethiopia27. This may be due to men’s involvement in outdoor work, whereas cultural and religious norms keep women indoors.
A large majority (85.6%) of rabies cases were reported from rural areas. Similar findings were observed by Aleme (59.4%)6, Yizengaw et al (73.2%)27 and Kankya et al28. These higher rural rates likely reflect limited knowledge, negative attitudes, and lack of veterinary services.
Seasonal distribution showed that most cases occurred during summer (269 cases, 71.7%) and spring (68 cases, 18.1%). This is consistent with studies in north-western Amhara, Ethiopia, which reported 26% and 39% during summer and spring27. The higher incidence is likely tied to the breeding season of dogs. However, a study in Gondar reported more cases in fall and winter26, likely due to regional climatic differences.
None of the 375 human rabies cases were lab-confirmed due to the absence of diagnostic facilities, highlighting systemic issues. The lack of laboratory infrastructure and essential medical supplies like vaccines and post-exposure prophylaxis weakens rabies prevention efforts. Limited healthcare coverage and a lack of collaboration between human and animal health sectors further hinder control efforts. This underscores the need for a coordinated One Health approach to effectively manage zoonotic diseases like rabies.
Among animals, most rabies cases occurred in dogs (63.4%), followed by bovines (23.9%), confirming dogs as the main source of human rabies transmission. This finding aligns with Aleme’s study, which found 70.78% of cases in dogs and 9.8% in bovines6. As with human cases, none of the 71 animal cases were lab-confirmed, again due to a lack of diagnostic facilities.
Conclusion
The study revealed that more than half of respondents had poor KAP towards rabies. Poor knowledge and attitudes were significantly associated with rural residence and lack of dog ownership, while poor practices were linked to secondary education, not owning dogs, and poor knowledge and attitudes. Overall KAP was poor, with female sex and rural residence identified as significant risk factors. Retrospective findings showed a high incidence of human rabies, mainly due to dog bites, particularly affecting males, children aged <15 years, and rural residents. In animals, most rabies cases occurred in dogs, alongside inadequate veterinary infrastructure and weak human–animal health integration.
Based on this conclusion the following recommendations are forwarded.
There is a need for an increased public education and awareness creation on rabies. Community-based education regarding rabies should be provided – especially for rural residents, women working at home, farmers, and those who do not own dogs. Government bodies should provide sufficient human and veterinary healthcare facilities. Regular mass vaccination of owned dogs and elimination of stray dogs are important interventions. Finally, to have successful rabies prevention and control strategies, there should be a strong intersectorial collaboration between public health, veterinary professionals, and local authorities in a One Health approach.
Acknowledgements
The authors thank all civil servants working at Raya-Alamata and Ofla/Karem woredas, and the general hospitals and veterinary clinics of the studied areas, for their technical contribution to the study. The authors also thank Mrs Teamu Negash for project area map development.
Funding
No funding was received for this study.
Conflicts of interest
The authors report no conflict of interest in this work.
AI disclosure statement
The authors used, for some parts of the article, ChatGPT v5.5 to perform grammar checks during their reviewing process.
Data availability
The data regarding this study can be obtained from the corresponding author on reasonable request.