


 download PDF
Introduction
Cognitive impairment is linked with poor sleep health (eg sleep duration, sleep efficiency, daytime sleepiness1) and is more prevalent in rural areas2, where approximately 15% of Americans reside3. Rurality can be categorized by descriptive, sociocultural4, population, or geographic criteria5. Despite urban–rural differences in cognitive impairment6 and poor sleep health7 in aging populations, their interactive association is unclear. Further understanding these interrelationships may inform precision medicine approaches by identifying potential treatment targets prior to cognitive impairment onset.
Age-related changes in cognition8-10 and sleep11 are well documented. Throughout the lifespan, processing speed10,12, divided attention13, memory (episodic9,14,15 working16, source and prospective memory17), and executive functioning9,10 generally decline. However, spatial attention18,19, sustained attention20, and semantic memory9, are relatively preserved. Sleep complaints are common in aging populations, with approximately 57% of older adults reporting at least one sleep complaint21. With age, sleep onset latency (time to sleep onset), wake after sleep onset22,23, and sleep disturbances24 increase, while total sleep time and sleep efficiency decline11. In older adults, poor sleep health is further associated with worse cognition1,25.
Although associations between rurality and cognition are limited26, existing findings indicate higher cognitive impairment prevalence in rural older adults2,27,28, with twice the likelihood compared to non-rural counterparts2,27,29. Additionally, the rural oldest older adults (aged ≥75 years) were more likely to have dementia than non-rural counterparts2,6. In objective cognitive tests, some studies report worse global cognitive functioning26, verbal learning, memory and fluency, orientation, and memory for rural versus non-rural older adults30.
Findings regarding rurality and sleep associations are inconsistent. In rural areas, the prevalence of poor sleep quality is approximately 27% in middle-aged adults31, approximately 58% in mid-to-late-life adults32, and approximately 33–44% in older adults33-35. Rural older adults most frequently reported difficulty initiating sleep (40–85%32-34), sleep disturbances (44–82%33,36), and sleep complaints33. Despite rural older adults generally reporting worse sleep quality35,36 and sleep duration than non-rural aging adults37, other work has showed that non-rural adults across the lifespan have worse sleep health38. Some work also reports no rurality differences in sleep efficiency among older adults39. Notably, several rurality–sleep investigations were conducted in rural regions of China, and their findings may reflect cultural, healthcare, and environmental conditions that may differ from Western and US rural contexts, limiting direct generalizability. Therefore, further investigations of rurality–sleep associations in geographically rural areas in the US are warranted.
Although rurality and sleep are independently linked to cognition, their interactive association is unclear. Existing findings suggests that rural older adults with poor total sleep time, sleep efficiency, and daytime fatigue experienced a higher risk of all-cause dementia and Alzheimer’s disease, and those with mild cognitive impairment were 1.5 times more likely to have sleep disturbances7. Conversely, non-rural-residing older adults with poor sleep quality had a faster rate of cognitive decline than healthy sleeping counterparts40. Therefore, further delineating the interactive association between rurality and sleep with cognition is warranted.
The present preliminary study examined whether rurality (non-rural v rural) moderates the associations between self-reported sleep and cognitive domains: working memory, executive functioning, spatial attentional orienting, and processing speed. We hypothesized that rurality would moderate the relationship between self-reported sleep and cognition; however, we did not have specific directional hypotheses regarding whether non-rural or rural areas would show stronger associations, given previous inconsistent findings.
Methods
Participants
Qualtrics (Qualtrics (https://www.qualtrics.com) market research panels recruited middle-aged and older adults using digital fingerprinting technology and IP addresses to ensure data reliability and validity. Qualtrics maintains a large, nationally distributed US participant pool to identify eligible panel members based on demographic screening criteria (eg US residency status) and distributes study initiations through their secure system. Participants provided their email address and ZIP code for compensation and demographic purposes.
The present study used a subsample of participants from a larger survey cohort (n=28141), specifically those participants who completed the objective cognition measures. Informed consent was obtained before survey administration. Inclusion criteria included age ≥50; US residency; no cognitive impairment or major neurological disorders (eg dementia, Parkinson’s disease, epilepsy); and normal/corrected vision and hearing. Participants receiving treatment for cognition, mood, fatigue, or substance use, or non-pharmacological sleep treatment, were excluded. Participants were compensated US$6.50 (A$9.29). The University of Missouri’s Institutional Review Board reviewed and approved all study procedures for both the larger survey cohort and the present study subsample (IRB# 2075002).
Measures
Rurality
Participants reported ZIP codes using an online demographic questionnaire, determining county and state residential location via the zipcodeR package in R software v4.4.1 (R Project; https://www.r-project.org). The US Department of Health Resources and Services Administration (HRSA42) incorporates federal rural definitions – including those from the US Census Bureau and Office Management and Budget43, and Rural-Urban Commuting Area (RUCA) codes44 – to determine rurality by county and state43. RUCA codes were linked to participants’ ZIP codes to determine rurality (coded as 0, non-rural; 1, rural43,44). RUCA code classifications were used as recommended given the methodological robustness and precision for identifying rural and non-rural areas compared to other federal classifications5,45. Consistent with HRSA’s criteria, rural areas were defined as RUCA codes 4–10, while all other RUCA codes were defined as non-rural areas42.
Self-reported sleep
The Pittsburgh Sleep Quality Index (PSQI46) assessed self-reported sleep with seven components (scored 0–3), and higher scores indicating worse perceived sleep. Components scores are summed to calculate the PSQI global score (PSQI total, score range 0–21), with higher scores indicating worse overall sleep quality. In addition to PSQI total, the PSQI also measures specific sleep parameters, with sleep parameters of interest including total sleep time (hours) and sleep efficiency (calculated as the percentage total sleep time relative to total time in bed and ranging from 0% to 100%).
Objective cognition
Objective cognition measures were administered online using Inquisit Web (Millisecond; https://www.millisecond.com), which has demonstrated performance comparability to the lab-based Stroop color–word test47, Wisconsin Card Sorting Test48, Posner cueing task49, and Sternberg working memory task50. After completing self-reported measures in Qualtrics, participants were sent an email with direct links to the Inquisit Web platform to complete the computerized tasks. All tasks were administered remotely, and responses – including key presses – were recorded automatically by the Inquisit system.
Working memory
The Sternberg working memory task51 presented a sequence of two to seven digits (100 ms each), followed by a probe digit. Participants indicated (by key press) whether the digit probe was previously presented (‘in-trial’) or not (‘out-trial’). Each test block included 18 trials (nine in-trials and nine out-trials), with digit set sizes randomized. A response initiated the next trial, and feedback (green ‘O’, correct; red ‘X’, incorrect) was presented (500 ms). The proportion of correct trials was computed, with higher scores demonstrating better working memory.
Executive function
The Wisconsin Card Sorting Test52,53 measures set-shifting ability, an executive function. Participants sorted 128 response cards against four key cards, varying on three dimensions (card/sorting rules): colors (red, blue, yellow, or green), shapes (crosses, circles, triangles, or stars), and number of shapes (one to four shapes). Each trial consisted of four key cards, and feedback (green ‘O’, correct; red ‘X’, incorrect) was presented. Sorting rules changed without warning after four consecutive card sort responses, and the task terminated after the participant completed six categories (twice for each dimension) or after 128 trials53. Set-shifting performance was computed as the number of completed categories, scores ranging 1–6, with higher scores demonstrating better set-shifting.
Processing speed and inhibition
The Stroop color–word test54 measured processing speed and inhibition. Participants indicated one of four color words (red, green, blue, black) presented at center screen by a key press. Stimuli consisted of 84 randomized trials – each trial type presented seven times – classified as control (colored rectangles as stimuli; assessing processing speed), congruent (color of the word and name of the color are the same; assessing processing speed and attention), and incongruent (color of the word and name of the color are different; assessing inhibition). A red ‘X’ (400 ms) was presented for incorrect responses. The intertrial interval time is 200 ms. Time from color–word rectangle stimuli onset until response for correct trials for each trial type were used to compute mean reaction times, with higher mean reaction times demonstrating worse processing speed (slower reaction times). The Stroop interference score was calculated as the difference between incongruent and congruent reaction time trials, with higher reaction times indicating worse inhibition (ie executive function).
Spatial attentional orienting
The Posner cueing task measures spatial attentional orienting55. Participants view a screen image of two boxes flanking a central fixation cross (1000 ms), and they press the keyboard space bar when they detect the target star shape (1000 ms) in one of the boxes. A valid cue was presented (20 ms) for 80% of trials, predicting target location. An invalid cue was presented (20 ms) for 20% of trials, predicting opposite target location. Two test blocks (100 trials each) were presented: 50% exogenous (peripheral) cues (highlighting the flanked box) and 50% endogenous (central) cues (with an arrow above the fixation cross). Cue–target stimulus onset asynchrony was either 100 ms (50% of trials) or 1500 ms (50% of trials). Invalid minus valid trial mean reaction times were calculated for each block of trials (with exogenous or endogenous cues), computing exogenous and endogenous attentional orienting scores. Lower reaction times indicate better spatial attention orienting.
Statistical analysis
Standardized moderated regression analyses were conducted in R software, testing five objective cognition criterion variables – Sternberg working memory task, Wisconsin Card Sorting Test, Stroop controlled trials and Stroop interference, Posner endogenous orienting, and Posner exogenous orienting scores – in separate models. Independent variables included self-reported sleep (PSQI: total sleep time, sleep efficiency, total) and rurality (0, non-rural; 1, rural), and their interaction (sleep × rurality). Given known associations with sleep and/or cognition, analyses controlled for age11,56, sex (0, male; 1, female11,57) and years of education58.
Simple slopes (via reghelper package in R) further evaluated the strength of associations between self-reported sleep and cognitive performance at the different levels of the moderator (rural/non-rural areas) for significant interactions. Regression coefficients and η2 for the interaction terms (via anova_stats package in R) were used as effect sizes (small, 0.01; medium, 0.06; large, 0.1659). Given the preliminary nature of the present study and limited findings of sleep–rurality associations with cognition, family-wise error corrections were not conducted and we accepted the false-positive risk in our analyses60. Alpha levels of 0.05 were used for all analyses.
The present study consists of a secondary analysis and subsample of participants from a larger survey cohort (N=28141); therefore, the sample was constrained by the number of participants who completed all of the required measures. Given the preliminary nature of the present study, an a priori power analysis was not conducted; rather, a posthoc evaluation indicated that the final sample size met commonly recommended observation-to-predictor ratios61 for preliminary moderated regression analyses.
Ethics approval
The Institutional Review Board (IRB) Ethics Review Committee at the University of Missouri approved all procedures for both the larger survey cohort and the present subsample analysis under a single IRB protocol (IRB#: 2075002) on 1 December 2021. Participants provided their written consent for review and signature before the start of the study. The current data analysis was conducted using de-identified data in accordance with the IRB guidelines.
Results
Participant characteristics
Participant demographics and descriptive values for sleep, rurality, and cognition variables are provided in Table 1. A total of 544 participants completed the study screening questions and initiated the survey62 for the main study41. Of these, 325 participants met inclusion for the full study, with 13% (n=43) of participants providing incomplete data for the Coronavirus Anxiety Scale, and 15% (n=50) of participants having incomplete data for the COVID-19 status measure – both measures were critical for the main study outcomes62. A final subsample of 61 participants (mean age 63.74 years, standard deviation 7.75; 32 rural and 29 non-rural residents) completed the online cognitive measures that were relevant to the present study and were included in analyses. Of these, some participants had incomplete data and were excluded for the following objective cognitive measures: 5% (n=3) for Sternberg working memory task, 12% (n=7) for Wisconsin Card Sorting Test, 7% (n=4) for Stroop controlled trials, and 8% (n=5) for Stroop interference trials.
Rurality differences for each variable were evaluated by independent t-tests for continuous variables and χ2 tests for categorical variables. Overall, there were no differences based on rurality for a majority of variables (p>0.05), except rural residents reported higher household income compared to non-rural residents (Table 1).
Table 1: Study participant demographics†
| Characteristic | Variables | Total (N=61) | Rural area (N=32) | Non-rural area (N=29) |
Group comparison |
|||||||||||||||
|---|---|---|---|---|---|---|---|---|---|---|---|---|---|---|---|---|---|---|---|---|
| M | SD | n | % | Min. | Max. | M | SD | n | % | Min. | Max. | M | SD | n | % | Min. | Max. | p | ||
| Age (years) | 63.74 | 7.75 | 50.00 | 79.00 | 65.47 | 7.77 | 50.00 | 79.00 | 61.83 | 7.40 | 50.00 | 76.00 | 0.14 | |||||||
| Sex | Male | – | – | 32 | 52 | – | – | – | – | 15 | 47 | – | – | – | – | 17 | 59 | – | – | – |
| Female |
– |
– | 29 | 48 | – | – | – | – | 17 | 53 | – | – | – | – | 12 | 41 | – | – | – | |
| Ethnicity | White/European American | – | – | 55 | 90 | – | – | – | – | 31 | 37 | – | – | – | – | 24 | 85 | – | – | – |
| Black/African American |
– |
– | 2 | 3 | – | – | – | – | 1 | 3 | – | – | – | – | 1 | 3 | – | – | – | |
| Asian/Asian American |
– |
– | 2 | 3 | – | – | – | – | – | – | – | – | – | – | 2 | 7 | – | – | – | |
| American Indian/ Alaska Native |
– |
– | 0 | 0 | – | – | – | – | – | – | – | – | – | – | 2 | 7 | – | – | – | |
| Other |
– |
– | 0 | 0 | – | – | – | – | – | – | – | – | – | – | 0 | 0 | – | – | – | |
| Education | Some high school | – | – | 0 | 0 | – | – | – | – | 0 | 0 | – | – | – | – | 0 | 0 | – | – | – |
| Graduated high school |
– |
– | 10 | 16 | – | – | – | – | 5 | 16 | – | – | – | – | 5 | 17 | – | – | – | |
| Some college |
– |
– | 19 | 31 | – | – | – | – | 7 | 22 | – | – | 12 | 41 | – | – | – | |||
| Graduated college |
– |
– | 22 | 36 | – | – | – | – | 11 | 34 | – | – | – | – | 11 | 38 | – | – | – | |
| Graduate or professional school |
– |
– | 10 | 16 | – | – | – | – | 9 | 28 | – | – | – | – | 1 | 3 | – | – | – | |
| Other |
– |
– | 0 | 0 | – | – | – | – | 0 | 0 | – | – | – | – | 0 | 0 | – | – | – | |
| Income (US$)¶ | ≤$19,999 | – | – | 4 | 7 | – | – | – | – | 13 | – | – | – | – | 3 | 10 | – | – | – | |
| $20,000–39,999 |
– |
– | 11 | 18 | – | – | – | – | 4 | 13 | – | – | – | – | 7 | 24 | – | – | – | |
| $40,000–59,999 |
– |
– | 18 | 30 | – | – | – | – | 7 | 28 | – | – | – | – | 11 | 38 | – | – | – | |
| $60,000–79,999 |
– |
– | 13 | 21 | – | – | – | – | 11 | 34 | – | – | 2 | 7 | – | – | – | |||
| $80,000–99,999 |
– |
– | 8 | 13 | – | – | – | – | 5 | 16 | – | – | – | – | 3 | 10 | – | – | – | |
| $100,000 |
– |
– | 7 | 11 | – | – | – | – | 4 | 13 | – | – | – | – | 3 | 10 | – | – | – | |
| No. of medical conditions |
|
1.57 | 1.79 | – | – | 0.00 | 8.00 | 1.62 | 1.76 | – | – | 0.00 | 6.00 | 1.52 | 1.86 | – | – | 0.00 | 8.00 | 0.20 |
| No. of medications |
|
3.30 | 3.22 | – | – | 0.00 | 16.00 | 3.50 | 3.60 | – | – | 0.00 | 16.00 | 3.07 | 2.78 | – | – | 0.00 | 9.00 | 0.24 |
| PSQI subscore | Total | 6.33 | 4.33 | – | – | 1.00 | 18.00 | 6.72 | 4.71 | – | – | 1.00 | 18.00 | 5.90 | 3.89 | – | – | 1.00 | 15.00 | 0.32 |
| Total sleep time (hours) |
6.79 |
1.46 | – | – | 3.00 | 12.00 | 6.61 | 1.79 | – | – | 3.00 | 12.00 | 6.98 | 0.98 | – | – | 5.00 | 9.00 | 0.34 | |
| Sleep efficiency (%) |
88.06 |
14.21 | – | – | 42.86 | 100.00 | 88.31 | 15.40 | – | – | 42.86 | 100.00 | 87.79 | 13.03 | – | – | 55.56 | 100.00 | 0.66 | |
| Objective cognition | Sternberg working memory taska | 0.79 | 0.26 | – | – | 0.33 | 1.00 | 0.80 | 0.26 | – | – | 0.33 | 1.00 | 0.77 | 0.27 | – | – | 0.33 | 1.00 | 0.26 |
| Wisconsin Card Sorting Testb |
13.27 |
9.42 | – | – | 1.56 | 48.31 | 11.43 | 7.45 | – | – | 1.56 | 40.62 | 14.98 | 10.79 | – | – | 2.34 | 48.31 | 0.45 | |
| Stroop color–word test, controlled trialsc |
1447.96 |
531.98 | – | – | 746.71 | 3768.74 | 1474.44 | 608.76 | – | – | 746.71 | 3768.74 | 1420.54 | 448.48 | – | – | 839.78 | 2802.96 | 0.67 | |
| Stroop color–word test, interference scored |
321.00 |
376.58 | – | – | –642.41 | 1842.55 | 372.93 | 460.10 | – | – | –642.41 | 1842.55 | 267.14 | 262.26 | – | – | –607.42 | 654.31 | 0.37 | |
| Posner endogenous orienting score |
40.27 |
35.61 | – | – | –40.61 | 130.87 | 37.51 | 38.61 | – | – | –40.61 | 114.25 | 43.32 | 32.39 | – | – | –9.38 | 130.87 | 0.66 | |
| Posner exogenous orienting score |
38.00 |
34.09 | – | – | –56.39 | 140.71 | 32.85 | 35.07 | – | – | –56.39 | 95.75 | 43.69 | 32.64 | – | – | –12.77 | 140.71 | 0.45 | |
*p<0.05, **p<0.01, ***p<0.001
† Differences between rurality were evaluated by independent t-test for continuous variables and χ2 test for categorical variables at significance level 0.05.
¶ Income categories were collected in USD and converted using the average December 2021 exchange rate (1USD ˜ 1.40AUD).
a NSternberg working memory task=58
b NWisconsin Card Sorting Test=54
c NStroop color–word test, controlled trials=57
d NStroop color–word test, interference scores=55
–, not applicable descriptive statistics for specified variable. M, mean. PSQI, Pittsburgh Sleep Quality Index. SD, standard deviation.
Regression results
Violations of general linear model assumptions were assessed for all regression models. No influential outliers were detected in any regression models. However, some models exhibited slight skewness (on histogram and Q–Q plot) and heteroscedasticity (on bivariate and scale-location plots, and the Breusch–Pagan test in bptest package in R). Despite some regression models exhibiting minor violations in normality and homoscedasticity, general linear models are robust to such violations, and no data transformation or non-parametric methods were applied63.
Rurality moderating self-reported sleep and objective cognition
Table 2 shows full models for each PSQI subscore and objective cognition domain. To facilitate regression results interpretation, moderation regression results are organized by each PSQI subscore to highlight rurality-specific patterns in the associations between self-reported sleep and objective cognition performance.
Table 2: Moderated regression results of association between self-reported sleep and rurality on objective cognitive functioning for working memory, executive functioning, processing speed, and attentional orientating
| PSQI subscore | Sternberg working memory task (n=58) | Wisconsin Card Sorting Test (n=54) | Stroop controlled trials (n=57) | Stroop interference score (n=55) | Posner endogenous orienting score (n=61) | Posner exogenous orienting score (n=61) | |||||||||||||||||||
|---|---|---|---|---|---|---|---|---|---|---|---|---|---|---|---|---|---|---|---|---|---|---|---|---|---|
|
β |
SE | t | p | β | SE | t | p | β | SE | t | p | β | SE | t | p | β | SE | t | p | β | SE | t | p | ||
| Total sleep timea | Full model: R2=0.16, p=0.16 | Full model: R2=0.20, p=0.09 | Full model: R2=0.24, p=0.02 | Full model: R2=0.21, p=0.07 | Full model: R2=0.12, p=0.29 | Full model: R2=0.32, p=0.001 | |||||||||||||||||||
| Rurality |
0.46 |
0.34 | 0.71 | 0.48 | –0.63 | 12.42 | –0.95 | 0.35 | –0.26 | 649.43 | –0.42 | 0.68 | 1.54 | 489.50 | 2.36 | 0.02* | –0.61 | 44.76 | –0.97 | 0.34 | –0.85 | 37.70 | –1.53 | 0.13 | |
| Total sleep time |
0.36 |
0.03 | 1.93 | 0.06 | 0.20 | 1.22 | 1.04 | 0.30 | –0.12 | 64.45 | –0.67 | 0.51 | 0.06 | 49.72 | 0.31 | 0.76 | –0.20 | 4.39 | –1.10 | 0.28 | –0.03 | 3.70 | –0.21 | 0.83 | |
| Rurality x Total sleep time |
–0.26 |
0.05 | –0.41 | 0.69 | 0.80 | 1.81 | 1.19 | 0.24 | 0.14 | 94.91 | 0.22 | 0.83 | –1.46 | 71.20 | –2.24 | 0.03* | 0.55 | 6.46 | 0.88 | 0.38 | 0.90 | 5.44 | 1.63 | 0.11 | |
| Age |
–0.18 |
0.01 | –1.35 | 0.18 | –0.08 | 0.16 | –0.60 | 0.55 | 0.48 | 8.85 | 3.77 | 0.01* | –0.16 | 6.53 | –1.17 | 0.25 | –0.20 | 0.62 | –1.46 | 0.15 | 0.16 | 0.52 | 1.35 | 0.18 | |
| Sex |
0.04 |
0.07 | 0.33 | 0.74 | –0.10 | 2.53 | –0.77 | 0.44 | –0.12 | 135.14 | –0.94 | 0.35 | 0.01 | 99.13 | 0.04 | 0.97 | 0.25 | 9.24 | 1.91 | 0.06 | 0.35 | 7.79 | 3.02 | 0.01* | |
| Education |
0.16 |
0.04 | 1.14 | 0.26 | 0.16 | 1.40 | 1.11 | 0.27 | –0.07 | 71.78 | –0.51 | 0.61 | 0.19 | 54.31 | 1.40 | 0.17 | –0.02 | 5.00 | –0.14 | 0.89 | –0.33 | 4.21 | –2.77 | 0.01* | |
| Sleep efficiencya | Full model: R2=0.16, p=0.18 | Full model: R2=0.13, p=0.36 | Full model: R2=0.26, p=0.02 | Full model: R2=0.13, p=0.31 | Full model: R2=0.13, p=0.28 | Full model: R2=0.35, p<0.01 | |||||||||||||||||||
| Rurality |
1.95 |
0.46 | 2.21 | 0.03* | –0.69 | 17.68 | –0.73 | 0.47 | –1.06 | 877.91 | –1.28 | 0.21 | 0.21 | 771.83 | 0.21 | 0.84 | –0.93 | 62.33 | –1.06 | 0.29 | –1.86 | 51.52 | –2.45 | 0.02* | |
| Sleep efficiency |
0.56 |
0.01 | 2.31 | 0.02* | 0.07 | 0.17 | 0.27 | 0.79 | –0.27 | 8.41 | –1.20 | 0.24 | –0.26 | 7.67 | –0.91 | 0.37 | –0.22 | 0.59 | –0.95 | 0.35 | –0.46 | 0.49 | –2.26 | 0.03* | |
| Rurality x Sleep efficiency |
–1.90 |
0.01 | –2.06 | 0.04* | 0.83 | 0.20 | 0.84 | 0.41 | 1.01 | 10.00 | 1.16 | 0.25 | –0.06 | 8.75 | –0.06 | 0.95 | 0.92 | 0.70 | 1.01 | 0.32 | 1.97 | 0.58 | 2.50 | 0.02* | |
| Age |
–0.14 |
0.01 | –1.03 | 0.31 | –0.03 | 0.17 | –0.22 | 0.82 | 0.47 | 8.86 | 3.66 | 0.01* | –0.18 | 6.84 | –1.31 | 0.20 | –0.21 | 0.62 | –1.54 | 0.13 | 0.17 | 0.51 | 1.42 | 0.16 | |
| Sex |
0.03 |
0.07 | 0.25 | 0.80 | –0.11 | 2.62 | –0.80 | 0.43 | –0.12 | 133.40 | –0.95 | 0.35 | 0.01 | 104.62 | 0.09 | 0.93 | 0.25 | 9.28 | 1.94 | 0.06 | 0.35 | 7.67 | 3.06 | 0.01* | |
| Education |
0.11 |
0.04 | 0.87 | 0.39 | 0.12 | 1.41 | 0.81 | 0.42 | –0.05 | 69.03 | –0.43 | 0.67 | 0.16 | 54.36 | 1.13 | 0.27 | 0.01 | 4.90 | 0.07 | 0.95 | –0.31 | 4.05 | –2.76 | 0.01* | |
| Total | Full model: R2=0.10, p=0.50 | Full model: R2=0.11, p=0.46 | Full model: R2=0.24, p=0.02 | Full model: R2=0.19, p=0.11 | Full model: R2=0.11, p=0.34 | Full model: R2=0.38, p<0.001 | |||||||||||||||||||
| Rurality |
0.27 |
0.13 | 1.06 | 0.29 | 0.22 | 4.95 | 0.85 | 0.40 | 0.01 | 244.74 | –0.02 | 0.99 | –0.28 | 187.65 | –1.13 | 0.26 | 0.05 | 16.90 | 0.23 | 0.82 | 0.51 | 13.49 | 2.58 | 0.01* | |
| Total |
–0.08 |
0.01 | –0.42 | 0.68 | –0.13 | 0.46 | –0.61 | 0.54 | 0.14 | 22.52 | 0.76 | 0.45 | –0.11 | 18.84 | –0.49 | 0.63 | 0.15 | 1.60 | 0.74 | 0.46 | 0.26 | 1.28 | 1.60 | 0.11 | |
| Rurality total |
–0.15 |
0.01 | –0.53 | 0.60 | –0.18 | 0.62 | –0.65 | 0.52 | –0.14 | 31.07 | –0.55 | 0.59 | 0.60 | 24.50 | 2.08 | 0.04* | –0.14 | 2.19 | –0.54 | 0.59 | –0.67 | 1.75 | –3.04 | 0.01* | |
| Age |
–0.18 |
0.00 | –1.29 | 0.20 | –0.11 | 0.18 | –0.78 | 0.44 | 0.50 | 9.01 | 3.79 | 0.01* | –0.13 | 6.85 | –0.95 | 0.35 | –0.19 | 0.63 | –1.36 | 0.18 | 0.16 | 0.51 | 1.41 | 0.16 | |
| Sex |
0.00 |
0.07 | 0.03 | 0.97 | –0.11 | 2.65 | –0.79 | 0.43 | –0.11 | 134.04 | –0.88 | 0.38 | 0.00 | 100.93 | 0.01 | 0.99 | 0.26 | 9.29 | 2.01 | 0.05 | 0.34 | 7.42 | 3.10 | 0.01* | |
| Education |
0.10 |
0.04 | 0.69 | 0.49 | 0.14 | 1.45 | 0.99 | 0.33 | –0.07 | 71.06 | –0.52 | 0.61 | 0.21 | 54.54 | 1.50 | 0.14 | 0.01 | 5.01 | –0.02 | 0.98 | –0.37 | 4.00 | –3.30 | 0.01* | |
*p<0.05, **p<0.01, ***p<0.001
PSQI, Pittsburgh Sleep Quality Index. SE, standard error.
PSQI total sleep time
The PSQI total sleep time–rurality interaction was significantly associated with Stroop interference (p=0.03, 95%CI –302.80– –16.47, η2=0.08). In rural residents, shorter total sleep time was associated with higher (worse) Stroop interference scores (β=–144.40, standard error (SE)=48.25, p=0.004, 95%CI –238.98– –49.82; Fig1), while in non-rural residents the association was not significant (β=15.24, SE=49.72, p=0.76, 95%CI –82.22–112.69). Independent and interactive associations for other cognitive outcomes were non-significant (Table 2).
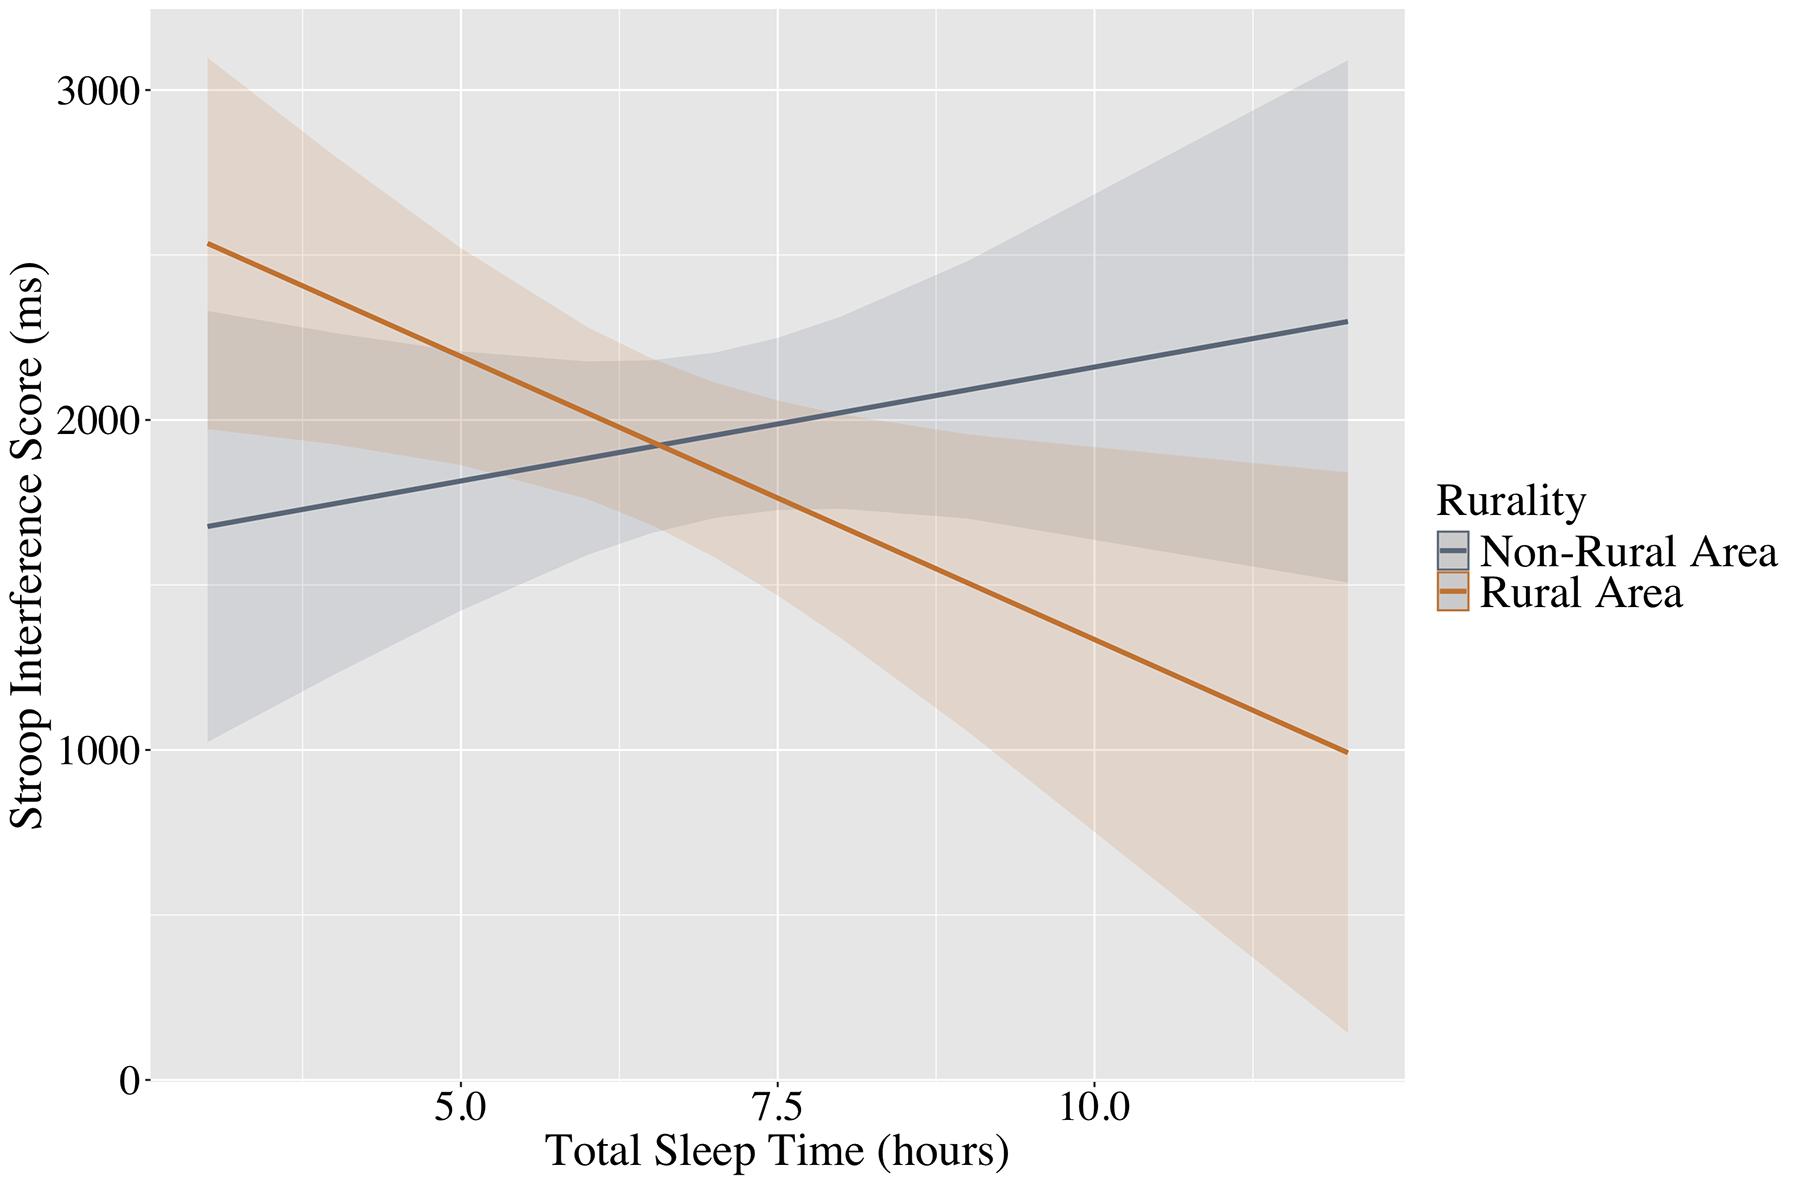 Figure 1: Rurality moderating the association between total sleep time and Stroop interference. (Note: Rurality moderated the association between self-reported total sleep time and Stroop interference scores in mid-to-late-life adults. In rural mid-to-late-life adults, shorter (worse) self-reported total sleep time was associated with worse inhibitory control (higher Stroop interference scores), while there was no association for non-rural mid-to-late-life adults.)
PSQI sleep efficiency
The PSQI sleep efficiency–rurality interaction was significantly associated with Sternberg working memory task scores (p=0.04, 95%CI –0.02– –0.001, η2=0.07) and Posner exogenous scores (p=0.02, 95%CI 0.30–2.62, η2=0.08). In non-rural residents, lower (worse) PSQI sleep efficiency was associated with lower (worse) Sternberg working memory task scores (β=0.01, SE=0.004, p=0.02, 95%CI 0.001–0.02) and higher (worse) Posner exogenous scores (β=–1.10, SE=0.49, p=0.03, 95%CI –2.05– –0.14) (Fig2). In rural residents, PSQI sleep efficiency was not associated with Sternberg working memory task scores (β=–0.001, SE=0.003, p=0.84, 95%CI –0.01–0.01) or Posner exogenous scores (β=0.36, SE=0.32, p=0.27, 95%CI –0.27–0.99). Independent and interactive associations for other cognitive outcomes were non-significant (Table 2).
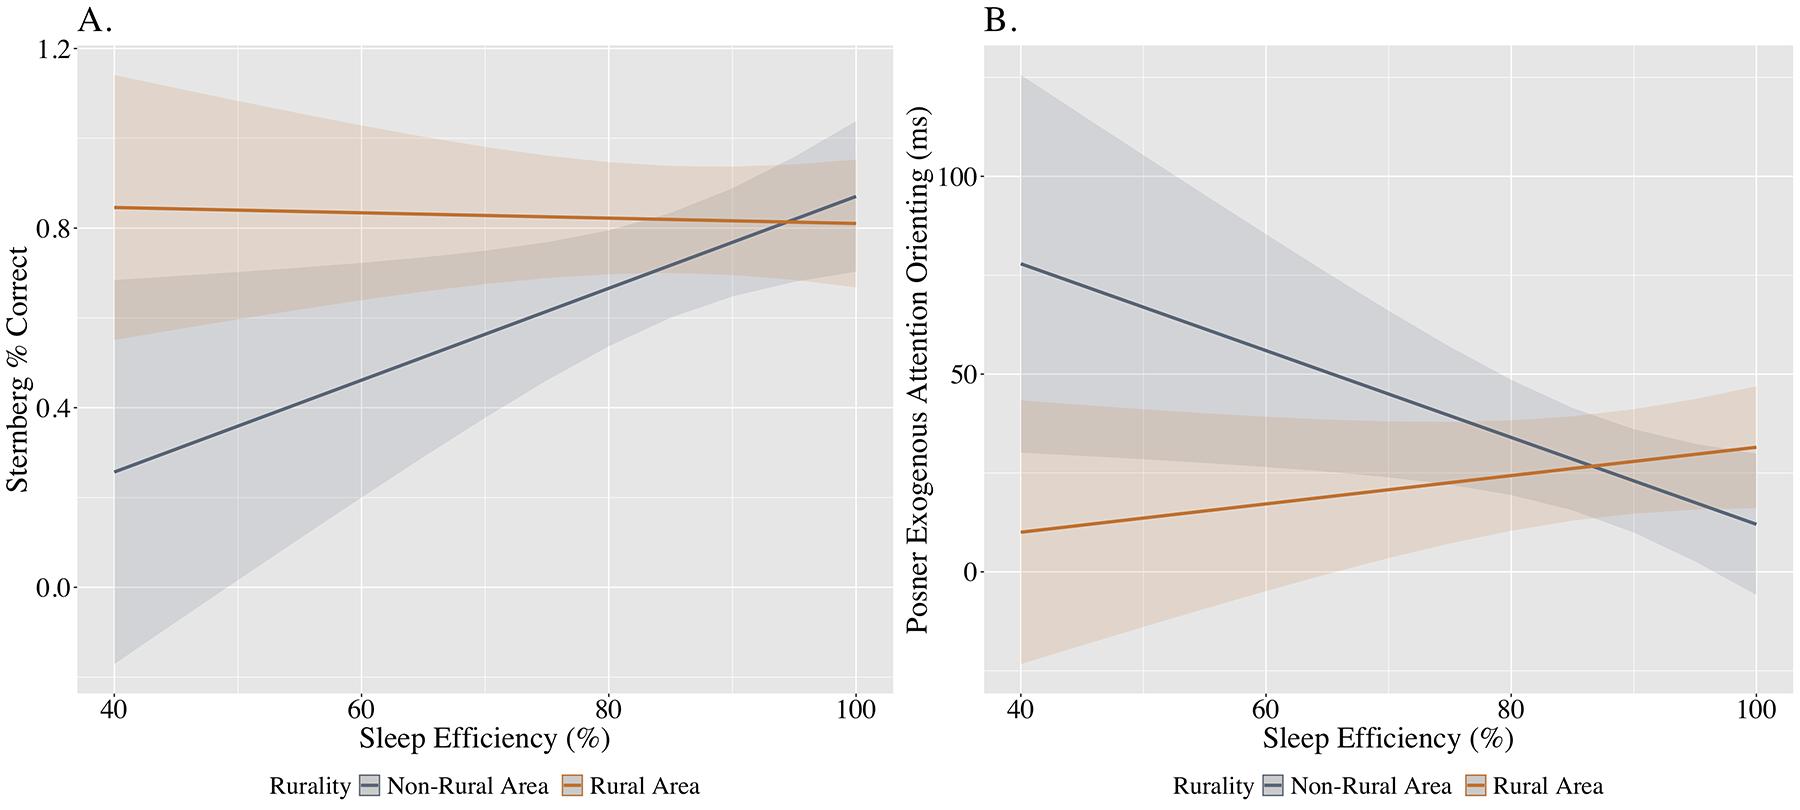 Figure 2: Rurality moderating the association between sleep efficiency, and Sternberg working memory (A) and Posner exogenous attentional orienting (B). (Note: Rurality moderated the association between self-reported sleep efficiency, and Sternberg working memory and Posner exogenous attention orientating scores in mid-to-late-life adults. In non-rural mid-to-late-life adults, lower (worse) self-reported sleep efficiency was associated with worse working memory (lower Sternberg working memory percentage correct scores) and worse exogenous spatial attentional orienting (higher Posner exogenous attention orienting scores), while no such associations were observed for rural mid-to-late-life adults.)
PSQI total
The PSQI total–rurality interaction was significantly associated with Stroop interference scores (p=0.04, 95%CI 1.68–100.20, η2=0.07) and Posner exogenous scores (p=0.004, 95%CI –8.83– –1.81, η2=0.11). In rural residents, higher PSQI total scores (worse global sleep quality) were associated with higher (worse) Stroop interference scores (β=41.79, SE=15.55, p=0.01, 95%CI 11.31–72.26) and lower (ie better) Posner exogenous scores (β=–3.27, SE=1.20, p=0.01, 95%CI –5.61– –0.92) (Fig3). In non-rural residents, PSQI total was not associated with Stroop interference scores (β=–9.15, SE=18.84, p=0.63, 95%CI –46.09–27.78) or Posner exogenous scores (β=–2.06, SE=1.28, p=0.11, 95%CI –0.46–4.57). Independent and interactive associations for other cognitive outcomes were non-significant (Table 2).
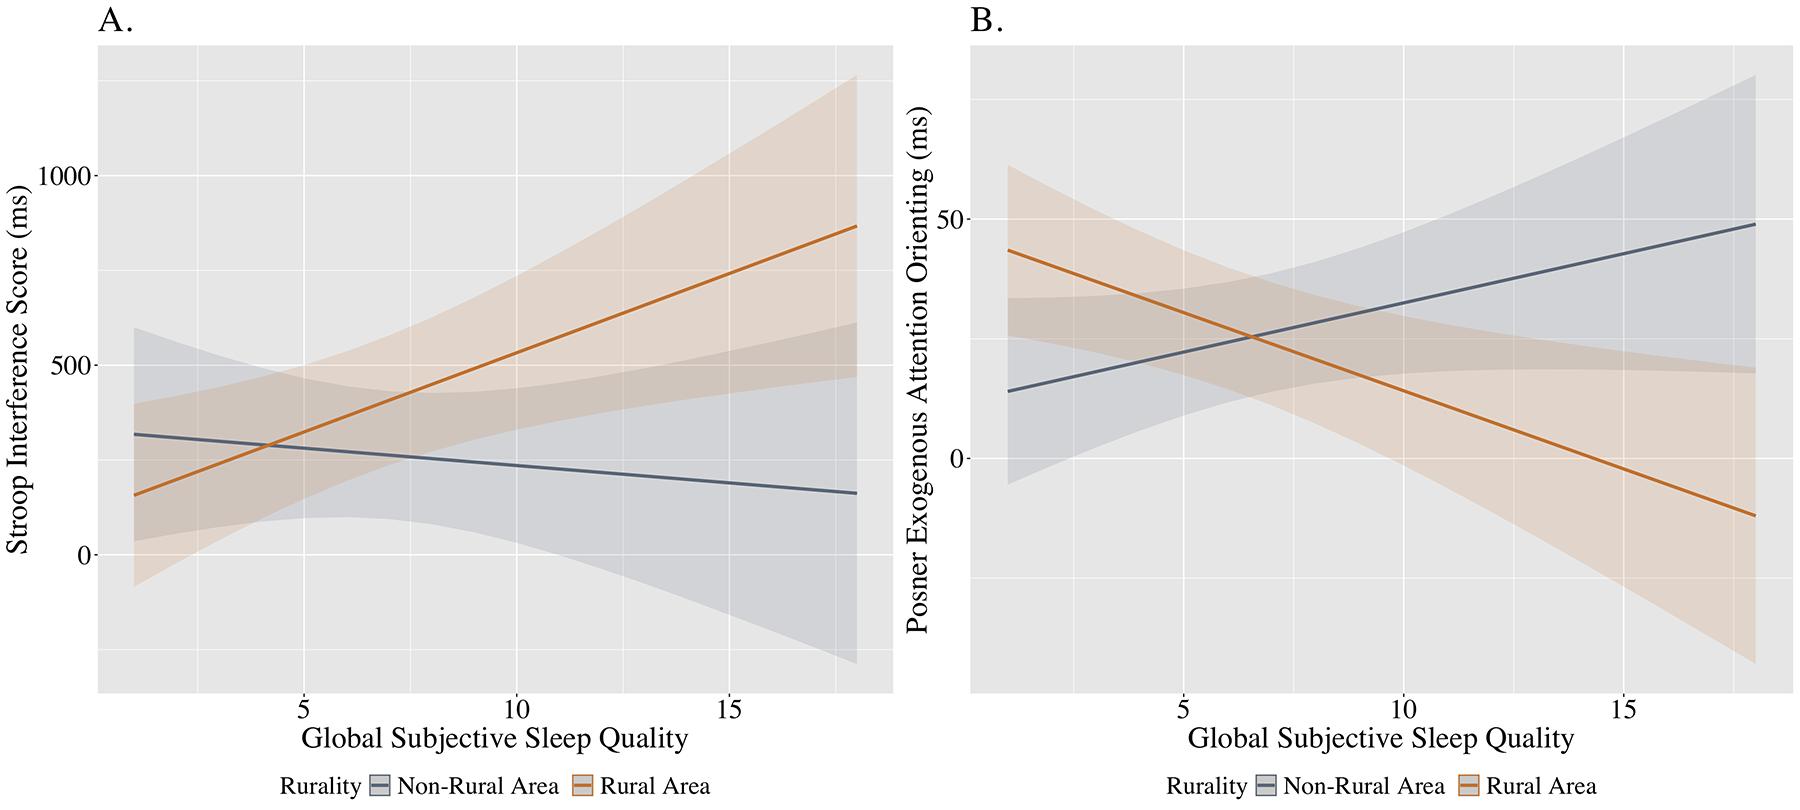 Figure 3: Rurality moderating the association between global subjective sleep quality, and Stroop interference score (A) and Posner exogenous attentional orienting (B). (Note: Rurality moderated the associations between global subjective sleep quality (via Pittsburgh Sleep Quality Index total scores), and Stroop interference and Posner exogenous attentional orienting scores in mid-to-late-life adults. In rural mid-to-late-life adults, worse (higher) global subjective sleep quality was associated with worse inhibitory control (higher Stroop interference scores) and better exogenous spatial attentional orienting (lower Posner exogenous spatial orienting scores). In non-rural mid-to-late-life adults, global subjective sleep quality was not associated with inhibitory control or exogenous spatial attentional orienting.)
Covariates associated with objective cognition outcome variables
Covariates generally showed no significant associations with cognitive domains across all regression models. However, older age was associated with higher (worse) Stroop controlled trials scores in our PSQI total sleep time regression model, and being an older adult women and lower years of education were significantly associated with higher (worse) Posner exogenous orienting scores in our PSQI total sleep time, PSQI sleep efficiency, and PSQI total regression models (Table 2).
Discussion
This preliminary study examined whether rurality moderated associations between self-reported sleep and objective cognition in mid-to-late-life adults. Among rural residents, shorter total sleep time and worse global sleep quality were associated with worse inhibitory control, while worse global sleep quality was associated with better exogenous spatial attentional orienting. Conversely, in non-rural residents, lower sleep efficiency was associated with worse working memory and exogenous spatial attentional orienting. Although the study is cross-sectional in nature, the observed patterns provide potential implications for clinical screening and early identification of sleep-related cognitive dysfunction in aging adults – particularly for rural residents. These patterns of results also offer insight into potential future clinical trajectories by identifying sleep-related risk profiles in specific geographical locations that may warrant closer monitoring or referral for early intervention in routine care.
Our hypothesis that rurality would moderate sleep–cognition associations was partially supported with domain-specific associations. Findings show that, in rural mid-to-late-life adults, self-reported shorter total sleep time and worse sleep quality may contribute to worse inhibitory control, aligning with findings in rural older adults7. We extend these insights by also showing that, in non-rural older adults, worse sleep efficiency may contribute to worse working memory and exogenous spatial attentional orienting. These findings may differ from prior findings in non-rural older adults, which linked worse global sleep quality, shorter total sleep time and worse sleep efficiency to worse global cognitive function over time40. However, methodological differences – including longitudinal study design, global versus specific cognitive domain examined, and older age range (65–80 years40) – likely contributed to these inconsistencies.
The overall pattern of findings suggests that, in rural mid-to-late-life adults, sleep duration and general perception of sleep quality may negatively impact higher order cognition (eg inhibitory control), whereas worse overall perceptions of sleep quality may be linked to better lower order attention functioning. In non-rural aging adults, worse overall sleep fragmentation may negatively impact cognition broadly. It is possible that psychosocial factors – such as greater social isolation64 and limited cognitive engagement65 – may exacerbate sleep-related inhibitory control in aging rural residents. Loneliness in older adults, linked with shorter sleep duration66, is associated with reduced attentional resources67 and impaired inhibitory control68, a pattern supported by our findings. Loneliness in rural aging adults may contribute to associations between shorter sleep duration and functionality of specific brain regions for inhibitory control (ie prefrontal cortex hypoactivation69 and greater frontotemporal cortical thinning70,71). Indirect effects between loneliness, sleep quality and pre-sleep arousal72 may contribute to hyperarousal – associated with insomnia73 and shorter sleep duration74. Hyperarousal may be a cognitive compensatory mechanism75 for lower order cognitive domains (eg spatial attention) but not higher order cognitive domains (eg inhibition76) For instance, in middle-aged adults with insomnia and shorter sleep durations (<6 hours) there were associations with greater deficits in executive function, working memory and attention-switching tasks, but lower order cognitive domain tasks were not impacted74, as reflected in our findings. In rural aging adults, geographical isolation may further perpetuate hyperarousal states, exacerbating associations between worse overall sleep perceptions and worse inhibitory control.
Additionally, rural residents may experience boredom77, which has been linked with poor cognitive reserve78 and sleep quality79. Consistent with our results, insufficient environmental stimulation and failure to attend to activities may lead to boredom in aging rural adults80, potentially facilitating bedtime procrastination and poor sleep quality79, as well as diminished activation of executive control networks81, which are critical for inhibitory control. Alternatively, boredom-related poor sleep quality79 may lead to increased arousal to engage in a stimulating task82, improving spatial attention abilities, consistent with our findings.
Conversely, non-rural aging adults may experience greater urban-related environmental auditory noises, which is associated with poor sleep health, cognitive functioning, and somatic/mental health83. Additionally, lower sleep efficiency is associated with worse working memory and executive functioning (ie attentional control84), along with reduced superior frontal cortex volume and greater anterior atrophy – regions critical for attentional control85. Although rurality-related sleep differences were non-significant (Table 1), it is possible that urban-related environmental disruptions (eg traffic, sirens) may exacerbate the negative impact of worse sleep efficiency on cognition more broadly. Further, examining rurality-specific psychosocial and environmental factors with age-related neurophysiology and their interplay on sleep–cognition dynamics may inform the neurobiological of aging and sleep, and potentially tailored interventions for sleep complaints.
Considerations for future clinical work
Preliminary findings suggest that clinicians can monitor geographically specific sleep behaviors in aging adults – such as shorter total sleep time and global sleep quality in rural residents, and poor sleep efficiency in non-rural residents – to identify individuals who may benefit from additional screening and monitoring for potential cognitive decline and early intervention prior to onset. Additionally, given limited medical care access in rural areas86, telehealth/digital sleep interventions – such as brief behavioral treatment for insomnia and cognitive behavioral therapy for insomnia, which improves sleep quality87 and may extend benefits to total sleep time88 – represent accessible options that clinicians can incorporate into their practice or send for referral to specialized behavioral sleep providers to support cognitive health in aging populations. Monitoring and targeting rurality-specific factors (eg psychosocial stress and environmental city noises) that potentially underly sleep fragmentation in mid-to-late-life adults may guide targeted strategies to reduce rurality-specific cognitive dysfunction.
In addition to clinical considerations, educational efforts for both rural residents and healthcare providers may enhance awareness of sleep’s role in cognitive aging. Broader policy considerations, including improvements for rurality-specific factors – such as promoting quieter and safer neighborhood conditions – may also help support sleep health in rural communities.
Limitations and future directions
Although this preliminary study has several limitations to be considered, the nature of the study and the present pattern of results was intended to inform researchers and clinicians about early patterns of specific rurality-specific patterns in the association between sleep and cognitive functioning in aging adults. These findings provide foundational, hypothesis-generating insights that can guide future larger, longitudinal clinical investigations to clarify these rurality-moderated relationships. First, although the survey was completed anonymously online, recommended optimizing data quality and reliability procedures (ie one response per IP address, pre-screening questions89) were followed. Second, our cross-sectional design precludes temporal inference. Prospective studies are needed to elucidate the temporal precedence and potential underlying mechanism the rurality–sleep–cognition relationship. Third, sleep was self-reported using the PSQI46, and is validated for clinically screening for poor sleep health90. However, rurality-related patterns may differ with objective sleep measures (eg actigraphy, polysomnography), warranting further investigation. Fourth, residential duration and engagement with agricultural/environmental factors were not assessed, potentially contributing to underlying mechanisms of the present results. Fifth, data was collected in the northern hemisphere summer of 2020, and COVID-19 related disruptions (eg non-typical sleep behavior, relocation) may have impacted the findings. Future investigations are encouraged to investigate this relationship post-pandemic. Sixth, rurality was operationalized dichotomously (via RUCA codes) with mutually exclusive geospatial categories. Rurality continuous or quasi-continuous measures assessing the degree of rurality impacting the interplay of sleep and cognition are encouraged in future investigations. Such approaches may better detect rural–urban differences and determine nuanced effects of geographical factors of cognitive functioning, sleep, and psychosocial factors in mid-to-late-life adults. Seventh, our modest sample size limits statistical power. Larger replication studies with recommended observation-to-predictor ratios61 are needed. Finally, although having comparable rural (54%) and non-rural (46%) ratios, the sample lacked racial/ethnic diversity (90% White) and was limited to US residents. Additionally, rural communities within the US are culturally heterogenous, and variations in local norms, beliefs, and expectations surrounding sleep91,92 may shape how sleep is perceived and managed. Broader cultural characteristics that are common in rural settings – such as lower engagement with formal healthcare services and greater reliance on informal community or neighbor networks – have been well documented93, and these patterns may influence how rural adults perceive sleep difficulties and their likelihood of seeking guidance or treatment. These culture factors were not assessed in the present study and may further constrain generalizability of these findings across diverse rural contexts. Future studies should examine these associations in a more diverse sample and internationally representative samples to enhance generalizability across cultures and geographic contexts.
Conclusion
Thus far, this is the first known study to examine rurality-specific associations between self-reported sleep and objective cognition in mid-to-late-life adults. In rural residents, overall pattern of results suggests that worse total sleep time and global sleep quality may negatively impact inhibitory control, while worse sleep quality may positively impact attentional orienting. For non-rural residents, worse sleep efficiency may broadly impact cognition. Prospective studies exploring rural (eg limited health care and social support) and non-rural (eg traffic, noise) characteristics contributing to the patterns of sleep–cognition associations are warranted. Further research may inform geographically sleep-specific interventions that may mitigate the risk of cognitive decline in aging populations.
Acknowledgements
We acknowledge Jacob Wilhelm for assisting with the preparation of the IRB application for the present study.
Funding
No funding was received for the work in this article.
Conflicts of interest
The authors report no potential conflict of interest.
AI disclosure statement
No generative AI or AI-assisted artificial tools were used in the conduct of this research or the preparation of this manuscript.
Data availability
Study data, analytical methods, and study materials can be made available upon request to the corresponding author. This study was not preregistered.