Short Communication

Continued development of the Rural Active Living Perceived Environmental Support Scale (RALPESS): preliminary evidence for validity among American Indians

AUTHORS

name here
Rachael D. Nolan
1 PhD, MPH, CPH, Post-Doctoral Research Fellow in Prevention Science * ORCID logo

name here
Jon Agley
2 PhD, MPH, Assistant Scientist and Deputy Director

name here
M Renée Umstattd Meyer
3 PhD, MCHES, FAAHB, Associate Professor

name here
Paul G Spicer
4 PhD, Professor and Director of the Center for Applied Social Research

name here
Jeffrey S Hallam
5 PhD, Professor and Associate Dean for Research and Graduate Studies

CORRESPONDENCE

*Dr Rachael D. Nolan

AFFILIATIONS

1 Kent State University, College of Public Health 800 Hilltop Drive, Moulton Hall – 2nd floor, Ste. #241 Kent, OH 44242, United States

2 Institute for Research on Addictive Behavior, School of Public Health, Bloomington, 501 N. Morton St., Suite 110, Bloomington, IN 47404, United States

3 Department of Public Health, Baylor University, One Bear Place, #97343, Waco, TX 76798, United States

4 Center for Applied Social Research, College of Arts & Sciences, The University of Oklahoma, 5 Partners Place, 201 Stephenson Parkway - Suite 4100, Norman, OK 73072, United States

5 College of Public Health, Kent State University, 800 Hilltop Drive, Moulton Hall - Suite 131, Kent, OH 44242, United States

PUBLISHED

26 June 2019 Volume 19 Issue 2

HISTORY

RECEIVED: 14 November 2018

REVISED: 24 March 2019

ACCEPTED: 21 April 2019

CITATION

Nolan RD, Agley J, Umstattd Meyer M, Spicer PG, Hallam JS.  Continued development of the Rural Active Living Perceived Environmental Support Scale (RALPESS): preliminary evidence for validity among American Indians. Rural and Remote Health 2019; 19: 5200. https://doi.org/10.22605/RRH5200

AUTHOR CONTRIBUTIONSgo to url

This work is licensed under a Creative Commons Attribution 4.0 International Licence

go to urlPubMed

go to urlCited by

Development of the Rural Active Living Perceived Environmental Support Scale (RALPESS)

download icon download PDF


abstract:

Introduction: Much of the US adult population does not engage in regular physical activity or meet the recommended guidelines for exercise. Moreover, many rural Americans disproportionately experience lower health status and life expectancy attributed to obesity, poor diet, and lack of physical activity. Evidence supports the role of perceived physical and social-environmental factors as potential influencers of exercise. However, measurement of these influencers, particularly within diverse, rural populations, has been sparse. A substantial number of American Indians live in federally defined rural areas, and many rural American Indians are at elevated risk for being overweight and obese due to physical inactivity. Therefore, this study established the validity and reliability of the Rural Active Living Perceived Environmental Support Scale (RALPESS) within a predominantly rural American Indian sample.
Methods: In this cross-sectional pilot study, the 33-item RALPESS was administered to 130 adults, across 19 rural localities within Oklahoma, who were recruited from community events hosted by local partners of the tribal Head Start program. Confirmatory factor analysis was used to examine the hypothesized factor structure of the RALPESS.
Results: Confirmatory factor analysis showed an adequate fit between the hypothesized model and the data. Analyses produced an acceptable χ2 goodness of fit index with two degrees of freedom. The comparative fit index and parsimony goodness of fit index were acceptable. The root mean square error of approximation and its 90% confidence interval were also acceptable. Overall, the RALPESS showed suitable internal consistency for the full measure and its subscales, resulting in Cronbach’s alpha between 0.82 and 0.96.
Conclusions: This pilot study produced confirmatory evidence that the RALPESS is likely a valid and reliable tool for use with rural American Indian populations. Continued validation of this scale, particularly in international rural communities, will support further investigation into this important public health issue, and may further efforts towards the development and promotion of effective programming to increase exercise engagement.

Keywords:

American Indians, confirmatory factor analysis, exercise, inactivity, perceived environment, physical activity, public health, USA.

full article:

Introduction

Despite well-known health benefits of physical activity (PA), ongoing concern exists in the USA that the adult population does not engage in regular PA or meet the recommended guidelines for aerobic and muscle-strengthening exercise1-3. A recent national call to action to improve PA cited environmental factors as a key strategic focus4, and researchers have observed significant associations between PA and community environments (eg access to facilities) for decades5. As this area of inquiry has matured, scholars from diverse fields have produced an amalgam of intersecting PA research on objective and subjective measures of the built environment6-8, linking PA to perceived environmental supports9-12. However, these objective (eg distance to a facility) and subjective (eg quality of sidewalk maintenance) measures do not always correlate, nor are they necessarily associated with the same PA outcomes13,14. Moreover, the locality (eg urban versus rural) of PA appears to attenuate the strength of such associations15. This latter discovery is particularly meaningful because people living in rural areas tend to be less physically active than those living in urban areas16,17. As part of ongoing research in this area, Umstattd et al developed the Rural Active Living Perceived Environmental Support Scale (RALPESS), for which continued investigation, particularly among diverse populations, is warranted18.

Because a substantial portion (20.5%) of a diverse group of people known as the American Indians live in federally defined rural areas19, authors of the present study identified American Indians as an important population with which to continue work using the RALPESS. Rural American Indians (RAIs) are shown to be disproportionately affected by cardiovascular disease, diabetes, and stroke and are at elevated risk for being overweight and obese due to physical inactivity20,21. Despite the significant health disparities faced by this population, studies have identified a paucity of research on PA in RAI populations22. To address this gap, the present study measures the construct validity of the RALPESS in a predominant RAI sample, while simultaneously addressing three important aims: (1) heeds the call for continued work with the RALPESS in diverse populations, (2) generates additional research on PA among RAI, and (3) adds to the body of literature on environmental supports for rural PA.

Methods

The RALPESS instrument

The RALPESS instrument was originally created by Umstattd et al to measure perceived environmental supports for PA using four-point Likert-type scales (‘strongly disagree’ to ‘strongly agree’)18. In their development study, following expert panel review and field testing, the RALPESS was subjected to a principal component analysis (PCA) with varimax rotation to identify latent factors18. The PCA supported a seven-factor solution consisting of indoor areas (IAs; items 1–6), outdoor areas (OAs; items 7–9), town center connectivity (TCC; items 10–15), town center resources (TCRs; items 16–18), school grounds (SCHs; items 19–21), church facilities (CHUs; items 22–28), and areas around the home or neighborhood (AAHs; items 29–33). Each factor was explained by at least three items, and together the seven factors accounted for 71.62% of the variance, with good subscale consistency18. The final 33-item instrument developed by that research team, along with factor definitions and item descriptions, is presented in Table 1.

Table 1:  Confirmatory Structure of the seven-factor (33-item) Rural Active Living Perceived Environmental Support Scale with definitions, item-loadings and internal consistency

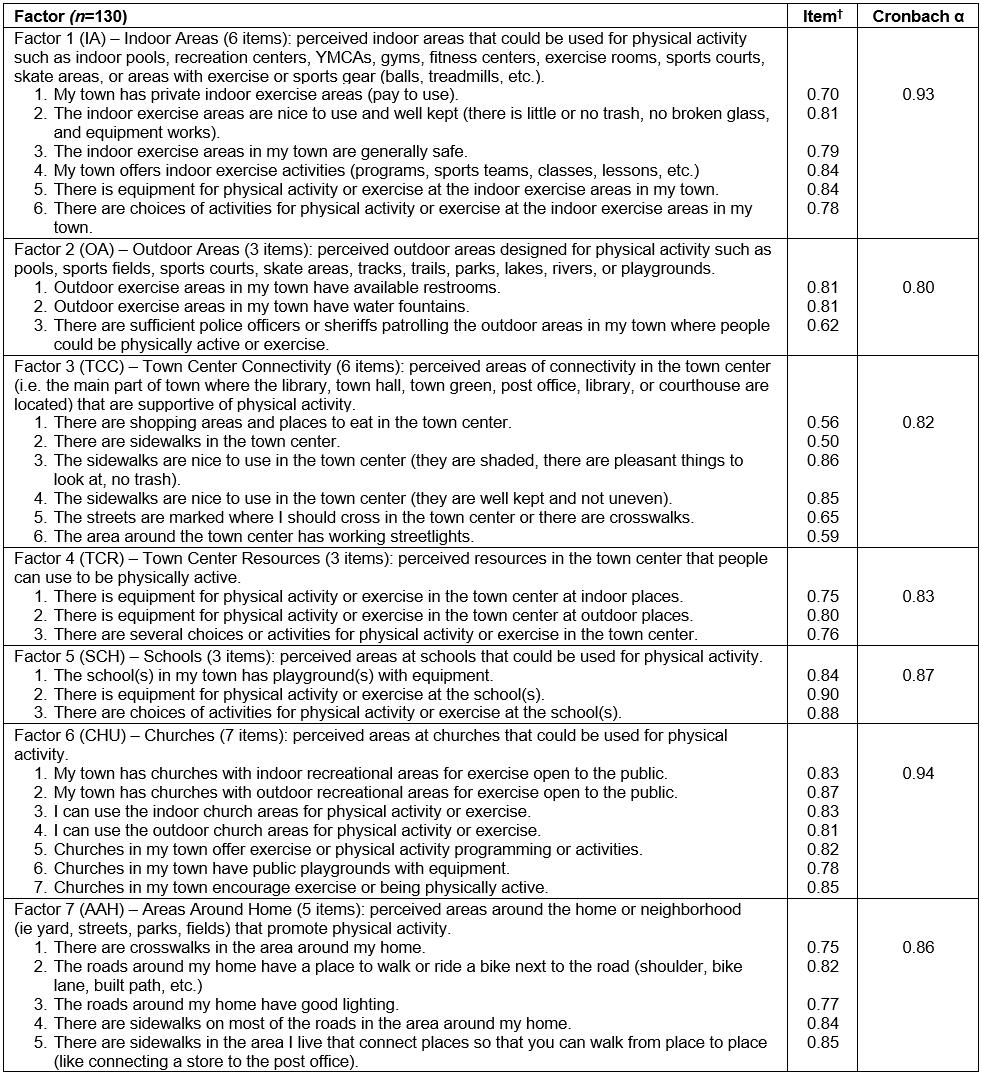
Sampling and recruitment

For the present study, participants were conveniently recruited from local events hosted by partners of a tribal Head Start program in rural Oklahoma during the months of March to May of 2013. The final sample consisted of adults (n=130) aged 18 years or more who consented to take part in the study and who completed the RALPESS instrument in paper and pencil format. The self-reported biometrics of weight and height were used to calculate participants’ body mass index (BMI) during the single administration period. No incentives were provided for study participation.

Data analysis

To test for construct validity, unidimensionality, and reliability of the 33-item hypothesized factor structure23, data collected were entered in the Statistical Package for the Social Sciences v22 (IBM; http://www.spss.com) for confirmatory factor analysis using the AMOS module. Descriptive statistics were assessed for problematic patterns by checking for out-of-range values, univariate outliers, and reviewing likelihood of means and standard deviations. No participant had greater than 5% missing data.

Ethics approval

The University of Mississippi Institutional Review Board (protocol no. 07-101) approved all recruitment and data collection prior to the study.

Results

Sample

The sample, described in greater detail in Table 2, predominantly was American Indian (89.1%) and consisted of more females (82.4%) than males (17.6%); most (86.4%) males were American Indian. The average number of total days of regular exercise, a measure of PA engagement for at least 30 minutes per day over 1 week, was 3.22 (standard deviation (SD)=2.78). The average weight for females was 80.90 kg (SD=21.25) with a BMI of 29.86 (SD=7.25), which bordered criteria set for overweight (BMI=25.0–29.9) and obese (BMI≥30.0) based on national guidelines24. Using the same criteria24, the average weight for males was 102.79 kg (SD=31.82) with a BMI of 31.21 (SD=8.38), which meant most men in the sample were obese.

Table 2:  Sample characteristics

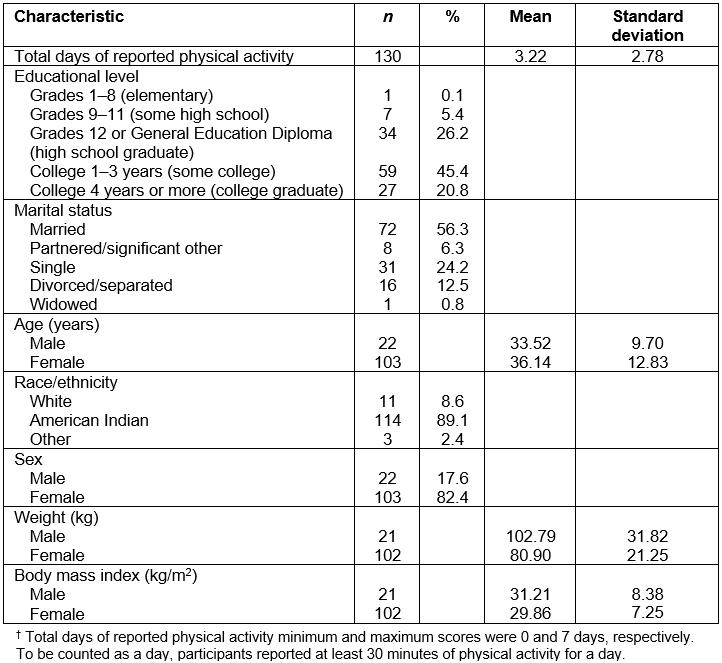
Statistical analysis

Analytic criteria:  Using the established seven-factor solution18, the RALPESS was subjected to confirmatory factor analysis, where latent variables were allowed to correlate, and all items were modeled to load on their corresponding factors (Fig1). Regression weights, expected parameters of change, and modification indices received examination for areas of model misfit. Model appropriateness was tested against standards established by Stevens25 and Byrne26. Item-to-factor loadings were examined at ≥0.40 specified at the p<0.01 level that resulted in a reasonable, non-significant χ2 goodness of fit index (CMIN=2.00–5.00; p<0.05). To assess the differences between corresponding elements of the data to the hypothesized model, a root mean square error of approximation was evaluated between 0.00 and 0.10, along with its 90% confidence interval. The comparative fit index received examination at greater than or equal to 0.95. To assess the least number of variables accounting for the most amount of variance between the data and the hypothesized model, the parsimony goodness of fit index was assessed at greater than or equal to 0.10. Cronbach’s alpha was checked against a minimum of α>0.70 to indicate a reliable measure27. Along with this established criteria, model complexity and theoretical considerations were accounted for based on the suggestion of Marsh et al28, who cautioned against strict cut-offs for fit indices.

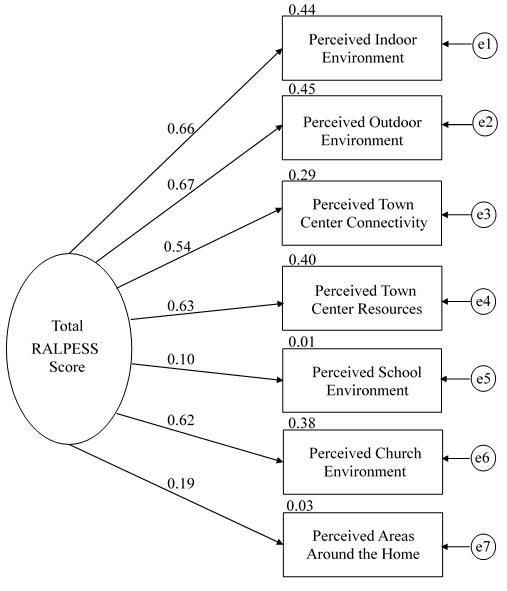
Figure 1:  Final model of the Rural Active Living Perceived Environmental Support Scale.

Final model and fit:  Results from the confirmatory factor analysis showed an adequate fit between the hypothesized model and the data. Items in the final model were kept if the item-to-factor loadings were ≥0.40 (Table 1). Analyses produced a non-significant (p<0.05), acceptable χ2 goodness of fit index (3.56) with two degrees of freedom (CMIN/df=1.78). The comparative fit index (0.96) and parsimony goodness of fit index (0.46) were acceptable. The root mean square error of approximation (0.08) and its 90% confidence interval (0.02–0.13) were also acceptable. These overall findings, combined with a logical interpretation of the item content as compared to the underlying factors, led to the final determination that the hypothesized model fit the data well and no alternative model was tested. Internal consistencies for the RALPESS are presented in Table 1. Cronbach’s alpha for the full measure (α=0.96) and the seven subscales of IA (α=0.93), OA (α=0.80), TCC (α=0.82), TCR (α=0.83), SCH (α=0.87), CHU (α=0.94), and AAH (α=0.86) were acceptable and exceeded the 0.70 criterion.

Discussion

This pilot study produced confirmatory evidence that the RALPESS can be used to measure perceived environmental supports of PA within RAI populations located in the USA. Analyses supported the construct validity of the measure as presented by a 33-item, seven-factor solution. These findings are significant because of not only the relative lack of research on PA in RAI populations, but also a difference in perceived environmental supports for PA in rural areas when compared to urban areas. Continued validation of this scale, particularly in diverse international communities, will support further investigation into this important public health issue of rural physical inactivity. It is also suggested that future researchers assess the predictive and nomological validity, as well as concurrent use of the RALPESS with the Rural Active Living Assessment tools29, to inform geographically appropriate interventions towards the promotion of PA worldwide. Finally, the authors recommend consideration of the degree to which financial barriers may affect access to some resources, which may be ‘identified’ as being within the environment, but that are – in reality – difficult to utilize.

Limitations 

Despite the valuable contributions of this research, the generalizability of findings should be considered given some limitations. Convenience sampling methods were used to recruit participants specific to the research aims, for which physical limitations are noted to be disproportionally high among RAI populations30, and likely impacted PA engagement. Most participants in the sample were overweight/obese adult females who had at least a high school/General Education Diploma education and were employed. Although adequate for this study31, some researchers prefer larger samples for confirmatory factor analysis and note that arranging like items together on instrumentation could lead to the assertion that the construct validity of the measure is part and parcel of the assessment structure. Lastly, self-report data and BMI increasingly have been shown to be less effective32 and accurate metrics of health.

references:

1 Centers for Disease Control and Prevention. State indicator report on physical activity. Atlanta, GA: Centers for Disease Control and Prevention, 2014.
2 Centers for Disease Control and Prevention. Physical activity basis: important health benefits. 2015. Available: web link (Accessed 7 July 2015).
3 US Department of Health and Human Services. Physical activity and health: a report of the Surgeon General. Atlanta, GA: US Department of Health and Human Services, 1996.
4 Tuso P. Strategies to increase physical activity. The Permanente Journal 2015; 19(4): 84-88. DOI link, PMid:26517440
5 Dishman RK, Sallis JF, Orenstein DR. The determinants of physical activity and exercise. Public Health Reports 2016; 100(2): 158-171.
6 Day K, Boarnet M, Alfonzo M, Forsyth A. The Irvine-Minnesota Inventory to measure built environments: development. American Journal of Preventive Medicine 2006; 30(2): 144-152. DOI link, PMid:16459213
7 Wendel-Vos W, Droomers M, Kremers S, Brug J, van Lenthe F. Potential environmental determinants of physical activity in adults: a systematic review. Obesity Reviews 2007; 8: 425-440. DOI link, PMid:17716300
8 Wang Y, Chau CK, Ng WY, Leung TM. A review on the effects of physical built environment attributes on enhancing walking and cycling activity levels within residential neighborhoods. Cities 2016; 5: 1-15. DOI link
9 Ball K, Bauman A, Leslie E, Owen N. Perceived environmental aesthetics and convenience and company are associated with walking for exercise among Australian adults. Preventive Medicine 2001; 33: 434-440. DOI link, PMid:11676585
10 De Silva Weliange SH, Fernando D, Gunatilake J. Development and validation of a tool to assess the physical and social environment associated with physical activity among adults in Sri Lanka. BMC Public Health 2014; 14: 423. DOI link, PMid:24884525
11 Brownson RC, Baker EA, Housemann RA, Brennan LK, Bacak SJ. Environmental and policy determinants of physical activity in the United States. American Journal of Public Health 2001; 91(12): 1995-2002. DOI link, PMid:11726382
12 Burton NW, Turrell G, Oldenburg B, Sallis JF. The relative contributions of psychological, social, and environmental variables to explain participation in walking, moderate-, and vigorous-intensity leisure-time physical activity. Journal of Physical Activity and Health 2005; 2: 181-196. DOI link
13 Kirtland KA, Porter DE, Addy CL, Neet MJ, Williams JE, Sharpe PA, et al. Environmental measures of physical activity supports: perception versus reality. American Journal of Preventive Medicine 2003; 24(4): 323-330. DOI link
14 Roosa MW, White RMB, Zeiders KH, Yun-Tien J. An examination of the role of perceptions in neighborhood research. Journal of Community Psychology 2009; 37(3): 327-341. DOI link, PMid:20161028
15 Doescher MP, Lee C, Berke EM, Adachi-Mejia AM, Lee C-k, Stewart O, et al. The built environment and utilitarian walking in small U.S. towns. Preventive Medicine 2014; 69: 80-86. DOI link, PMid:25199732
16 Trivedi T, Liu J, Probst J, Merchant A, Jhones S, Martin AB. Obesity and obesity-related behaviors among rural and urban adults in the USA. Rural and Remote Health 2015; 15(4): 3267. Available: web link (Accessed 17 August 2018).
17 Meit M, Knudson A, Gilbert T, Tzy-Chyi Yu A, Tanenbaum, E, Ormson, E, et al. The 2014 update of the Rural-Urban Chartbook. Bethesda, MD: Rural Health Reform Policy Research Center, 2014.
18 Umstattd MR, Baller SL, Hennessy E, Hartley D, Economos CD, Hyatt RR, et al. Development of the Rural Active Living Perceived Environmental Support Scale (RALPESS). Journal of Physical Activity and Health 2012; 9: 724-730. DOI link, PMid:21946157
19 Rural Health Information Hub. Rural tribal health 2016. Available: web link (Accessed 2 November 2018).
20 Cobb N, Espey D, King J. Health behaviors and risk factors among American Indians and Alaskan Natives, 2000-2010. American Journal of Public Health 2014; 104: S481-S489. DOI link, PMid:24754662
21 U.S. Department of Health and Human Services. Indian Health Service fact sheet. Atlanta, GA: U.S. Department of Health and Human Services, 2012.
22 Coble JD, Rhodes RE. Physical activity and Native Americans: a review. American Journal of Preventive Medicine 2006; 31(1): 36-46. DOI link, PMid:16777541
23 O’Leary-Kelly SW, Vorkurka RJ. The empirical assessment of construct validity. Journal of Operations Management 1998; 16(4): 387-405. DOI link
24 National Heart, Lung and Blood Institute. Healthy weight tools. 2018. Available: web link (Accessed 2 November 2018).
25 Stevens J. Confirmatory and exploratory factor analysis: applied multivariate statistics for the social sciences. 4th Edn. Mahwah, NJ: Lawrence Erlbaum Associates, 2002.
26 Byrne B. Structural equation modeling with AMOS: basic concepts, applications, and programming. Mahwah, NJ: Lawrence Erlbaum Associates, 2001.
27 Cronbach L. Designing evaluations of educational and social programs. San Francisco, CA: Jossey-Bass, 1982.
28 March H, Hau K, Wen Z. In search of golden rules: comment on hypothesis testing, approaches to setting cutoff values for fit indexes, and dangers in overgeneralizing Hu and Bentler’s (1999) findings. Structural Equation Modeling 2004; 11: 320-341. DOI link
29 Yousefian A, Hennessey E, Umstattd MR, Economos CD, Hallam JS, Hyatt RR et al. Development of the Rural Active Living Assessment [RALA] tools: measuring rural environments. Preventive Medicine 2010; 50: S86-S92. DOI link, PMid:19818362
30 Native News. Major survey on American Indians with disabilities released. 2018. Available: web link (Accessed 9 November 2018).
31 Mundfromo DJ, Shaw DG, Tian LK. Minimum sample size recommendations for conducting factor analysis. International Journal of Testing 2005; 5(2): 159-168. DOI link
32 Connor Gorber S, Tremblay M, Moher D, Gorber B. A comparison of direct vs. self‐report measures for assessing height, weight and body mass index: a systematic review. Obesity Reviews 2007; 8(4): 307-326. DOI link, PMid:17578381

You might also be interested in:

2020 - Elders suffering recurrent injurious falls: causal analysis from a rural tribal community in the eastern part of India

2018 - Scope of Practice of Family Medicine Graduates Who Completed Rural vs Urban Program

2007 - Prevalence of female infertility and its socio-economic factors in Tribal communities of Central India

This PDF has been produced for your convenience. Always refer to the live site https://www.rrh.org.au/journal/article/5200 for the Version of Record.