Introduction
Among various socioeconomic factors that can determine population health, income is one important determinant of health1. Higher income, particularly in developing countries, often leads to a healthier environment2. In the early 1990s Wilkinson described a new hypothesis to explain the relationship between relative income and health. In a series of published papers and books, he suggested that among developed countries the distribution of income in a geopolitical aggregate and not the absolute wealth is a more reliable determinant of health3-6. The relative income hypothesis triggered a large amount of debate and numerous studies with conflicting interpretations and non-conclusive results. International studies and research on unequal societies such as the USA and the UK are mostly supportive of the hypothesis, whereas results of studies within countries with smaller income imbalances such as Canada7, Denmark8,9, and Finland10 are either negative or non-conclusive. It seems that the relative income hypothesis might only operate in large geographic regions11.
In Canada the hypothesis has been tested within individual provinces12-14, but not across the country. The purpose of the current study was therefore to examine the 'relative income' hypothesis across all Canadian health regions. Ecological research was conducted to test the potential relationship between a measure of income inequality and a measure of population health within Canada.
Methods
Study design
An ecological analysis of the Canadian Community Health Survey (CCHS), Cycle 3.1, 2005 data was conducted. Income distribution is only measurable at an aggregate level4,15; hence, an ecological design was the preferred choice for the current study. All variables were measured at the ecological level.
Data and measures
Data source: The data source for this study was the CCHS, Cycle 3.116, a national level survey of approximately 130 000 persons conducted in 2004. The target population included household residents aged 12 years and older in all Canadian provinces and territories. Exclusions were the populations on Indian Reserves, those residing in institutions, members of the Canadian Forces who reside in bases, and those in some remote areas.
The survey had a multistage stratified cluster design in which the dwelling was the final sampling unit. The CCHS Cycle 3.1 employed rigorous strategies in weighting and obtaining a high response rate (79%). All variables required for this research except the rural-urban status variable were obtained from the Public Use Microdata File of the CCHS Cycle 3.1. This file was accessed through the Social Science Data Centre at Queen's University, Kingston, Ontario. Rural/urban status data were obtained from CCHS Cycle 3.1 Master File Data which was accessed via the Statistics Canada Research Data Centre at Queen's University.
Dependent variable: The dependent variable in this research was a measure of health status of populations. A subjective indicator of health (self-rated health) was used to ascertain the health status of the population. In the CCHS Cycle 3.1 all participants rated their current status of their health as one of the following categories: excellent, very good, good, fair, or poor. To provide an estimate of general health status of each health region, the percentage of people who rated their current state of health as good or higher was calculated.
Independent variable: A range measure17 of income inequality (the ratio of two extreme categories of income) was employed. The ratio of the percentage of people whose income was less than $15,000 to those who made more than $80,000 during the year before interview (2004) was calculated for each Canadian health region.
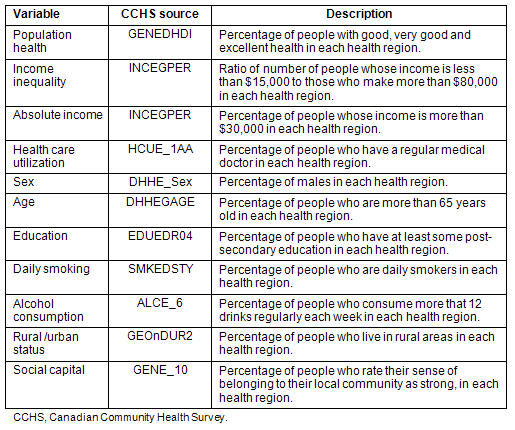
Covariates: Various covariates required consideration with regard to potential confounding effects on the relationship of interest as they might be related to both outcome (perceived health) and exposure (income inequality). The most important independent variable, absolute wealth of each aggregate, was estimated by calculating the percentage of people who had a personal income of more than $30,000 in the year preceding the survey (2004) in each Canadian health region. Variables considered a priori as potential confounders and controlled for in the analyses as follows (Table 1): (i) health care utilization; (ii) sex; (iii) age; (iv) education; (v) smoking rate; (vi) alcohol consumption; (vii) rural/urban status; and (viii) social capital.
Table 1: Description of variables and source
Analysis
Most of the analyses in this investigation were conducted using 'Queen's WebInterface for SPSS' (QWIFS; Social Science Data Centre, Queen's University) as an interface for SPSS v15.0 (SPSS; Chicago, IL, USA). In addition, SAS v9.1 (SAS Institute; Cary, NC, USA) was used for further data manipulation and analyses.
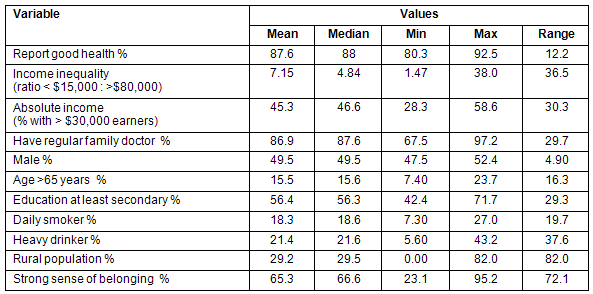
The range, extreme values and measures of central tendency of each ecological variable were estimated (Table 2). Median values of variables were used to establish a threshold to divide the observations into two categories. These categories were utilized in sub-group analyses and tests of interaction. Pearson's correlation was used to describe bivariate relationships between continuous variables. Simple and multiple linear regression analyses were used to examine relationships between the variables of interest while controlling for other factors, and to understand how much variation in Canadian population health status can be explained by the independent variable.
Table 2: Mean, minimum, median, and maximum values of variables used in the analysis
Ethics
The research used data from secondary sources already in the public domain. Before starting data collection and analyses ethics approval was obtained. To avoid any potential identification of study participants, the Statistics Canada rules relating to privacy and confidentiality were followed at all times during the research.
Results
Preliminary descriptive analyses revealed that all variables except the income inequality variable were normally distributed across health regions (Table 2). Results of correlation analyses suggested that the dependent variable (health status in populations) had a statistically significant positive correlation with the absolute income and education variables (Table 3). The correlation between the primary exposure variable (income inequality) and the outcome variable became non-significant after controlling for a measure of absolute income (Pearson correlation coefficients were changed from -0.43 [p<0.0001] to +0.09 [p0.3816]). Simple linear regression analysis showed that the relative income inequality measure appears to explain 18% of the variance in the population health, but after adding the measure of absolute income to the model, income inequality was not a significant predictor of variations in the population health. The measure of absolute income was able to explain 30% of the variability of the measure of population health and its independent contribution stayed significant after adding the measure of income inequality to the model (Table 4, model 2).
Table 3: Correlation matrix of variables
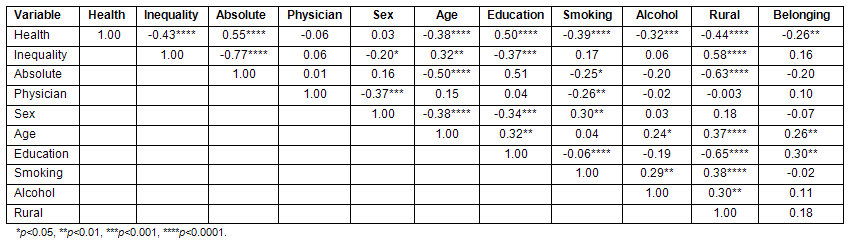
Table 4: Linear regression analyses results according to model
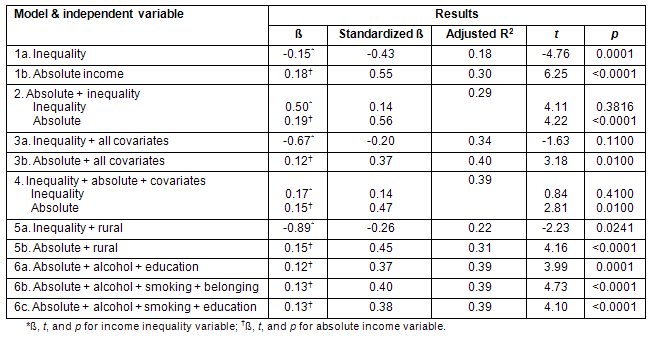
Various strategies in the REG procedure in SAS version 9.1 were employed to identify important covariates and to build the most parsimonious model18. The final model (model 6a, table 4) showed that apart from absolute income, the two variables education and alcohol consumption have positive and negative statistically significant effects on population health status, respectively. No second-order interaction terms containing the variables in the final model were significant. Based on tests of collinearity, multicollinearity between variables did not appear to be an issue in the regression analyses. Furthermore, outlier detection and influential diagnostics analyses were conducted. Health regions with extreme values did not have any significant influence on the results of regression analyses.
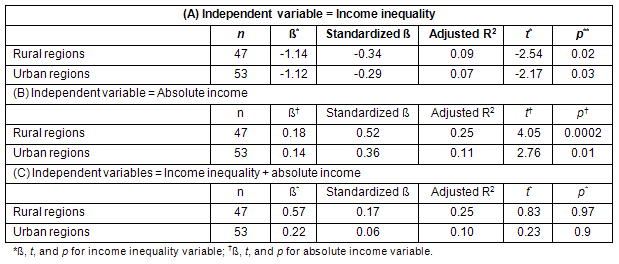
In both rural and urban geographic regions the measure of income inequality became non-significant after adding absolute income to the model (Table 5, part C). In both regions, absolute income versus relative income, was a better predictor of health disparities in the population (in rural regions the adjusted R2=0.25 vs 0.09, and in urban regions 0.11 vs 0.07; Table 5). In urban regions the optimal model was similar to the model for Canada as a whole but in rural regions variable smoking compared with variable alcohol was better able to explain the variations in the outcome.
Table 5: Results of linear regression analysis of association between income inequality, absolute income and health within different levels of rural/urban status
Discussion
The national study systematically tested competing absolute income and relative income hypotheses among Canadian health regions. Previous Canadian research was mostly either non-conclusive19 or non-supportive of the relative income hypothesis20,21. The research demonstrated that compared with the relative income hypothesis, the absolute income hypothesis was better able to explain variations in the measure of population health in Canada. In the regression analyses, when the measure of absolute income was considered as the main independent variable, the adjusted R2 was higher compared with the models in which relative income was the main independent variable (0.30 in model 1b vs 0.18 in model 1a, Table 4). The measure of absolute income remained a significant and independent contributor in the final model after controlling for potential confounders. This finding was similar to other studies on small geographic regions22, one thesis on Ontario public health units12, and research on countries with lower degrees of income inequality7,10,11.
The findings may be interpreted in two ways. First, the units of analysis (Canadian health regions) were relatively small geographically and in terms of population size. In smaller areas there is a lower likelihood of social heterogeneity, which is the main reason for the effect of income inequality on health23,24. Second, there is also some debate that the relationship between income inequality and health may depend on the level of inequality and be apparent only above a certain income inequality threshold25. Canada, compared with some other western countries, namely the USA and UK, has lower levels of income inequality (the Gini coefficient for Canada=0.32, for USA=0.45, and for UK=0.34)26. The lower level of income inequality in Canada may be another reason for lack of support of the relative income hypothesis in this research.
Based on the optimal model (model 6a, Table 4), the existence of a higher percentage of people with post-secondary education is associated with better population health. It is not surprising that better educated people are also healthier, but it was concluded that more educated people in each region also affected the health of the whole community. Also, the model showed that the higher proportion of heavy drinkers in a region was a negative contributor to population health.
Rural/urban geographic status of a region was neither a confounder nor an effect-modifier factor for the relationship between absolute income and population health in the study. Final models were constructed separately for each of rural and urban regions. In both regions, absolute income and education had positive effects on the measure of population health. In rural regions in contrast to urban regions, an ecological measure of smoking had a significant negative effect on population health while alcohol consumption had no effect.
The main methodological concern in this study was the choice of the income inequality measure. Not accessible, however, were individual data required for calculating disproportionality measures such as the Gini coefficient and a 'range measure' was used based on an existing approach to assessment of income inequality17. To assess the sensitivity of the range measure, three other range measures which varied the ratio between the percentages of high and low income persons were also calculated. All analyses were repeated with these three new measures and no significant changes in results were observed. The measure of income inequality appeared to be a reliable measure of relative income inequality.
The limitations of this research warrant comment. First, the cross-sectional study design did not permit a full exploration of temporality. Measures of absolute income and population health were measured at the same time and it was not possible to establish if higher wealth in a region actually contributes to better population health. Second, since all variables were measured at an ecological level, the conclusions cannot be extended to individuals. The study showed that among Canadian health regions, more prosperous regions have higher percentages of people with good self-rated health, but one should not conclude that richer individuals inside a region are necessarily healthier. The database (CCHS Cycle 3.1, 2005), although employing a reliable sampling methodology, did not cover the entire Canadian population. The exclusion of on-reserve Aboriginal people, who are among the poorest and least healthy of the Canadian population, is a problem in generalizing the results of this research.
Longitudinal analyses are required to establish whether changes in absolute income will have an effect on population health. More research is needed to refute or approve the study findings. To establish a more comprehensive picture of relationships between income and health among Canadian populations, inclusion of on reserve Aboriginal people in future studies is warranted.
Conclusion
In summary, this study supported the absolute income hypothesis in Canada. The study results showed that higher aggregate absolute wealth and higher percentages of people with post-secondary education are associated with better population health. Higher rates of alcohol consumption were also correlated with lower population health status in urban regions and smoking was correlated with lower population health status in rural regions. This study was performed in a single country, Canada, which has unique economic and health characteristics. If the current study findings are borne out consistently in other settings, there are a number of implications for population health policies and programs.
Overall, this research shows that policies on improving income, education, and lowering alcohol consumption (in urban areas) and smoking rates (in rural regions) may improve the health of Canadian urban and rural populations. In both rural and urban areas, increasing absolute income by economic development and providing employment will improve the health of the population. However, in rural Canada, the policy implications of the absolute income hypothesis is more complex. Historically, incomes are generally measured in terms of cash income. People living in rural areas often have in-kind assets but fewer cash assets, for this reason income in rural areas appears lower but the availability of economic resources may be at the same level as that of urban residents. For example, farmers can grow their own food, therefore they spend less money for groceries but this does not necessarily mean that compared with urban residents they have worse nutrition. Second, the older population is over-represented in rural areas and their health status is less likely to be affected by changes in income status in their final years. In this respect, increasing the incomes of older people by improving government transfers (eg Canada Old Age Security) and pensions (eg Canada and Quebec Pension Plans), might improve their quality of life and, indirectly, their psycho-social wellbeing but not necessarily their physical health.
Further studies are warranted that take into account the differences between relative income and absolute income status, Canada's poorest and least healthy population groups, and longitudinal frameworks in contrast to cross-sectional frameworks.
Acknowledgements
Author Afshin Vafaei was funded by a Public Health and the Agricultural Rural Ecosystem (PHARE) Graduate Training Program scholarship, Canadian Institute of Health Research (CIHR).
References
1. Sorlie PD, Backlund E, Keller JB. US mortality by economic, demographic, and social characteristics: the national longitudinal mortality study. American Journal of Public Health 1995; 85: 949956.
2. Rodgers GB. Income inequality as determinants of mortality: an international cross-section analysis. Population Studies 1979; 33: 343-351.
3. Wilkinson RG. Income distribution and life expectancy. BMJ 1992; 304: 65-168.
4. Wilkinson RG. The epidemiological transition: from material scarcity to social disadvantage? Daedalus 1994; 123(4): 61-77.
5. Wilkinson RG. Unhealthy societies, the affliction of inequality. New York: New Press, 1999.
6. Wilkinson RG. The impact of inequality: how to make sick societies healthier, 1st edn. New York: Routledge, 2005.
7. Laporte A, Ferguson BS. Income inequality and mortality: time series evidence form Canada. Health Policy 2003; 66(1): 107-117.
8. Osler M, Prescott E, Gronbaek M, Christensen U, Due P, Engholm G. Income inequality, individual income, and mortality in Danish adults. BMJ 2002; 324(7328): 13-16.
9. Osler M, Christensen U, Due P, Lund R, Andersen I, Diderichsen F et al. Income inequality and ischaemic heart disease in Danish men and women. International Journal of Epidemiology 2003; 32(3): 375-380.
10. Blomgren J, Martikainen P, Makela P, Valkonen, T. The effects of regional characteristics on alcohol related mortality. Social Science & Medicine 2004; 58(12): 2523-2535.
11. Wilkinson RG, Pickett KE. Income inequality and population health: a review and explanation of the evidence. Social Science & Medicine 2006; 62: 1768-1784.
12. Phillips SP. Income, income inequality, and health. Queen's University, Canada, 2002. (Thesis)
13. Veenstra G. Social capital and health (plus wealth, income inequality and regional health governance). Social Science & Medicine 2002a; 54(6): 849-868.
14. Veenstra, G. Income inequality and health. Coastal communities in British Columbia, Canada. Canadian Journal of Public Health 2002b; 93(5): 374-379.
15. Szklo M, Nieto FJ. Epidemiology, beyond the basics. Sudbury, MA: Jones and Bartlett, 2007.
16. Statistics Canada Canadian Community Health Survey (CCHS) Cycle 3.1 Public Use Micro Data File (PUMF) user guide. Ottawa, ON: Statistics Canada, 2005.
17. Harper S, Lynch J. Measuring health inequalities. In: JM Oakes, JS Kaufman (Eds). Methods in social epidemiology: research design and methods. San Francisco, CA: Jossey-Bass, 2006.
18. Freund RJ, Little RC. SAS System for Regression. Cary, NC: SAS Institute, 2000.
19. Sanmartin C, Ross NA, Tremblay S, Wolfson JR, Lynch J. Labour market income inequality and mortality in North American metropolitan areas. Journal of Epidemiology and Community Health 2003; 57(10): 792-797.
20. Hou F, Myles J. Neighborhood inequality, neighborhood affluence and population health. Social Science & Medicine 2005; 60: 1557-1569.
21. McLeod CB, Lavis JN, Mustard CA, Stoddart GL. Income inequality, household income, and health status in Canada. American Journal of Public Health 2003; 93(8): 1287-1293.
22. Franzini L, Ribble J, Spears W. The effects of income inequality and income level on mortality vary by population size in Texas counties. Journal of health and Social Behavior 2001; 42(4): 73-387.
23. Wilkinson RG Commentary, Income, Inequality and social cohesion. American journal of Public Health 1997a; 87: 1504-1506.
24. Wilkinson RG. Income Inequality Summarises the Health Burden of Individual Deprivation. British Medical Journal 1997b; 314: 1727-1728.
25. Asada Y. Health inequality: morality and measurement. Toronto, ON: University of Toronto Press, 2007.
26. Central Intelligence Agency. The world fact book. Washington, NY: CIA, 2008.
Original Research
Relationships between income inequality and health: a study on rural and urban regions of Canada
AUTHORS

Afshin Vafaei1 MD, Postgraduate student *
Mark W Rosenberg2 PhD, Professor
William Pickett3 PhD, Professor
CORRESPONDENCE
* Afshin Vafaei
AFFILIATIONS
1, 3 Department of Community Health and Epidemiology, Queen's University, Kingston, Canada
2 Department of Geography, Queen's University, Kingston, Canada
PUBLISHED
24 May 2010 Volume 10 Issue 2
HISTORY
RECEIVED: 15 January 2010
REVISED: 26 March 2010
ACCEPTED: 24 May 2010
CITATION
Vafaei A, Rosenberg MW, Pickett W. Relationships between income inequality and health: a study on rural and urban regions of Canada. Rural and Remote Health 2010; 10: 1430. https://doi.org/10.22605/RRH1430
AUTHOR CONTRIBUTIONS
© Afshin Vafaei, Mark W Rosenberg, William Pickett 2010 A licence to publish this material has been given to James Cook University, jcu.edu.au
Abstract
Introduction:
Many studies have demonstrated that health is a function of relative and not absolute income within populations. Canadian studies are not conclusive; most indicate that there is no relationship between income inequality and health within Canada. There is a need for further investigation into the validity of the 'relative income' hypothesis in the Canadian population. The primary objective of this research was to test the 'relative income' hypothesis across Canadian health regions. The second objective was to extend the hypothesis to consider rural versus urban populations.Methods: This research involved ecological analyses. The source of the data was the Canadian Community Health Survey, Cycle 3.1. The units of analysis were Canadian health regions. Health of a region was estimated as the percentage of people who rated their health as good or excellent. The primary exposure variable was the ratio of people whose personal income was less than $15,000 relative to those reporting more than $80,000 in the year preceding the survey. This ratio provided a measure of the distribution of income. The main covariates were ecological measures of socio-demographic variables, social capital, substance use behaviours (smoking and alcohol consumption), rural/urban status of the region, and absolute income in the region. Correlation analyses and multiple linear regressions were performed to ascertain the relationship between income inequality and population health, adjusting for important covariates.
Results: The measure of income inequality alone appeared to explain 18% of the variability in the measure of population health. However, after adding the measure of absolute income to the model, although 29% of the variability was explained, the independent contribution of the inequality measure became non-significant. Linear regression models suggested that the absolute income variable alone could explain 30% of the variance in the health status of populations. Other variables with a statistically significant contribution to the final model were education and alcohol consumption. The effect of rural/urban geographic status on the relationship of interest was similar to other covariates. This variable did not change the individual relationship between income inequality or absolute income and the measure of population health status. In both rural and urban regions, absolute income and education had positive effects on population health. In urban regions alcohol consumption was a significant negative contributor to population health status; whereas, in rural regions, smoking status had a significant negative effect on population health status.
Conclusion: Across Canadian health regions, health status in populations was a function of absolute income but not relative income. Regions with higher levels of education had better levels of self-rated health. A larger percentage of heavy drinkers was also correlated with lower population health status. Findings were consistently observed in rural and urban populations. The study findings have implications for public health, economic, and social policies.
Keywords: Canada, income inequality, relative income hypothesis, population health, self-rated health.
You might also be interested in:
2022 - Managing hospitalized patients with bacterial infections: the price-to-pay upon site of infection