Studies of mortality in Aboriginal populations across Canada are often restricted by the lack of Aboriginal identifiers on national death records1-3. While some studies have utilised a record-linkage approach, this is often not possible for the entire country or for recent data4-6. Therefore, some researchers have adopted a geographic approach and examined mortality and morbidity in areas that have a high percent of Aboriginal identity residents7-13. These studies have uniformly reported elevated rates of mortality and morbidity for residents in areas with a high percent of Aboriginal identity residents compared with other areas.
Many First Nations children live in communities that face diverse social and health challenges compared with their non-Aboriginal peers, including some of the most socio-economically challenging situations in Canada14,15. These differences can be seen in broad indicators of the social determinants of health16. The First Nations population of Canada is significantly younger than the non-Aboriginal population, with a median age of 25 years compared with 40 years for the non-Aboriginal population. Compared with non-Aboriginal children, First Nations children were more likely to live with a lone parent, grandparent, or other relative17. From the 2006 Census, First Nations people were five-times more likely to live in crowded homes than non-Aboriginal people (15% vs 3%), although this has decreased by 5% since 1996. In addition, in 2006 approximately half the Aboriginal children in urban areas and one-quarter in rural areas were from low-income families18.
Mortality from intentional and unintentional injuries as well as injury hospitalization have been shown to be particularly prevalent for children and youth in areas with high percentage of Aboriginal or First Nations identity residents9,10,19. To date, numerous studies have examined infant mortality and perinatal deaths, demonstrating higher rates for First Nations children and youth, and for areas with a high percent of First Nations identity residents, with mortality rates decreasing over time2,14,20,21. However, a national picture of mortality rates by cause, sex, and age group does not exist for Canadian children and youth living in high-percentage First Nations identity areas.
This article examines child and youth (aged 1 to 19 years) mortality in areas where a high percentage of the population identified as First Nations as compared with low-percentage Aboriginal identity areas. The focus of this study was to develop measures specific to high-percentage First Nations areas, with those calculated for Inuit presented elsewhere13. The results of this analysis demonstrate not only persistent disparities in mortality for children and youth living in high-percentage First Nations identity areas, but also show this to be a valuable methodology for calculating area-based measures of population health11.
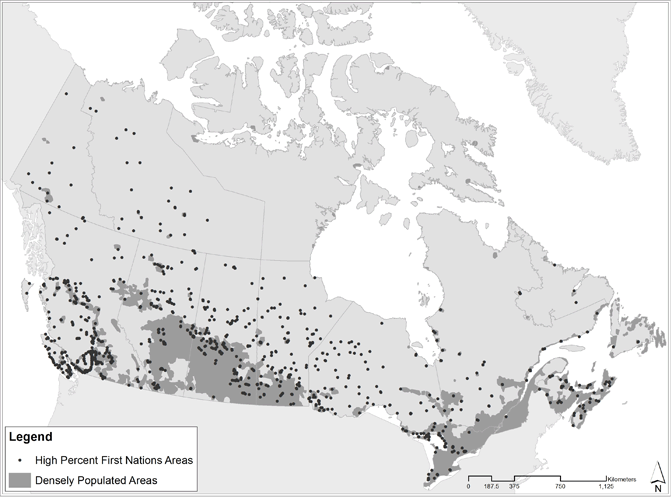
A threshold table approach was used to classify geographic areas where a high percentage of residents were of First Nations identity8,11. This methodology examined the distribution of all Aboriginal identity peoples in Canada aggregated by small geographic areas, classified as high or low-percent Aboriginal by a specific threshold value. Dissemination Areas (DA) were selected as the geographic unit of aggregation. DAs are the smallest standard geographic unit that provide continuous coverage of the country and have a population of between 400 and 700 people22. To calculate threshold tables, DAs were grouped in ascending order by the number of Aboriginal-identity people indicated on the 2006 Census. The top one-third of the distribution (33.3%) was coded as high-percentage Aboriginal identity areas and classified by the predominant Aboriginal identity group: First Nations, Métis, or Inuit. Taken together, 97% of the population residing in these 1233 DAs identified as Aboriginal. Only the 1133 DAs classified as high-percentage First Nations identity areas were used for analysis in the present study, with 90% of the combined population identifying as First Nations, representing 45% of the total First Nations identity population enumerated by the 2006 census. DAs meeting the threshold criteria in 2006 were used to analyse mortality in 2001 and 2006 so as to maintain a consistent geography.

Figure 1: High-percentage First Nations identity areas, 2006.
Mortality data were extracted from the 2000-2002 and 2005-2007 vital statistics database at Statistics Canada23, which contains vital events for all deaths occurring to usual residents of Canada and some deaths occurring to Canadians outside the country. For each death, information on the decedent's age, sex, residential postal code, and primary cause of death was available. Cause of death was coded to the International Classification of Diseases, vol 10 (ICD-10) and classified according to selected causes in the Global Burden of Disease framework24. Deaths occurring to those from age 1 through 19 years were grouped for the 3 year period surrounding the 2001 and 2006 census years.
Residential postal codes for deaths were linked to 2006 DAs via the Postal Code Conversion File25. Linkage of death records to place of residence was improved via additional manual resolution of postal codes on death records for the years studied. Manual resolution was performed on death records where the postal code was missing by reviewing digital scans of death certificates to obtain missing values. After manual resolution, 99% of registered deaths had a valid postal code for all years combined. As many postal codes in rural areas span multiple DA boundaries, a population-weighted algorithm was employed using PCCF+ v5K software (Statistics Canada; http://www5.statcan.gc.ca/bsolc/olc-cel/olc-cel?lang=eng&catno=82F0086X) to assign death records to the most likely DA26. The 2006 DA boundaries were used for both periods analysed in order to maintain consistent geographic areas between periods.
The denominator for mortality rates was derived from the 2001 and 2006 censuses, with a correspondence file used to link 2001 DA identifiers with those in 2006. The denominator was the sum of the interpolated populations (aged 1-19) for each of the 3 year periods of mortality data (2000-2002 and 2005-2007), based on the mid-point of the census year. Because of incompletely enumerated Indian Reserves, a small number of DAs lacked detailed age and sex data needed to provide a complete denominator12. To retain these DAs in the sample, age and sex were estimated from the total population counts or population estimates of incompletely enumerated Indian Reserves and the population age-sex structure of the broader First Nations population11,27. As these DAs were all on Indian Reserves, they were considered to be high-percentage First Nations identity areas.
Several contextual socio-economic variables were calculated for high-percentage First Nations identity areas and for low-percentage Aboriginal identity areas: the percent of the population aged 1-19 who were of Aboriginal identity, percent of the population in weak or non-Metropolitan Influenced Zone, percent of the population in the lowest and highest income quintiles, the mean household income per person in the household, percent of the population aged 15 years and over without a high school diploma and those with a university degree, percent of the population aged 15 and over who were unemployed, and the percent of the population living in dwellings in need of major repair. These measures were calculated from the 2006 census using census microdata from Statistics Canada28.
Age-standardised mortality per 100 000 persons was calculated separately for males and females and for both sexes combined using the adjusted Chiang method29. Mortality was age-standardised to the 2001 population age structure of all Aboriginal identity persons. This standardisation method allows for more relevant interpretation of results for the Aboriginal population given the different population age-structure of this population27.
All analysis was conducted using Science Analysis Software (SAS) v9.2 (http://www.sas.com).
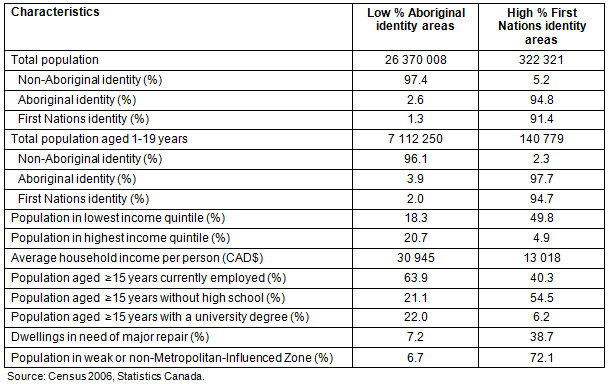
There were several significant socioeconomic and demographic differences between high-percentage First Nations identity areas and low-percentage Aboriginal identity areas. The population age-structure varied significantly between areas, with 27% of the population in low-percentage Aboriginal identity areas aged 1-19 years, compared with 43.7% in high-percentage First Nations identity areas, 94.7% of whom were of First Nations identity. The majority of the population in high-percentage First Nations identity areas (72%) lived in rural areas (weak or non-Metropolitan influenced zones). The percentage of population in either the lowest or highest income quintile varied considerably, reflected also in the difference between average household income per person. In low-percentage Aboriginal identity areas, 21.1% of the population was without a secondary certificate compared with 54.5% in high-percentage First Nations identity areas. There was also a large difference in the percentage of dwellings in need of major repair, with 7.2% of people in low-percentage Aboriginal identity areas living in dwellings in need of major repair compared with 38.7% in high-percentage First Nations identity areas.
Table 1: Demographic and socio-economic measures for high-percentage First Nations
identity areas and low-percentage Aboriginal identity areas, Canada, 2006

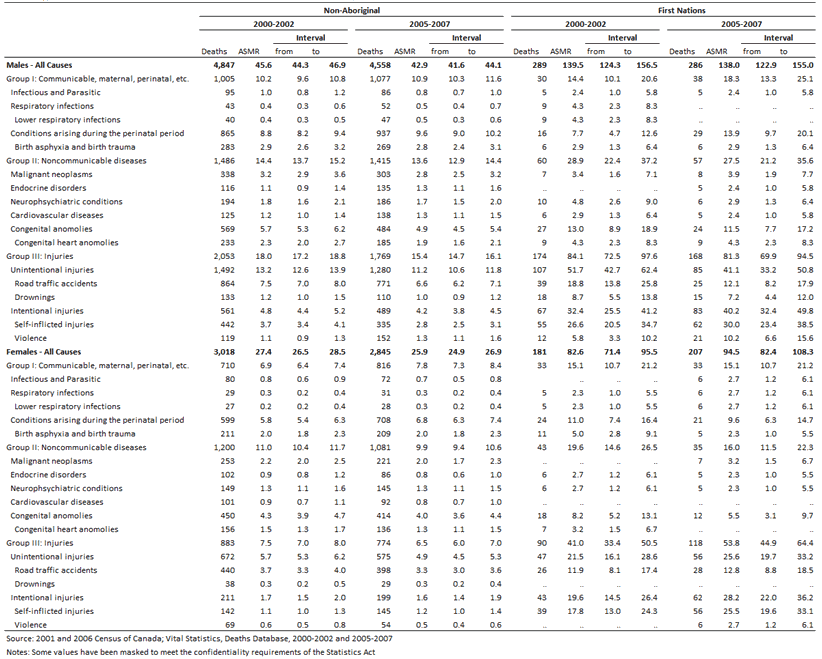
Age-standardised mortality rates (ASMR) for children and youth in high-percentage First Nations identity areas were significantly higher than low-percentage Aboriginal identity areas. The ASMR for low-percentage Aboriginal identity areas was 45.6 per 100 000 for males and 27.4 per 100 000 for females in 2000-2002, decreasing to 42.9 per 100 000 for males and 25.9 per 100 000 for females in 2005-2007. In comparison, high-percentage First Nations identity areas had an ASMR of 139.5 per 100 000 for males and 82.6 per 100 000 for females in 2000-2002 and 138.0 per 100 000 for males and 94.5 per 100 000 for females in 2005-2007. The differences between low percentage Aboriginal and high-percentage First Nations identity areas were significant for both sexes in both time periods, and there was a statistically significant increase in the ASMR for females in these areas between the two periods.
The ASMR by cause illustrates specific categories and causes of death that contributed significantly to overall differences in the ASMR. Of the three Global Burden of Disease groupings, non-communicable diseases and injuries had the largest differences between low-percentage Aboriginal and high-percentage First Nations identity areas for both males and females. Of non-communicable disease, the largest differences were for congenital anomalies, particularly congenital heart anomalies. There were also slightly higher rates for endocrine disorders and neuropsychiatric conditions in high-percentage First Nations identity areas.
Injuries remained the most significant contributor to overall differences in mortality for both males and females. Rates of unintentional injury were significantly higher in high-percentage First Nations identity areas, with road traffic accidents and drowning the major causes. Additionally, intentional injuries, particularly self-inflicted injury, were much higher in high-percentage First Nations identity areas.
Table 2: Age-standardised mortality rates for children and youth in high-percentage First Nations identity areas
and low-percentage Aboriginal identity areas, Canada, 2000-2002 and 2005-2007, by cause

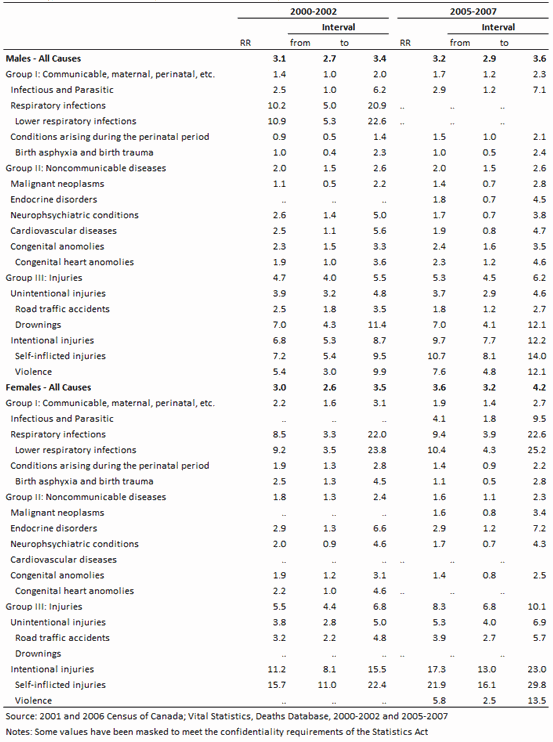
Rate ratios of the ASMR between low percent Aboriginal and high-percentage First Nations identity areas further highlight the calculated mortality differentials. Overall, rate ratios for males were 3.1 for 2000-2002 and 3.2 for 2005-2007 and for females were 3.0 for 2000-2002 and 3.6 for 2005-2007. Grouped according to WHO Global Burden of Disease classification24, within Group I - infectious and parasitic diseases, the largest differences were for respiratory infections, particularly lower respiratory infections. For Group II causes - non-communicable diseases, the rate ratios were not as great, with congenital anomalies for males and endocrine disorders for females showing the largest rate ratios for 2005-2007.
The highest rate ratios were for Group III causes - injuries, with rate ratios of 4.7 and 5.3 for males in 2000-2002 and 2005-2007 and rate ratios of 5.5 and 8.3 for females in the same periods. For males, drowning mortality was significantly greater in high-percentage First Nations identity areas compared with low-percentage Aboriginal identity areas, with a rate ratio of 7.0 for both 2000-2002 and 2005-2007. However, the largest differences between high-percentage First Nations identity areas and low-percentage Aboriginal identity areas were for intentional injuries. For males, the rate ratios for self-inflicted injuries were 7.2 and 10.7 for 2000-2002 and 2005-2007, and 5.4 and 7.6 for deaths from intentional violence in 2000-2002 and 2005-2007. For females, the rate ratios for self-inflicted injuries were 15.7 and 21.9 for 2000-2002 and 2005-2007 and 3.8 and 5.3 for 2000-2002 and 2005-2007.
Table 3: Age-standardised mortality rate ratios for children and youth in high-percentage First Nations
identity areas and low-percentage Aboriginal identity areas, Canada, 2000-2002 and 2005-2007, by cause

Discussion
Strengths and limitations
A strength of this study is that it uses national-level vital statistics registration data across two time periods. Vital events were geographically coded to small geographic units classified as high-percentage First Nations identity areas and compared against low-percentage Aboriginal identity areas. This area-based geozones methodology allows for mortality to be calculated for children and youth by sex and by detailed cause of death for multiple time periods. However, some limitations warrant discussion.
As Aboriginal identifiers are not uniformly available for vital events, a geographical proxy was used for all census DAs with a high percentage of persons identifying as First Nations. As such, this is an ecological study and reports results for geographical areas; the observed differences do not necessarily apply at the individual level. The upper one-third of the total Aboriginal population distribution was used as a cut-off for high First Nations areas, where 97.7% of the population aged 1-19 were of First Nations identity in 2006. As such, some of the population considered in high-percentage First Nations areas are not of First Nations identity, and many First Nations peoples reside in areas classified as low-percentage Aboriginal identity areas.
The potential contributions of social determinants of health or health service delivery were not considered in this article but as is shown, these areas differ by several socioeconomic characteristics and not just by the proportion of First Nations or non-Aboriginal residents. The objective of this article was to describe mortality differences between children and youth living in high-percentage First Nations identity areas and those in low-percentage Aboriginal identity areas. Given the differences in key socioeconomic and demographic characteristics, the relationship of health determinants to causes of mortality warrants further investigation.
This study confirms the persistent and substantial disparities in mortality between children living in high-percentage First Nations areas. The differences found here are similar to those found in other countries, including Australia, New Zealand, and the USA30. The causes of death for Indigenous children in Australia are very similar to those found in Canada, with external causes the most prevalent at a rate three times that of non-Indigenous children, and suicide for Indigenous girls five times the rate their non-Indigenous counterparts31. For Maori children aged 5-14 years, injuries and suicide are among the most common causes of death32.
This study is the first to use national vital statistics data to report on causes of mortality for children aged 1-19 living in high-percentage First Nations identity areas compared with low-percentage Aboriginal identity areas. An area based approach was used in the absence of individual Aboriginal identity identifiers. The results presented here show significant difference in mortality outcomes for children and youth in high-percentage First Nations identity areas compared with those in low-percentage Aboriginal identity areas.
Acknowledgement
Funding to conduct this research was provided by the First Nations Inuit Health Branch of Health Canada and from the Strategic Research Directorate of Aboriginal Affairs and Northern Development Canada.
References
1. Public Health Agency of Canada. Canadian Perinatal Health Report: 2008 Edition. Ottawa, ON: Public Health Agency of Canada, 2008; 317. Available: http://www.phac-aspc.gc.ca/publicat/2008/cphr-rspc/index-eng.php (Accessed 24 June 2013).
2. Smylie J, Crengle S, Freemantle J, Taualii M. Indigenous birth outcomes in Australia, Canada, New Zealand and the United States - an overview. Open Women's Health Journal 2010; 4: 7-17.
3. Health Canada. A statistical profile on the health of First Nations in Canada: vital statistics for Atlantic and Western Canada, 2001/2002. Ottawa, ON: Health Canada, 2011; 66.
4. Jebamani LS, Burchill CA, Martens P. Using data linkage to identify First Nations Manitobans. Canadian Journal of Public Health 2005; 96(Suppl1): S28-S32.
5. Wilkins R, Tjepkema M, Mustard C, Choinière R. The Canadian census mortality follow-up study, 1991 through 2001. Statistics Canada Health Reports 2008; 19(3): 25-43.
6. Tjepkema M, Wilkins R. Remaining life expectancy at age 25 and probability of survival to age 75, by socioeconomic status and Aboriginal identity. Statistics Canada Health Reports 2011; 22(4): 31-36. Available: http://www.statcan.gc.ca/pub/82-003-x/2011004/article/11560-eng.pdf (Accessed 24 June 2013).
7. Allard YE, Wilkins R, Berthelot J-M. Premature mortality in health regions with high Aboriginal populations. Statistics Canada Health Reports 2004; 15(1): 51-60. Available: http://www.statcan.gc.ca/pub/82-003-x/82-003-x2003001-eng.pdf (Accessed 24 June 2013).
8. Wilkins R, Uppal S, Finès P, Senécal S, Guimond É, Dion R. Life expectancy in the Inuit-inhabited areas of Canada, 1989 to 2003. Statistics Canada Health Reports 2008; 19(1): 7-19.
9. Fantus SB, Qui F, Hux J, Rochon P. Injury in First Nations communities in Ontario. Canadian Journal of Public Health 2009; 100(4): 258-262.
10. Carrière GM, Garner R, Sanmartin C, Longitudinal Health and Administrative Data Research Team. Acute-care hospitalizations and Aboriginal identity in Canada, 2001/2002. Ottawa, ON: Statistics Canada, 2010; 25. Available: http://www.statcan.gc.ca/pub/82-622-x/82-622-x2010005-eng.pdf (Accessed 24 June 2013).
11. Peters PA, Oliver LN, Carrière GM. Geozones: an area-based method for analysis of health outcomes. Statistics Canada Health Reports 2012; 23(1): 55-64.
12. Oliver LN, Kohen DE. Unintentional injury hospitalizations among children and youth in areas with a high percentage of Aboriginal identity residents: 2001/2002 to 2005/2006. Statistics Canada Health Reports 2012; 23(2): 7-15.
13. Oliver LN, Peters PA, Kohen DE. Mortality rates among children and teenagers in Inuit Nunangat: 1994 to 2008. Statistics Canada Health Reports 2012; 23(3): 17-22.
14. McShane K, Smylie J, Adomako P. Health of First Nations, Inuit, and Métis Children in Canada. In: J Smylie, P Adomako (Eds); Indigenous Children's Health Report: Health Assessment in Action. Toronto, ON: Keenan Research Centre, The Centre of Research on Inner City Health, 2009; 11-66. Available: http://www.crich.ca (Accessed 24 June 2013).
15. Denny K, Brownell M. Taking a social determinants perspective on children's health and development. Canadian Journal of Public Health 2010; 101(Suppl3): S4-S7.
16. Gracey M, Malcolm K. Indigenous health part 1: determinants and disease patterns. Lancet 2009; 374: 65-75.
17. Gionet L. First Nations people: selected findings of the 2006 Census. Canadian Social Trends, Statistics Canada 2009; 87(Winter): 53-58. Available: http://www.statcan.gc.ca/pub/11-008-x/2009001/article/10864-eng.pdf (Accessed 24 June 2013).
18. Statistics Canada. First Nations Children Under Six Years Old Living Off Reserve. Ottawa, ON: Statistics Canada, 2008; 4. Available: http://www.statcan.gc.ca/pub/89-634-x/89-634-x2008003-eng.pdf (Accessed 24 June 2013).
19. Alaghehbandan R, Sikdar KC, MacDonald D, Collins KD, Rossignol AM. Unintentional injuries among children and adolescents in Aboriginal and non-Aboriginal communities, Newfoundland and Labrador, Canada. International Journal of Circumpolar Health 2010; 69(1): 61-71.
20. Luo Z-C, Kierans WJ, Wilkins R, Liston RM, Uh S-H, Kramer M. Infant mortality among First Nations versus non-First Nations in British Columbia: temporal trends in rural versus urban areas, 1981-2000. International Journal of Epidemiology 2004; 33: 1252-1259.
21. Simonet F, Wassimi S, Heaman M, Smylie J, Martens P, McHugh NGL et al. Individual- and community-level disparities in birth outcomes and infant mortality among First Nations, Inuit and other populations in Quebec. Open Women's Health Journal 2010; 4: 18-24.
22. Statistics Canada. 2006 Census Dictionary. Ottawa, ON: Statistics Canada. 2010.
23. Statistics Canada. Vital Statistics: Death Database. (Online) 2009. Available: http://www23.statcan.gc.ca/imdb/p2SV.pl?Function=getSurvey&SDDS=3233&lang=en&db=imdb&adm=8&dis=2 (Accessed 2 July 2013).
24. Lopez AD, Mathers CD, Ezzati M, Jamison DT, Murray CJL (Eds). Global burden of disease and risk factors, 1st edn. Washington, DC: World Bank, Oxford University Press, 2006; 475.
25. Wilkins R, Peters PA. PCCF+ Version 5K User's Guide. Ottawa, ON: Statistics Canada, 2012. Available: http://www5.statcan.gc.ca/bsolc/olc-cel/olc-cel?catno=82F0086XDB&lang=eng (Accessed 24 June 2013).
26. Wilkins R. Use of postal codes and addresses in the analysis of health data. Statistics Canada Health Reports 1993; 5(2): 157-177.
27. Robson B, Purdie G, Cram F, Simmonds S. Age standardisation - an indigenous standard? Emerging Themes in Epidemiology 2007; 4(1742-7622): 3.
28. Statistics Canada. Census of Population, 2006. (Online) 2006. Available: http://www12.statcan.gc.ca/census-recensement/2006/index-eng.cfm (Accessed 2 July 2013).
29. Chiang C. The life table and its applications. Malabar: Robert E Krieger, 1984.
30. Smylie J, Adomako P (Eds). Indigenous Children's Health Report: Health Assessment in Action. Toronto, ON: Keenan Research Centre, The Centre of Research on Inner City Health, 2009.
31. Australian Institute of Health and Welfare, Australian Bureau of Statistics. The health and welfare of Australia's Aboriginal and Torres Strait Islander Peoples. AIHW cat. no15. Canberra, ACT: AIHW & ABS; 2008.
32. Crengle S. Health of Maori Children in Aotearoa / New Zealand. In: J Smylie, P Adomako (Eds); Indigenous Children's Health Report: Health Assessment in Action. Toronto, ON: Keenan Research Centre, The Centre of Research on Inner City Health, 2009; 95-105.


