


Introduction
Cancer continues to be one of the top five leading causes of death globally, and specifically ranks second as the leading cause of mortality in the USA1. In particular, individuals living in non-metropolitan (rural) regions of the USA have higher cancer mortality rates than persons living in metropolitan (urban) regions even though nationwide cancer mortality rates are 20% lower2. Yao et al found that cancer mortality rates were 36% higher in rural Appalachian Kentucky compared to West Virginia, the only state wholly designated as Appalachian3.
As of July 2016, approximately 25.6 million or 8% of the US population live in the 13-state Appalachian region of the USA4. Of those individuals residing in Appalachia, 16 million live in metropolitan areas compared to 7 million who live in non-metropolitan areas. The Appalachian region is divided into five subregions: Northern, North Central, Central, South Central, and Southern4. The region follows the spine of the Appalachian Mountains, from New York to Mississippi, and comprises 420 counties in 13 states. The 54 primarily rural counties designated as Appalachian in the state of Kentucky are considered part of Central Appalachia4.
Over 1.1 million people live in Appalachian Kentucky and 3.2 million live in non-Appalachian Kentucky4. As of July 2016, Caucasians were the predominant racial group in both Appalachian (94.7%) and non-Appalachian (81.5%) Kentucky. Individuals residing in non-Appalachian Kentucky are more likely to have higher levels of education than their Appalachian counterparts. For example, approximately 26% of non-Appalachians versus 14.3% of Appalachians have a bachelor’s degree. From 2012 to 2016, the median per capita income for Appalachian Kentucky residents was $19,212 and 11% of the population were below 50% of the federal poverty level; this is in comparison to a median per capita income of $26,835 in non-Appalachia, and only 7% of residents below 50% of the poverty level4.
Cancer incidence varies among the different regions of Appalachia. For example, Wingo et al investigated the cancer incidence in Appalachia from 2001 to 2003 and found that the incidence of prostate cancer (PC) was higher in Northern Appalachia compared to Central Appalachia and that this difference was related to socioeconomic conditions5. In contrast to these findings, a study by Wilson et al from 2004 to 2011 showed that Southern Appalachia had a higher incidence of PC than Northern or Central Appalachia6. The authors hypothesized that the findings might be related to the demographics of the population: approximately 30% of the Appalachian African American population lived in the Southern region compared to 15% in Central Appalachia and 17% in the Northern region6. Antwi et al. demonstrated that PC-specific mortality was significant in the Appalachian region compared to the non-Appalachian area of the USA7.
Despite being the most commonly diagnosed malignancy in men in the USA1, and differing findings from across the Appalachian region, PC in Appalachian Kentucky has not been well studied. Therefore, the purpose of this study was to conduct a population-based survival analysis of PC focused on comparisons between Appalachian Kentucky and non-Appalachian Kentucky.
Data sources
This retrospective population-based study extracted records of all PC patients residing in Kentucky from the Kentucky Cancer Registry (KCR) from 2007 to 2011. The KCR is a population-based registry, awarded the highest level of certification by the North American Association of Central Cancer Registries for objective evaluation of completeness, accuracy, and timeliness every year since 1997 and is also part of the National Cancer Institute’s Surveillance, Epidemiology and End Results (SEER) program. The KCR also links its database to 2011 health administrative claims for additional comorbidity and treatment information. The linked data includes claims from Medicare, Medicaid, and private insurance companies (eg Humana, Blue Cross), thereby providing a more complete review of treatment procedures, medical comorbidities, and insurance-related variables across all age groups.
Study population and variables
The study included all PC patients residing in Kentucky between 2007 and 2011 and included in the linked KCR data. To limit biases, only first primary cancer cases with a minimum age of 20 years were included. To minimize selection bias, cases extracted through death certificate and autopsy cases were excluded. A total of 12 971 out of 14 680 PC cases met selection criteria and were used for data analysis. If a patient had treatment-related claims, such as radiation, chemotherapy, and hormone treatment, captured 1 month prior to their cancer diagnosis up to 1 year after diagnosis, this claims information was used to augment KCR treatment data.
Prostate-specific antigen (PSA) level at diagnosis was defined based on the patient’s laboratory value and recategorized as 1–10, 10–20 or >20. Gleason score at diagnosis was grouped as <6, 6–8, >8–10 and unknown. The Charlson comorbidity index (CCI) was calculated based on the KCR-linked claims data and represented the 1–12-month time period prior to cancer diagnosis8. The CCI variable was categorized as 0, 1, 2 and ≥3; it was treated as unknown if a case did not have 12 months of continuous insurance coverage prior to the cancer diagnosis.
Urban/rural status was based on the US Department of Agriculture’s 2003 Urban–Rural Continuum Codes, with 1–3 defined as ‘urban’ and 4–9 as ‘rural’9. The county-level Appalachian status was based on definitions from the Appalachia Regional Commission10. Percentage below poverty was defined based on quantiles of census tract level, with less than 6.51% as ‘low’, >6.51–12.31% as ‘moderate’, >12.31–20.17% as ‘high’, and >20.17 as ‘very high’. Ascertainment of a high school education was also defined based on quantiles of census tract level, with less than 66.12% as ‘very low’, >66.12–75.54% as ‘low’, >75.54–85.38% as ‘moderate’, and >85.38% as ‘high’. Other study demographic and clinical variables included age at diagnosis, year at diagnosis, race, smoking history, insurance status, survival status, stage at diagnosis, number of lymph nodes examined, tumor size, tumor histology, and treatment type.
Statistical analysis
Descriptive analysis of demographic and clinical factors was performed. Bivariate analyses with χ2 tests were performed to examine the association between Appalachian status and other covariates. Kaplan–Meier plots and log-rank tests were conducted for survival analysis. Stepwise Cox regression analyses were performed to estimate the effect of Appalachian status and other clinical and demographic variables for both observed survival and cause-specific survival. All analyses were performed using Statistical Analysis Software v9.4 (SAS Institute, Inc., http://www.sas.com). All statistical tests were two-sided with p<0.05 used to identify statistical significance.
Ethics approval
The study was approved by the Institutional Review Board at the University of Kentucky (17-0533-P1G).
Results
A total of 12 971 individuals diagnosed with PC between January 2007 and December 2011 were identified. As presented in Table 1, 73.2% of these cases were from non-Appalachian Kentucky counties and 26.8% were from Appalachian counties. The most common age group in non-Appalachia was 50–64 years and in Appalachia 65–74 years. Caucasian was the predominant race in both geographic regions. Compared to their non-Appalachian Kentucky counterparts, more PC patients in Appalachia were uninsured (1.8%), lived in rural areas (87.8%), were rated with an ascertainment of ‘very low’ high school education (65.9%), and associated with ‘very high’ poverty (68%) (Table 2). Clinically, PC patients from Appalachia were more likely to present with a Gleason score of 8–10 (16.8%) and with a PSA level >20 (12.3%), be diagnosed with stage 4 disease (6.9%), have poorly differentiated histology (53.5%), and have a CCI>3 (5.4%) compared to non-Appalachian patients. Appalachian PC patients had higher rates of no treatment, radiation therapy only, hormone treatment only, and combined radiation/hormone treatment.
In an unadjusted survival analysis, there was a 5-year overall survival difference between Appalachian Kentucky and non-Appalachian Kentucky PC cases (p<0.001) (Fig1). After controlling for demographic and clinical variables in a Cox regression model, no survival difference was seen between Appalachian Kentucky and non-Appalachian Kentucky PC cases (p=0.4) (Table 2). However, statistical significance in survival was observed among other variables such as age at diagnosis, insurance, smoking status, Gleason score, PSA, CCI, treatment, and education (Table 2).
Despite a 5-year lower incidence of PC in Appalachia as compared to non-Appalachian Kentucky, Kentucky, and the USA, the authors observed a significantly higher 5-year PC mortality rate in Appalachian Kentucky compared to non-Appalachian Kentucky as well as the USA as a whole (Table 3).
Table 1: Demographic and cancer attributes for patients diagnosed with prostate cancer in Kentucky from 2007 to 2011: comparison between Appalachian and non-Appalachian Kentucky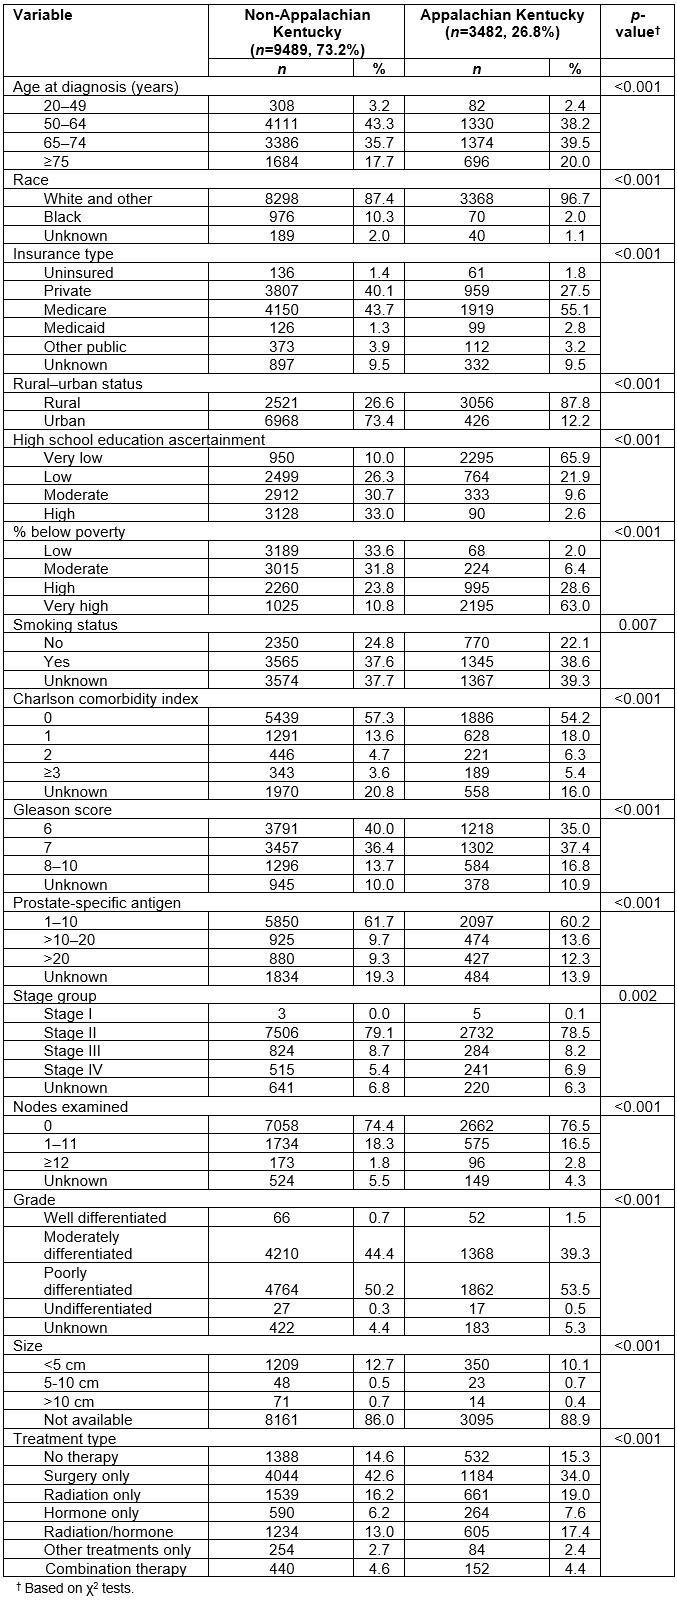
Table 2: Estimates of Appalachian status and other covariates in a Cox-regression model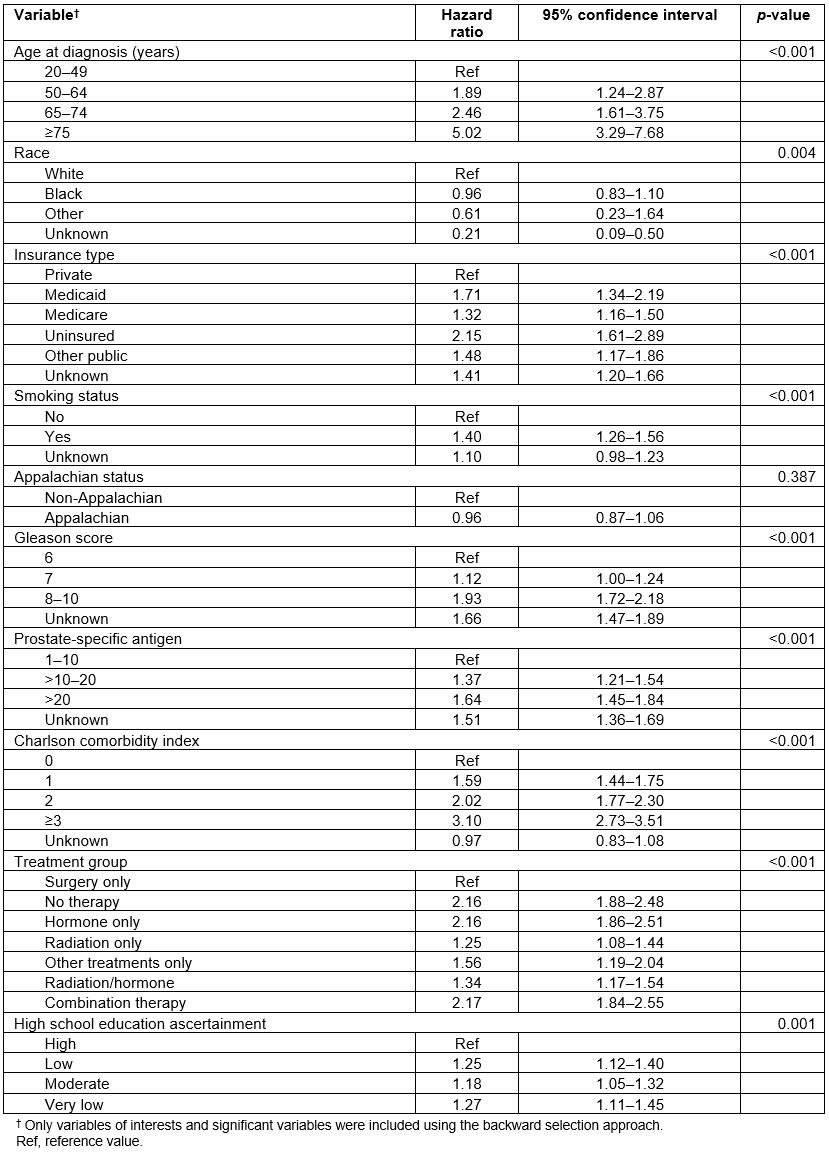
Table 3: Age-adjusted incidence and mortality rates of prostate cancer in Appalachian Kentucky, non-Appalachian Kentucky and USA, 2010–2014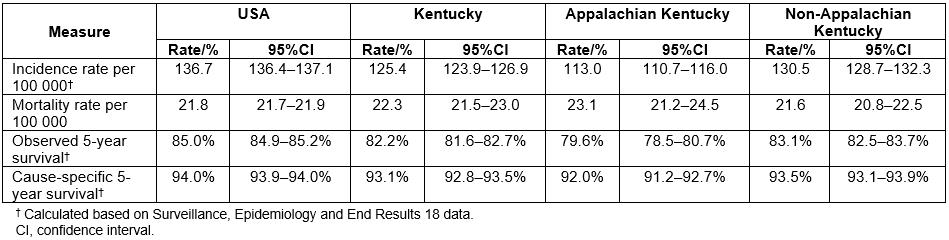
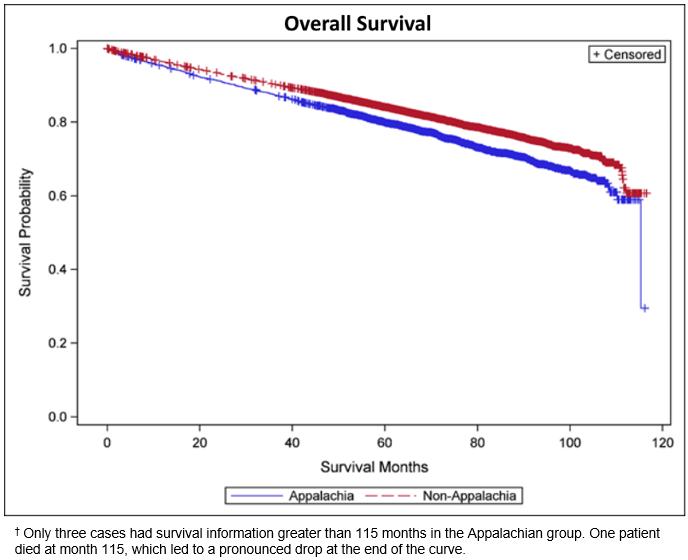 Figure 1: Kaplan–Meier plots by Appalachian status.†
Discussion
PC is the most common malignancy among men in the USA. Interestingly, when comparing the PC incidence and mortality rates using SEER data from 2005 to 2014, findings suggest that Appalachian Kentucky had a lower incidence but a higher mortality rate compared to non-Appalachian Kentucky and the USA. This population-based study based on PC data from the KCR from 2007 to 2011 showed that men in Appalachian Kentucky have a significantly higher mortality rate of PC compared to their counterparts in non-Appalachian Kentucky. This disparity in PC mortality may be primarily attributed to lower socioeconomic status, lower levels of education, increased risk behaviors and presence of comorbidities, and fewer available health resources in rural Appalachian Kentucky11. However, the disparity can’t be explained by geography alone. Interestingly, Appalachian PC patients were also more likely to present with advanced clinical cases, including higher Gleason scores, higher PSA values, stage 4 disease, and poorly differentiated tumor histology, which may have impacted overall survival.
Uninsured patients had worse outcomes compared to individuals covered by Medicaid, and Medicaid patients fared worse compare to men covered by Medicare. Uninsured and low-income PC patients with Medicaid may have inadequate access to primary, secondary, and tertiary-related health care services and experience variations in treatments12,13. Additionally, these PC patients may face other barriers to care such as limited transportation and financial distress related to their diagnosis. PC patients who did not finish high school had an increased risk of dying compared to those who had a bachelor’s degree or more. Blackley et al suggested that education and income status are associated with higher cancer mortality and suggested that improving education levels could result in decreased cancer mortality rate in Appalachia14.
As expected, this study demonstrates that men aged over 75 years, those with higher Gleason scores and PSA values, smokers, and those with a higher number of comorbidities experienced lower survival as all these factors are associated with poorer overall health and negative cancer-related outcomes.
In order to improve PC outcomes in Appalachian Kentucky, more research and educational programming are needed at multiple levels, including the patient and their family. Schoenberg et al conducted a community survey to address cancer disparities in Appalachian Kentucky and identified three challenges: (1) inadequate awareness of the need for cancer prevention and screening, (2) insufficient access to services across the cancer continuum and (3) concern for lack of privacy15. Barriers related to the lack of privacy comprise personal attitudes such as fear or discomfort, personal (negative) beliefs about cancer, and misperceptions about health care and limited patient-centered communication15. Coyne et al conducted a study that explored cultural norms in rural Appalachia about health and concluded that rural Appalachian residents have a sense of place, strong family ties, and a strong spiritual belief16. Increased awareness of family cancer history, adopting a healthy lifestyle, securing social and familial support, and engaging in informed and shared decision making between PC patients and providers – along with alleviating fear and correcting misperceptions – can empower men to take control of their health.
Not only should there be efforts to educate Appalachian Kentuckians at the individual patient and family levels, but interventions are also needed to train and empower healthcare systems, clinicians, and support teams to deliver quality PC care. For example, the University of Kentucky Markey Cancer Center (MCC) is the only National Cancer Institute-designated cancer center in Kentucky17. MCC provides high quality clinical and psychosocial cancer care, along with the opportunity for patients to participate in clinical trials. The MCC also supports an Affiliate Network, a collaborative of 26 community hospitals across Kentucky18, including Appalachia, focused on increasing access to oncology education, training, clinical trials, and screening services, all with the mission of providing evidence-based, quality cancer care close to home.
Improvements in PC screening could contribute to improvements in PC survival in Appalachian Kentucky as this population is more likely to have more advanced disease at the time of diagnosis. Similarly, improvements in access to insurance, primary care providers, urology and oncology providers, and supportive care services are needed in the region. More research is also needed to understand the advanced clinical presentation of PC in Appalachia, including related behavioral, environmental, genetic, and cultural factors.
A limitation to the current study is its design as a retrospective population-based data analysis; in addition, the data is dependent on accurate coding in the KCR database. For example, data for some of the variables such as race, smoking status, PSA level and Gleason score are missing. Despite these limitations, this study presents a novel and comprehensive population-based analysis of PC survival disparities between Appalachian and non-Appalachian Kentucky and contributes to a related gap in the literature.
Conclusion
In this population-based analysis, there was a significant difference in PC survival between men from Appalachian Kentucky and that of men from non-Appalachian Kentucky. This study supports the concept that patients from Appalachia generally present with later stage, more aggressive disease. This is likely most impacted by the differences in socioeconomic and educational backgrounds of the Appalachian and non-Appalachian population that may delay diagnosis and care. Long-term efforts to improve cancer care in this population must focus on barriers to early diagnosis and treatment. Improvements in socioeconomic status and education levels, which are independent predictors of poor outcomes in this population, must be achieved in order to see a decrease in PC mortality rates in Appalachian Kentucky.