

Introduction
Nationally, the number of people in Australia who are overweight or obese has risen from 56% in 1995 to 67% in 2017–181. This trend is amplified in regional and rural Australia with 72% of those living outside of major cities being overweight or obese compared to 65% in major cities1. Concomitantly, rural populations have a higher prevalence of chronic diseases such as cardiovascular disease, type II diabetes and some cancers1.
In high income countries, greater overweight or obesity prevalence in rural areas may be related to the food environment, such as the accessibility and availability of food in the community and home, plus individual demographic characteristics and food preferences that increase the risk of obesity2,3. For example, low population size and remoteness combine to limit the variety of food and outlets, which will tend to reflect the dominant food culture4,5. At an area level, demand is affected by broad issues of access such as remoteness and public transport – often very limited rurally – which can increase food costs4,6,7. At an individual level, female gender, education, highly skilled occupations, high income and health literacy are associated with improved dietary knowledge or healthy food habits8-10. These may be significant because residents in rural and remote areas of Australia have greater socioeconomic disadvantage and healthy food may be comparatively more expensive4.
Rural populations tend to have dense, close-knit social networks, which may dually promote and constrain healthful choices11,12. Peer influences may be critical because food is often an integral part of community social occasions; rural populations may have more conservative dietary attitudes preferring traditional familiar foods, thus novel dietary changes may exclude individuals from their community networks13,14.
Much current research has focused on geographical determinants of the food environment, with limited research examining socioeconomic determinants of diet, particularly in rural areas15. The purpose of the present study therefore was to examine the associations between neighbourhood and individual socioeconomic factors, dietary attitudes, and consumption of fruit and vegetables, in rural areas of south-eastern New South Wales (NSW).
Method
Participants
A volunteer sample of adults who attended rural shows in four towns in NSW (Goulburn, Tarago, Cooma and Yass) during the Australian spring and summer of 2017–18, and patients attending general practices in Young and Cowra, was selected. People were invited to participate in the survey if they approached the Australian National University Rural Medical Society blood pressure screening stall at the shows. Surveys were completed on paper or online using an iPad. In the general practice offices, surveys and explanatory information were made available at the reception desk; surveys were completed in the waiting room and lodged in a secure box. The questionnaire was developed into an online survey using Qualtrics software June 2018 version (Qualtrics LLC; http://www.qualtrics.com). The collected data was exported from Qualtrics and entered from the paper surveys into Microsoft Excel. The total data collection period was from February to July 2018.
Data collection
A questionnaire was developed using previously validated questions from existing surveys. The main source was a large study conducted in the UK examining social class through items examining economic, cultural and social capital16, which has been translated for use in an Australian setting17. Questions on eating and lifestyle attitudes were adapted from the Health Survey for England – 200718. The validity of the questions for use in the target population was further checked by conducting focus groups with rural community members (staff in the Australian National University Rural Clinical School).
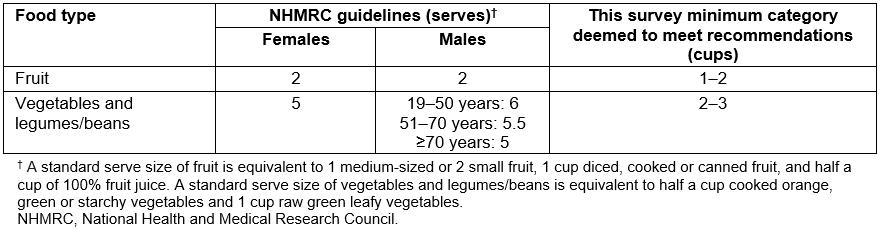
Dietary outcome measures: Three dietary outcomes were investigated: daily fruit intake, daily vegetable intake and a dietary attitude score. Questions about fruit and vegetable intake were recorded as cups per day (0, <0.5, 0.5–1, 1–2, 2–3, 3–4 and >4) and analysed as binary variables to approximate whether the recommended dietary guidelines for fruit and vegetable intake were met according to the National Health and Medical Research Council Australian Dietary Guidelines19. The survey equivalent for meeting the guidelines for fruit intake was defined as 1–2 cups per day and for vegetable intake was defined as 2–3 cups per day (Supplementary Table 1).
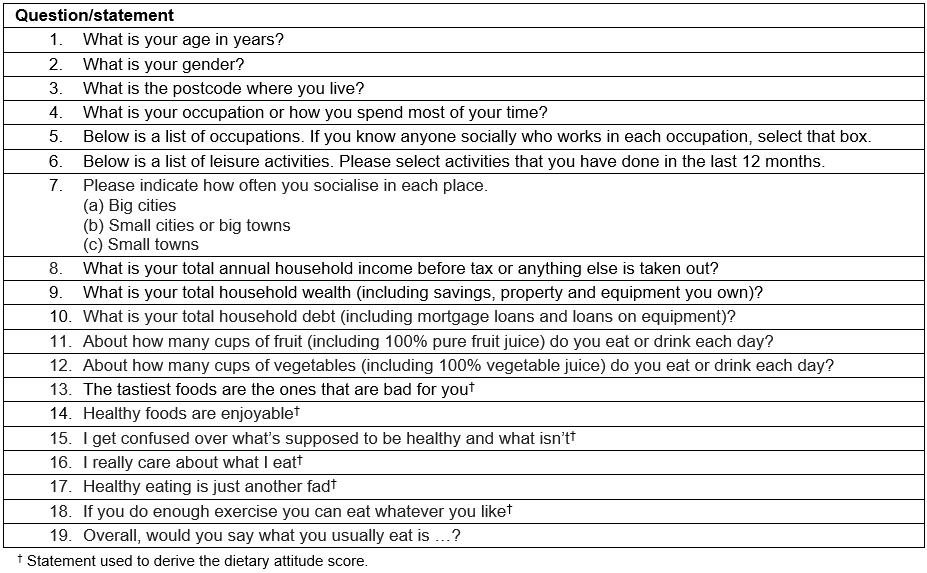
The dietary attitude score was derived from five statements regarding healthy eating (Supplementary Table 2) such that a higher score indicated more positive attitudes towards healthy eating. The scoring for the statements ‘Healthy foods are enjoyable’ and ‘I really care about what I eat’ were reversed so that a higher score corresponded to a healthier attitude. The statement ‘I get confused over what’s supposed to be healthy and what isn’t’ was excluded from the combined attitudes score, because it was viewed as a proxy for knowledge. Addition of the five statements each with scores of 1–5 gave an attitudes score with a possible minimum of 5 and a maximum of 25.
Supplementary Table 2: Survey questions
Demographic variables: Survey participants reported their sex, age (in years) and their postcode of residence. Postcodes were classified to the 2016 Remoteness Area using the Australian Statistical Geography Standard Remoteness Structure; postcodes were classified as Major Cities, Inner Regional and Outer Regional. Postcodes that covered more than one classification were assigned according to the classification containing the largest proportion of the resident population20. Those classified as resident in major cities were excluded from analysis. A binary variable of Inner Regional and Outer Regional was used for analysis of remoteness.
Social and economic indicators: Information on household income, wealth and debt was recorded in the survey as ordered categories. Neighbourhood socioeconomic position (SEP) was measured using the Index of Relative Socioeconomic Disadvantage (IRSD) obtained from self-reported residential postcodes of participants21. The IRSD indicates the socioeconomic characteristics of people living in an area, and ranks areas on a continuum from most disadvantaged to least disadvantaged. The IRSD was analysed as quintiles (ie the first quintile represents individuals living in areas in the bottom 20% of the IRSD); the top two quintiles were combined for analysis because only a small number of participants were in these classifications.
Self-reported occupation was matched to the best six-digit occupation code according to the Australian and New Zealand Standard Classification of Occupations, 2013, v1.222. Where two occupations were recorded, the first listed occupation was classified. Occupation was analysed using the standard’s major group classification: managers, professionals, technicians and trade workers, community and personal service workers, clerical and administrative workers, sales workers, machinery operators and drivers, labourers. An additional category was created to classify individuals who were economically inactive (retired, students, disability pension or home duties).
Social capital was measured as the number of a range of occupations among the participants’ social networks17. The count of known occupations that each participant knows socially was computed to derive a score. An individual-level indicator of rurality based on spaces of activity23,24 was obtained by asking participants how often they socialised in big cities, small cities or big towns, small towns (as ‘never or rarely’, ‘sometimes’, ‘often’ or ‘always’).
Statistical analysis
Data were analysed using the Statistical Package for the Social Sciences v24 (IBM; http://www.spss.com). For descriptive purposes, the mean, median, standard deviation and range were calculated for numerical variables; counts and percentages were used for categorical variables. To test whether the dietary outcome variables, and social and economic factors, differed for males compared to females, the χ2 test (Fisher’s exact if expected count less than 5) and the independent t-test were used where appropriate.
Linear regression was used to analyse the associations between the independent variables and the continuous dietary attitude score dependent variable. Logistic regression was used for analyses of the binary fruit and vegetable consumption outcome variables. Ordered categorical independent variables (SEP, occupational group, income, wealth and debt) were tested for both categorical and trend associations with the dependent variables. Independent variables associated with the dependent variables at p<0.1 in unadjusted analyses were selected for inclusion in multiple linear and logistic regression models. The demographic variables of age, sex and remoteness were included in all multiple regression models. Dietary attitude score was included as an independent variable in the models of fruit and vegetable consumption. Interactions between gender and remoteness with all other independent variables were investigated in multiple regression models; sex-specific and region-specific models were fitted where there was evidence of an interaction (interaction term p<0.1).
A supplementary regression model was fitted that was restricted to participants who were currently economically active as a sensitivity analysis of the relationship between occupational group and dietary attitude score.
Ethics approval
Ethics approval for the survey was given by the Australian National University Ethics Committee (Protocol 2017/860).
Results
Demographic and socioeconomic characteristics
A total of 354 people completed the questionnaire; 28 non-rural respondents were excluded, leaving 326 participants. Of these, 64% were female and 89% resided in inner regional areas of NSW (Table 1). The median age of respondents was 57 years (range 20–90 years); female respondents were younger than male respondents. A large proportion of respondents were economically inactive (41%) and 69% of these were retired.
Table 2 describes the social networks of the study population. Respondents had a median number of 10 different occupations known socially, with women having more connections than men (median 11 v 8). The frequency of socialising in big cities, big towns or small towns was fairly similar, although respondents reported socialising in big towns most frequently.
Table 1: Demographic and socioeconomic characteristics of respondents who lived in regional areas of New South Wales (n=326)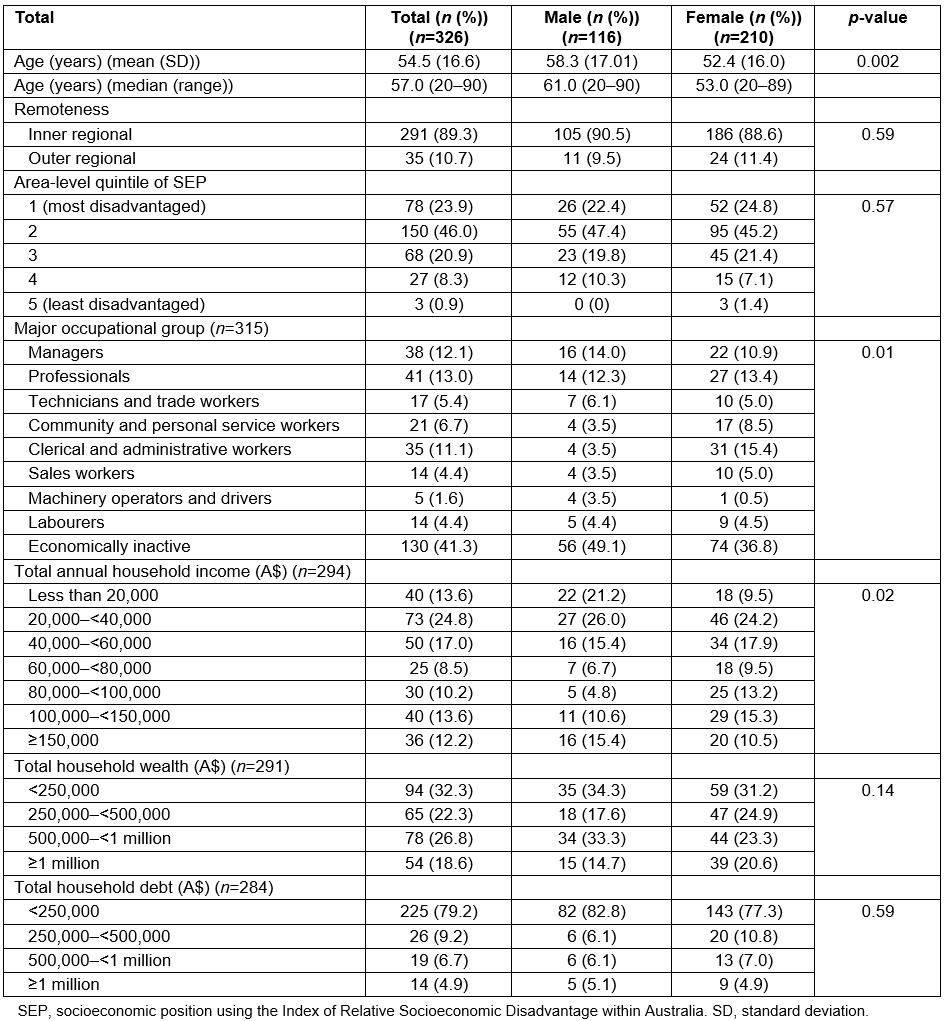
Table 2: Social network characteristics of the 326 respondents who lived in regional areas of New South Wales (n=326)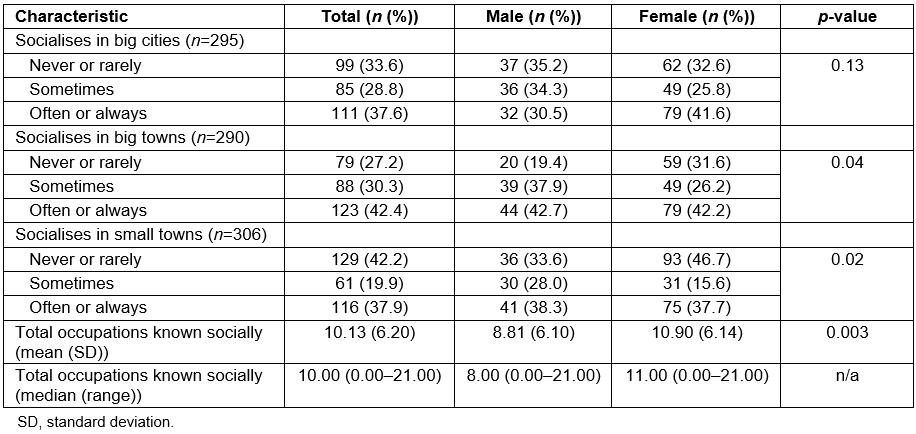
Relationships between social and economic characteristics and dietary outcomes
The healthy diet attitude score was calculated for 319 respondents; the mean and standard deviation were 18.6 and 2.97, respectively (median 19.00, range 9–25). The daily cups of fruit and vegetables consumed are shown in Figures 1 and 2. Overall, 47.2% of participants met the recommended daily fruit guidelines (38.8% of males and 51.9% of females) and 39.5% met the daily vegetable guidelines (33.6% of males and 42.8% of females) as defined in this study.
The unadjusted associations for the three dietary outcomes are presented in Table 3. Being female, having greater household wealth, a larger number of social connections and socialising regularly in small towns were statistically significantly associated with a higher healthy diet attitude score. A lower occupational group was significantly associated with a lower score. A higher dietary attitude score (odds ratio (OR)=1.13, 95% confidence interval (CI)=1.04–1.22), higher levels of household debt (OR=1.37, 95%CI=1.02–1.85) and being female (OR=1.70, 95%CI=1.07–2.70) were significantly associated with eating ≥1–2 cups/day of fruit. A higher dietary attitude score (OR=1.23, 95%CI=1.13–1.34), higher socioeconomic position (OR=1.28, 95%CI=1.00–1.64, p=0.05) and greater total household wealth (OR=1.29, 95%CI=1.04–1.60) were significantly associated with eating ≥2–3 cups/day of vegetables. The association between a decreasing occupational gradient and vegetable consumption was strongest in analyses excluding economically inactive participants (OR=0.81, 95%CI=0.70–0.95, p=0.01). There was a weak inverse association between regular socialising in cities (OR=0.62, 95%CI=0.38–1.02) and vegetable consumption.
Table 3: Unadjusted associations between demographic, social and economic independent variables and dietary attitude scale, fruit and vegetable intake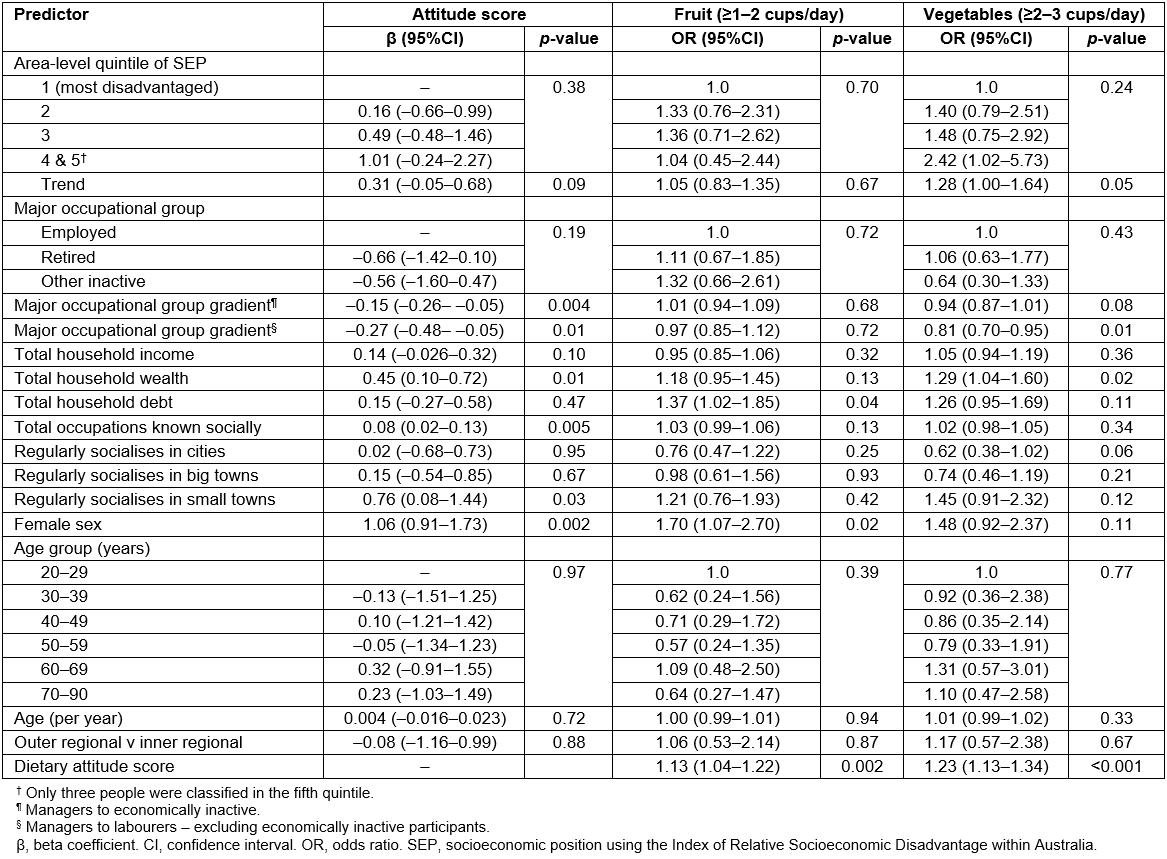
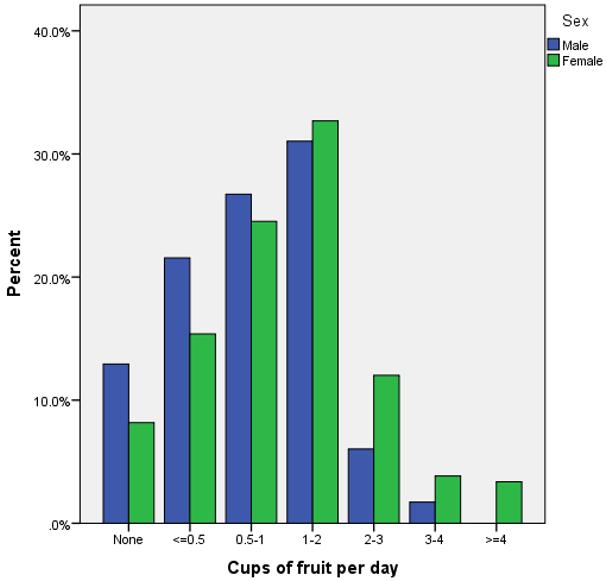 Figure 1: Daily fruit consumption of respondents (n=324).
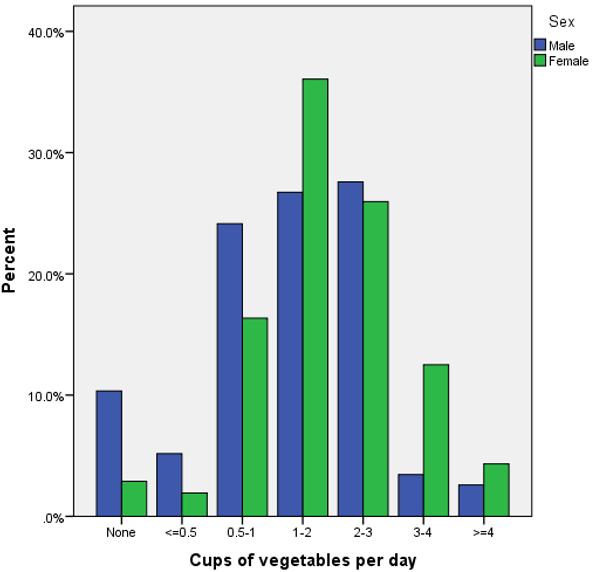 Figure 2: Daily vegetable consumption of respondents (n=324).
Multiple regression models
Fruit and vegetable consumption: Dietary attitude score was statistically significantly associated with both fruit and vegetable consumption. The odds of eating ≥1–2 cups/day of fruit increased by 13% for each unit increase in score (OR=1.13, 95%CI=1.03–1.23) (Table 4). Household debt was weakly but not significantly associated with fruit consumption (OR=1.33, 95%CI= 0.97–1.82). Associations between remoteness and fruit consumption were in the opposite directions for men and women (interaction term p=0.01). Women who ate ≥1–2 cups of fruit/day were more likely to be living in outer regional areas (OR=3.26, 95%CI=1.01–10.55) than inner regional areas, and men who ate ≥1–2 cups of fruit/day were less likely to be living in outer regional areas (OR=0.07, 95%CI=0.005–0.96).
The odds of eating ≥3–4 cups/day of vegetables increased by 19% for each unit increase in score (OR=1.19, 95% CI=1.09–1.31) (Table 5). There was an interaction between sex and remoteness (p=0.02): living in an outer regional area was associated with eating ≥3–4 cups/day of vegetables for men (OR=7.11, 95%CI=1.23–41.04) but not for women. There was also an interaction between remoteness and SEP (p=0.09): SEP was strongly but not significantly associated with vegetable consumption in outer regional areas (OR=13.51, 95%CI=0.79–230.6; p=0.07) but not in inner regional areas (OR=0.89, 95%CI=0.64–1.23; p=0.48).
Table 4: Multivariable logistic regression analysis of fruit consumption†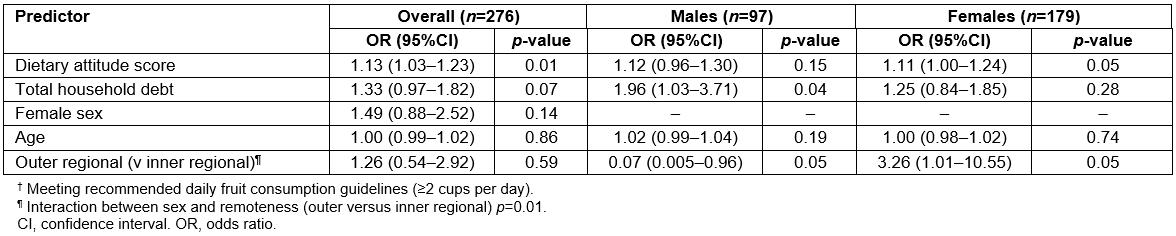
Table 5: Multivariable logistic regression analysis of vegetable consumption†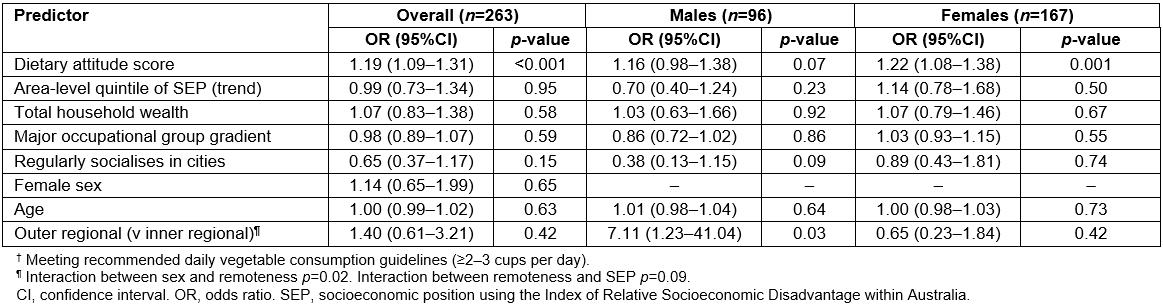
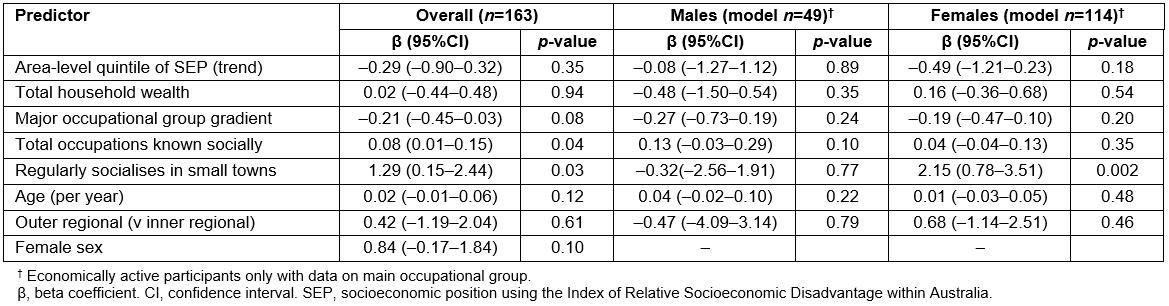
Dietary attitude score: Using multiple linear regression (Table 6), the number of social connections and socialising in small towns were statistically significantly associated with a higher dietary attitude score. The score increased by 0.07 points for each additional connection (95%CI=0.01–0.12) and by 0.9 points (95%CI=0.12–1.76) for regularly socialising in a small town compared to never, rarely or sometimes. Lower occupational group was weakly but not statistically significantly associated with a lower score (β=–0.12, 95%CI=–0.23–0.002); the association was stronger when restricted to economically active participants (β=–0.21, 95%CI=–0.45–0.03) but it was not statistically significant (Supplementary Table 3).
There was an interaction between sex and socialising in small towns (p=0.001). In sex-specific models, regularly socialising in small towns was significantly associated with a higher attitude score for women (β=1.97, 95%CI=0.93–3.00) but not men. A larger number of social connections was more strongly associated with a higher score in men, although the association was not statistically significant and there was little evidence for a gender interaction (p=0.12).
Table 6: Multiple linear regression analysis of the dietary attitude scale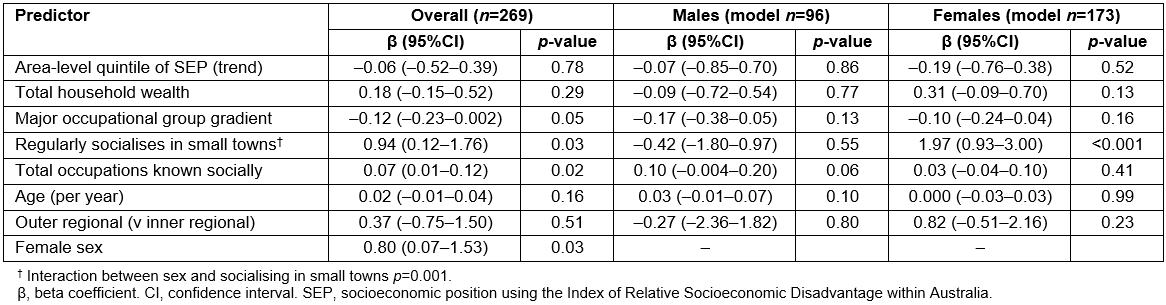
Discussion
This cross-sectional survey of rural residents in NSW investigated the associations between social and economic factors, dietary attitudes, and fruit and vegetable consumption. The findings showed that greater fruit and vegetable intake was predicted by healthier dietary attitudes, which, in turn, were related to social and community connections.
Socioeconomic gradients in diet quality have been consistently demonstrated25-28 yet it is unclear what factors explain the relationship. The findings from this study suggest that social networks, a component of social capital, influence dietary attitudes that determine fruit and vegetable intake. For men, having a social network comprising individuals from a diverse range of occupations was related to a healthier dietary attitude, which is likely to expose individuals to a variety of perspectives. The present research also suggests that women who socialise regularly in small towns have a more positive dietary attitude than women who do not. Previous research has shown that friendship networks positively influence dietary patterns (more so than family connections)29, and the findings in the present research demonstrate that the same is likely to be true in the rural setting. At a community level this would be expected to result in a spread of such attitudes, thus socialising in small towns with positive dietary attitudes will spread those positive dietary norms. A recent study in the Netherlands suggested that food-related cultural capital is important for healthy dietary behaviour30. Future research could explore the role of social networks in the development of cultural capital and the relationship with diet quality in rural communities.
Previous research points to the conservative preferences of rural populations comprising higher grades of fatty meat, dairy spreads and increased vegetable intake13,31. This may explain the potentially paradoxical results regarding regional residence, gender, and fruit and vegetable consumption. A possible hypothesis is that men in outer regional areas may be more likely to have smaller constrained social networks reflecting rural food norms, which promotes increased vegetable but not fruit intake.
There are several limitations to the study. Because the participants were volunteers the study sample was not representative of all south coast NSW residents32: the sample had a median age of 57 years compared to 49 years for south coast NSW, 64% female (v 51%), and 41% were economically inactive (v 13.5%). The study also had an over-representation of residents from inner regional areas (89%) compared to 75% of residents in all of rural NSW33. In this study, 47% and 39% of respondents met the fruit and vegetable guidelines, respectively, which is comparable to the national estimate of 51.3% for fruit but substantially greater than the national estimate of 7.5% for vegetables1. However, there may be measurement error in the fruit and vegetable consumption data, due to the guesswork required by respondents to estimate the number of cups of fruit and vegetables eaten in a day, plus the conversion of the survey answers obtained in ‘cups’ to be equivalent to the ‘serves’ as defined by National Health and Medical Research Council Australian Dietary Guidelines19. The self-reported diet and some socioeconomic variables may also be subject to recall bias. There was some missing data for income, wealth and debt because the questions were printed on the reverse side of the page and were missed by some respondents. Also, because information was not collected on household or family membership the extent to which responses on household income, wealth and debt were consistent could not be measured. The results are also subject to imprecision in the estimates due to the relatively small sample size, as seen by wide confidence intervals and lack of statistical significance for some associations, particularly for sex-stratified analyses. Larger studies are needed to confirm or refute the findings presented in this study.
Conclusion
This study provides important new insights on the importance of social and community networks in an Australian rural population on dietary attitudes. The findings are translatable to the rural community and identify opportunities for health promotion activities to improve dietary habits in rural populations through engaging with local community social networks.
References
Supplementary material is available on the live site https://www.rrh.org.au/journal/article/5328/#supplementary