
Introduction
Health systems are responsible for not only improving the health of individuals, but also protecting them against the financial costs of disease and morbidity. One of the challenges faced by governments is to reduce the burden of out-of-pocket (OOP) healthcare payments for their people by providing subsidies and extending prepaid programs1. OOP payment is the weakest and most unfair payment approach for health care. From the perspective of protection against risk as well as a justice perspective, this approach is considered the worst possible form of healthcare financing2.
OOP payments can affect the equality of access to and utilization of health services, and decelerate the movement toward universal healthcare coverage3. OOP and high medical expenses occasionally make households face catastrophic health expenditure (CHE). If a household’s OOP payment as a percentage of its capacity to pay exceeds a certain threshold, the household experiences CHE4. CHE is a major challenge for some households, especially those in low- and middle-income countries5. CHE can affect the health of all household members, and may push the household toward a cycle of poverty in health6. Poorer households are often forced to borrow money, sell assets, reduce consumption or resort to their savings to pay for their healthcare expenses, ultimately causing a state of extreme poverty7-9. WHO considers CHE and the Fair Financial Contribution Index (FFCI) as indicators of equity in household financial contribution to health systems, which have been adopted in many studies on health economics1.
Millions of people around the world suffer from financial hardship as a result of OOP healthcare payments10. Based on a WHO report, about 44 million households and more than 150 million individuals face CHE every year around the world11. Studies in Iran show that the incidence of CHE in the general population ranges from 1.97–15.3% at the national level to 3.6–24% at the regional level12-14, making for approximately 52.1% of OOP payment from the total health expenditure15.
The globally increasing costs of health care and the challenge of achieving equity in the financial contribution to health systems have raised special concerns in communities about how to finance their health systems16. WHO has declared financial risk protection as a major component of universal healthcare coverage10,17. The Fifth Economic, Social, and Cultural Development Plan of the Islamic Republic of Iran (2011–2015) emphasized this issue and proposed two goals for itself: (1) reducing the percentage of OOP healthcare expenditure from the total health expenditure to 30% and (2) reducing the percentage of households who face CHE to less than 1% by the end of the plan18.
Iran’s Ministry of Health and Medical Education (MoHME) started the Health Transformation Plan (HTP) on 5 May 2014 to achieve these goals. One of the most important goals of the HTP has been to promote justice in health financing and to reduce the burden of direct payments by the patients. The plan is mainly supported by financial resources including increased public annual budget of the health sector (an approximately 59% increase in 2015 compared to 2014), targeted subsidies (10% of the total subsidies) and a special 1% value-added tax for health. These financial resources are estimated to have been 70% higher in 2015 (21 March 2015 – 20 March 2016) compared to 2014 (21 March 2014 – 20 March 2015). After more than 4 years since its beginning, four phases of the plan have been implemented. The first phase of the HTP was conducted across hospitals affiliated to the MoHME and contained eight packages (launched on 5 May 2014). One of these packages included the reduction of the amount of direct payments by patients to 6% and 3% of the sum total of hospitalization expenditures for urban and rural residents, respectively, who visit MoHME hospitals via a referral system. The second phase of the HTP (begun on 22 May 2014) was focused on developing and extending primary health care. The third phase of the HTP was launched on 29 September 2014, with the aim of eliminating informal payments. Medical services tariffs were increased to make them closer to the actual prices. Finally, the fourth phase of the HTP was concerned with an evolution in medical education and was launched in October 201519,20.
After the HTP, a reduction was observed in CHE in some regions of Iran and studies showed the effectiveness of the plan14,21,22; however, no studies have been conducted on the effects of the plan in south-eastern Iran.
The continuous and periodic measurement of healthcare financial risk protection is recommended, preferably every 2–5 years10. Although numerous studies have measured financial risk protection in Iran before and after the HTP, no studies have yet examined it in Sistan-Baluchistan Province, except for one study by the same authors, which showed that a high percentage of households in this region are impoverished as a result of their healthcare expenditures16. Like the rest of the country, the MoHME is the largest source of healthcare funding and service provision in this province by way of its multiple healthcare centers. Due to the insufficient number of physicians and healthcare centers, long waiting times for governmental healthcare services are common for households in this impoverished region. Sistan-Baluchistan Province happens to be the largest province in Iran and the distance between its north-east to south-east is more than 800 km. Residents who wish to use specialist medical services occasionally have to travel more than 600 km. The present study thus seeks to measure the household financial contribution to healthcare expenditures in Sistan-Baluchistan Province since the HTP. The results can enable health policymakers to identify high-risk groups, develop appropriate policies and improve their interventions for accomplishing a fair financial contribution with the establishment of the HTP in Iran, especially in the discussed province.
Methods
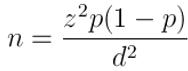
A survey of the household financial contribution to the health system in Sistan-Baluchistan Province was carried out by Zahedan University of Medical Sciences in 2017. Sistan-Baluchistan Province is among the largest provinces located in the south-east of Iran, with a population of nearly 2.5 million. The province is the most remote and poorest in the country and this poverty has extended to most of its main health indicators as well23. The study population consisted of all the households of this province (587 921). Considering α=0.05 (type-1 error), d=0.02 (minimal detectable difference), design effect=2 and p=14% (percentage of households facing CHE in a similar study in Shiraz)24 and based on the following sample size estimation equation, 2400 households were selected for the study:
In proportion to the households’ weight in each city of the province based on a 2011 census published by the Statistical Center of Iran (SCI), the samples were selected from different cities as follows: 816 samples from Zahedan as the provincial capital, 336 from Zabol, 264 from Iranshahr, 312 from Chabahar, 192 from Khash, 216 from Saravan and 264 from Nikshahr. The number of households was selected in proportion to their population in urban and rural areas. These samples were selected by stratified sampling from the urban areas and cluster sampling from the rural areas. In each cluster a health center was selected randomly, then a researcher took paper money out of his pocket and selected the first three digits as the household registered number in the health center and thus selected the first household in each cluster. The right-hand households were then selected as the next samples. Trained interviewers collected the data by visiting the sample houses door-to-door and had a questionnaire completed by them. At each household, the first informed person who was aged more than 18 years and both willing and able to answer the questions completed the questionnaire. In the case of non-cooperation for completing the questionnaires or non-response (the number of these households was very low), and because of the high similarity of these households with their neighbor, their next household was chosen as an example.
Research instrument
Data were collected using the household section of the World Health Survey questionnaire developed by WHO in 2003 for assessing performance of health systems25,26. The questionnaire contained items on the demographic characteristics of the household members and head, household expenditures, service utilization and household assets. A 1-month recall period was determined for total household expenditures, rate of use of outpatient medical services and the costs of these services. A 12-month recall period was also fixed for the rate of use and inpatient medical care services expenditure in each household. To calculate the indices, all the expenditure variables were converted on a monthly basis. The household expenditures were also regarded as an indicator of the households’ purchasing power.
The expenditures were reported in Iranian rial (IRR) and were converted to US dollars using the exchange rates at the time.
Index measurement
The main indicators of fairness in household financial contribution to the health system were measured in this survey. The methodologies used to measure these indicators and their interpretation are different. The authors of the present article have published another article extracted from the data of this survey, in the same research setting, but in a different journal, and have assessed the households’ impoverishment due to health expenditure in that article16. Two other indicators of fairness in financial contribution – the percentage of households facing CHE and FFCI – were also measured in the present study using the data extracted from the questionnaire:
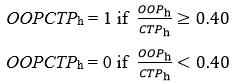
Catastrophic health expenditure: The ratio of expenditures for healthcare services to the household capacity to pay (CTP) was used to determine the percentage of households facing CHE. There is no consensual threshold for estimating the CHE, and countries may use different thresholds for their national health policies. WHO regards 40% of the household CTP as a suitable threshold, and the present study has also adopted this threshold. The CTP is the effective income of the household minus its subsistence expenditure. The total expenditure by the household was used as a representative of effective income, as it reflects the purchasing power of households most accurately. The subsistence expenditure was calculated using the food-based poverty line, which is the portion of household total expenditure for food. The CTP was calculated by subtracting the subsistence expenditure from the total expenditure in order to calculate the ratio of OOP healthcare payments to the CTP – the household’s financial burden due to health payments. If the result was equal to or more than 40%, that household was considered to be facing CHE7:
Fair Financial Contribution Index: The FFCI is another indicator for measuring fairness in health financing. The range of this index varies from 0 to 1, and the fairer a health financing system, the closer the numerical value of this index to 1:
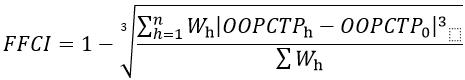
where
OOPCTPh is household’s financial burden due to health payments, as already calculated
OOPCTP0 is sum of OOP healthcare payments of all households divided by sum of their CTP
Wh is the household weighting variable27.
Determinants of catastrophic health expenditures
The multiple adjusted logistic regression model was used to study the likelihood of facing CHE and to calculate the adjusted odds ratios (OR) using the model coefficients. P-values less than 0.05 were taken to indicate statistically significant differences. The CHE occurrence was considered the dependent variable. The independent variables included place of residence; gender; job and the basic and supplementary health insurance of the head of the household; household size; having members aged more than 65 years and members with disabilities or in need of care; and the use of inpatient, dental, rehabilitation, diagnostic and laboratory health services.
All the statistical analyses were performed in the Statistical Package for the Social Sciences v22 (IBM; http://www.spss.com).
Ethics approval
The study was approved by the Ethics Committee of Zahedan University of Medical Sciences, Iran (approval number 8024). Participation was voluntary in this study.
Results
The study was carried out among 2400 households in Sistan-Baluchistan Province. Most of the households were in Zahedan (34.0%), and 1683 (70.1%) of them were in urban areas. About 92% of the household heads were male, and about 76% of the household heads had 12 years of education or less. Table 1 shows the demographic variables of the 2400 households.
As shown in Figure 1, the mean OOP health expenditure was about US$82 (246) for all the participants. Figure 2 presents the FFCI among the participants. According to the results, the FFCI was approximately 0.7 across the province. In addition, about 20.2% of the households in Sistan-Baluchistan Province had experienced CHE, which is shown in detail in Figure 3.
Table 2 presents the relationship between the study variables and CHE. The multiple adjusted logistic regression analysis showed statistically significant relationships between the chances of facing CHE and variables including place of residence (p=0.010), having members aged more than 65 years (p=0.005) and having members with disabilities and in need of care (p=0.001). There were also statistically significant relationships between the chance of facing CHE and variables related to the use of health services, including the use of dental (OR=5.212), rehabilitation (OR=2.471), diagnostic and laboratory (OR=3.637), and inpatient (OR=2.511) services. The results revealed that a household size of three to six was a protective factor against CHE (OR=0.736), and the lowest CHE was observed in households of this size.
There were no significant relationships between facing CHE and variables such as gender (p=0.717), job status (p=0.429), the basic health insurance status (p=0.140) and supplementary health insurance status of the household head (p=0.089).
Table 1: Demographic variables of households studied in Sistan-Baluchistan Province in 2017 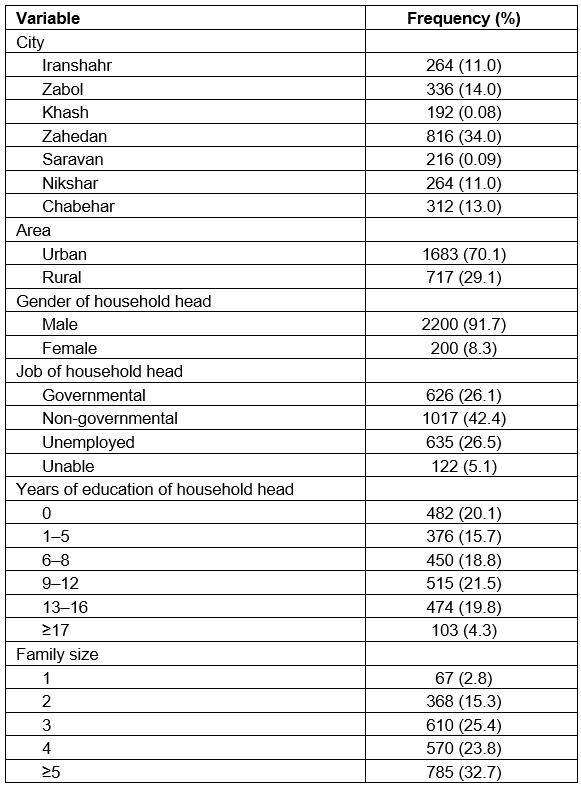
Table 2: Relationship between determinants and facing catastrophic health expenditure among study participants in 2017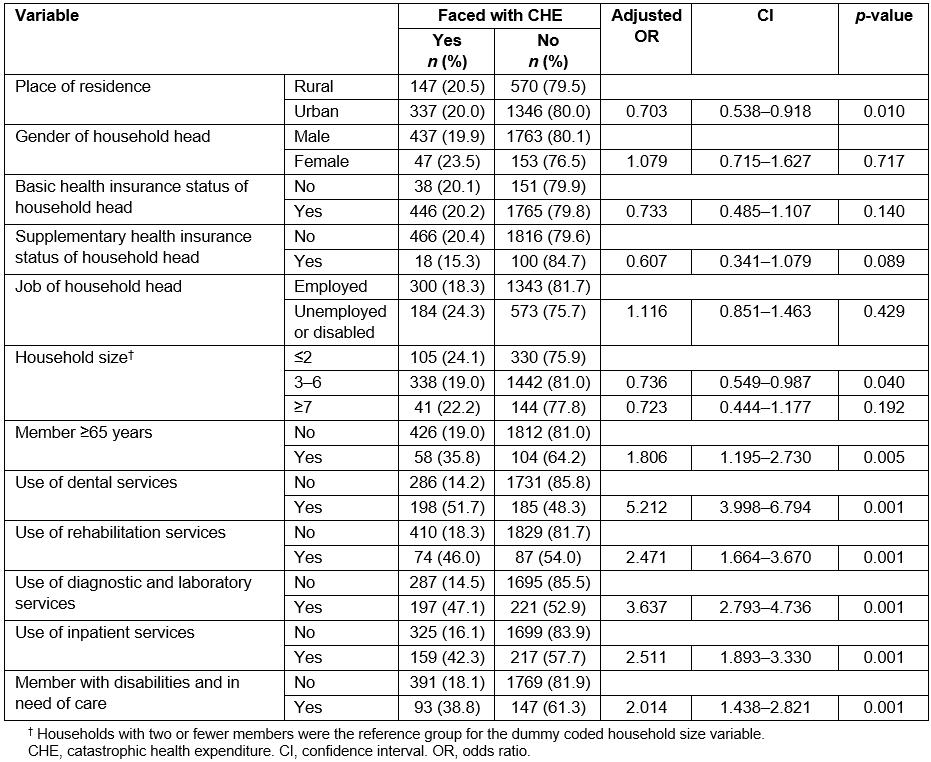
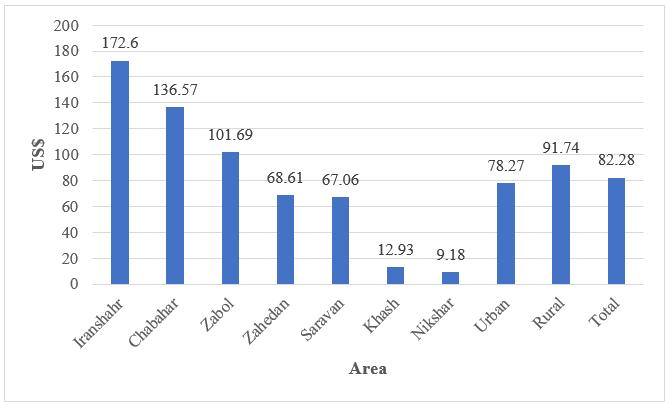 Figure 1: Mean out-of-pocket health expenditure among study participants in Sistan-Baluchistan Province in 2017.
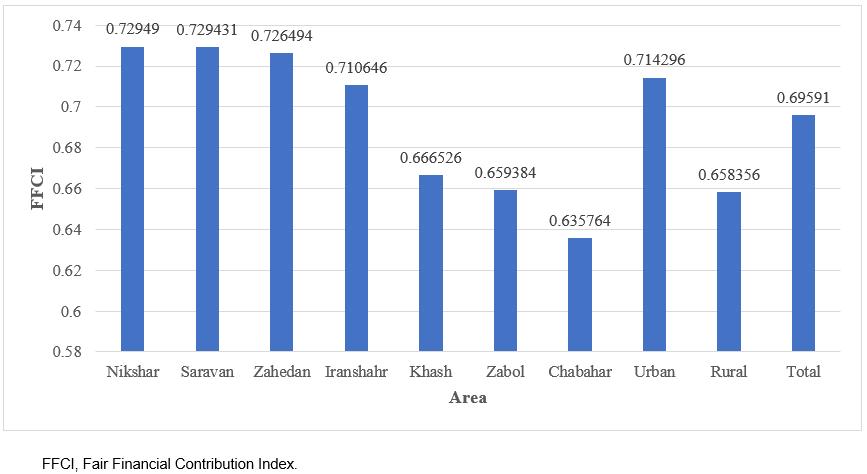 Figure 2: Fair Financial Contribution Index among study participants in Sistan-Baluchistan Province in 2017.
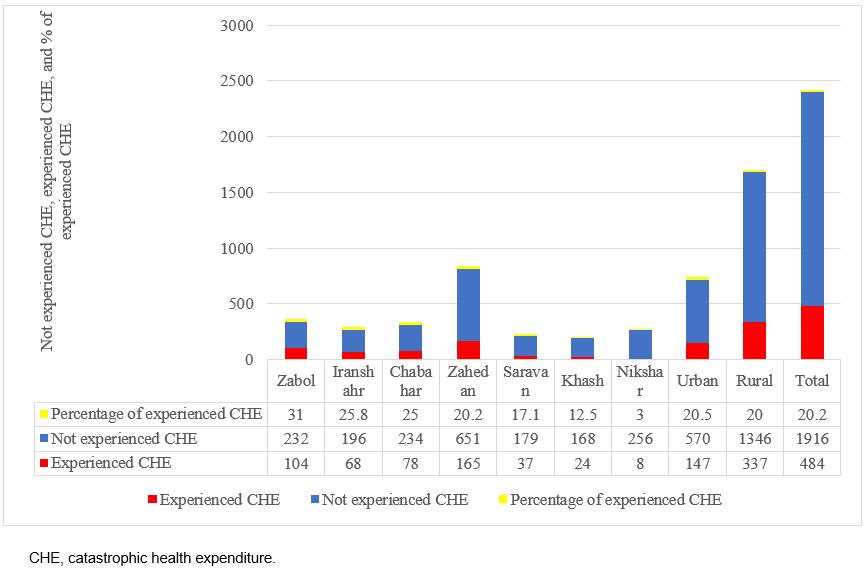 Figure 3: Rate of facing catastrophic health expenditure among study participants in Sistan-Baluchistan Province in 2017.
Discussion
Healthcare costs can be a major barrier to healthcare access for households. In all communities, part of the household income is spent on healthcare expenses. The amount of this contribution and its distribution across the community represent health financial burden or its lack thereof. Achieving fair financial contribution and eliminating the risk of facing CHE in households have become major challenges of health systems throughout the world1.
In the present study, the mean OOP healthcare payment was $82.28 (246.28) for all households. This amount was $78.27 (180.01) and $91.74 (356.74) for urban and rural areas. A study conducted by Reshadat et al in Kermanshah after the implementation of the HTP showed that the mean OOP health expenditure was $2421. The results of another study conducted by Moradi et al. after the implementation of the HTP found this amount to be $39 among households with members with special diseases facing CHE28. These figures are lower than those reported in a study in Tehran before the implementation of the HTP29. In addition, a study conducted by Somkotra and Lagrada in Thailand showed a reduction in OOP payments after universal healthcare coverage reforms30. OOP healthcare payment disparities between cities can be due to the ability of households to pay, so poorer households can afford less OOP healthcare payments and may be reluctant to use healthcare services. The results showed that the lowest mean OOP healthcare payment, $9.18 (29.65), was obtained in Nikshahr, one of the most deprived cities in the province.
Based on the WHO definition of CHE, 20.2% of the households in Sistan-Baluchistan Province were faced with CHE after the implementation of the HTP. This high rate of CHE shows that Iran is still a long way from achieving the goals of the HTP and the Fifth Economic, Social and Cultural Development Plan for reducing the percentage of households facing CHE in this province. Meanwhile, similar regional studies carried out after the implementation of the HTP showed a decrease in the rate of CHE in Iran; for example, Piroozi et al in Kurdistan Province22 and Homaie Rad et al14 in Guilan Province found reductions of 4.8% and 3.82%, respectively, in this rate. The results of a study by Reshadat et al showed that about 4.8% of households with hospitalized patients are faced with CHE in Kermanshah21. In a study by Limwattananon et al, the rate of CHE for households using inpatient care was shown to have decreased from 31.0% in 2000 to 14.6% in 2004 after the universal healthcare coverage reform in Thailand31. A study by Yardim et al in Turkey showed a decreasing trend in households facing CHE after the health reform plan of 2003–2009: from 0.75% in 2003 to 0.59% in 2006 and 0.48% in 200932.
There are several possible explanations for the high rate of CHE in Sistan-Baluchistan Province even after the implementation of the HTP. The first reason is the lower level of development and social and economic welfare in this province compared to other provinces of the country, as this province is culturally, socially, climatically and economically quite different from the rest of the country. The rate of households facing CHE was therefore naturally expected to be higher in this province compared to the national average. The second reason is that the HTP is mainly focused on reducing the OOP payments for inpatient healthcare services at healthcare centers affiliated to the MoHME, and the plan does not adequately cover outpatient healthcare services or healthcare services in the private sector. The third reason is that, with the increase in medical tariffs in the third phase of the HTP, the monetary value of the tariffs has increased significantly, especially in the private sector.
In the present study, the FFCI of the households was approximately 0.7. The index was about 0.66 and 0.71 in rural and urban areas, respectively. In other words, the distribution of healthcare expenditures is slightly worse in rural compared to urban households. According to the study conducted by Fazaeli et al using the expenditure–income data of households, derived from a 2012 survey by the SCI, the index was 0.82 and 0.85 in rural and urban areas, respectively33. Another study by Fazaeli et al showed that, in Iran, the FFCI decreased from 0.841 in 2003 to about 0.827 in 2010 (ie over approximately an 8-year period)34. Studies conducted in Tehran (2012) and Kermanshah (2008) have shown FFCI values of 0.62 and 0.57, respectively35,36. Similar studies have shown higher FFCI values in urban areas33-35. The calculation of the index in different countries in 2003 showed variations from 0.941 in Slovakia to 0.68 in Georgia25,37. A 2000 WHO report estimated the average global FFCI as around 0.57, and the Islamic Republic of Iran was ranked 112th in the world in this report1. Similar to issues related to the CHE occurrence, issues related to fairness in health financing are closely linked to poverty, the use of healthcare services, fragmentation in the pooling of health insurance funds and the lack of adequate insurance coverage for outpatient health services in the public sector and healthcare services in the private sector.
The likelihood of facing CHE was higher for households located in rural areas than for those in urban areas. This finding has already been confirmed by other studies24,28,38-41. Since rural households have low access to some healthcare services such as hospital care, they have to travel to urban areas and pay more for receiving these services. The lower accessibility and CTP of rural households cause a failure in receiving proper healthcare services, and the patients’ disease may thus progress and they may eventually require more expensive treatments.
Based on these findings, households that used dental and rehabilitation services faced CHE 5.212 and 2.471 times more than others, respectively, consistent with the results of some other studies22,24,26,28. Since dental and rehabilitation services are among the most expensive healthcare services in the country and are not adequately covered by basic health insurance plans, households should pay OOP to use them.
The present findings demonstrate that the use of inpatient services increases the likelihood of exposure to CHE by about 2.511 times. Most studies that have considered this factor confirm this finding22,24,28,41-43. Despite the implementation of the HTP and the significant reduction in the share of hospitalized patients to 3% (rural) and 6% (urban) of the hospital bill, the monetary value of OOP payments, especially in the private sector, has increased due to the increased medical tariffs. Households’ increased use of inpatient services in healthcare centers affiliated to the MoHME may be another cause. It is possible for these deductibles to lead households to CHE.
According to the results, having members with disabilities and in need of care or members aged more than 65 years in the household are factors that increase the likelihood of CHE. This finding has been confirmed in similar studies22,24,26,28,38,39,43. The presence of elderly people and those in need of care make households pay more than their CTP for healthcare services due to their greater use of healthcare services along with their lower income and smaller number of employable household members. Moradi et al found that, despite the implementation of the HTP, the percentage of CHE is still high for households with members who have special diseases28. Basic health insurance packages need to be amended and more cost-sharing exemptions should be granted to provide better financial protection for the more vulnerable households.
Based on the findings of this study, households that used diagnostic and laboratory services faced CHE about 3.637 times more than others. The results of a study by Amery et al also showed that the use of diagnostic and laboratory services increases the likelihood of CHE in households44. The HTP needs to further address the challenges of outpatient services such as diagnostic and laboratory services.
This research is the first attempt to measure the household financial contribution to health expenditures in Sistan-Baluchistan Province of Iran and is one of the few studies conducted on this subject after the implementation of the HTP in the country. Future studies should investigate the effects of HTP interventions comprehensively and on a national scale.
Limitations of the study
This study was conducted in Sistan-Baluchistan Province and does not represent the financial contribution of households in the entire country to their health expenditures after the implementation of the HTP. Given the lack of studies conducted to measure the household financial contribution to health expenditures in this province before the HTP, there are no points of comparison for assessing the effectiveness of the program on this index. Other limitations of the study include the over- or underreporting of costs and the respondent recall bias, which was partly overcome by reducing the recall period for inpatient and outpatient healthcare services to 1 month and 12 months, respectively.
Conclusion
The large number of households facing CHE in Sistan-Baluchistan Province shows the need for health policymakers and top managers to pay more attention to this region. Although CHE and OOP healthcare payments have reduced in Iran following the implementation of the HTP21,22, they still remain a challenge in poor regions of the country.
According to the findings, there should be emphasis on intersectoral policies to improve the economic situation of households in this impoverished region, premium exemption schemes for poor households in prepayment mechanisms, encouraging preventive behavior, promoting health knowledge of the households, and revising basic services package coverage of health insurance organizations. Health policymakers should pay more attention to rural areas and allocate their healthcare resources fairly among the different areas of this region. The HTP should cover the expenses of outpatient healthcare services in an adequate manner.
Acknowledgements
The authors would like to thank the residents of Sistan-Baluchistan Province for their participation in this study. The research was financially supported by the Health Promotion Research Center of Zahedan University of Medical Sciences.