Introduction
The older adult US population is expected to nearly double in the next 30 years, from 43.1 million to an estimated 83.7 million by 20501. As the older adult population increases and modern medical treatments improve, there is also a skew of older adults towards the ‘oldest old’2. With these population changes, more individuals will require physical or cognitive support.
Currently, 17.7 million individuals in the USA provide care to family members aged 65 years or older2,3. The economic value of services that unpaid caregivers provide to older adults is around $375 billion yearly, double what is spent on homecare or nursing home services4. Although the aging process itself does not guarantee the need for assistance in daily activities, co-morbidities and disease processes of older adults make it much more likely. For example, 58.5% of older persons aged 85–89 years receive family caregiver help due to health or functional limitations while 76% of adults aged over 90 years require assistance5. The demand for caregivers will likely increase with the increase in the oldest old population2,5.
Further, the caregiver experience differs by geographic location. Studies have demonstrated that rural caregivers have more financial barriers than their urban counterparts (38.1% v 31%) and worse self-reported health status. However, they are less likely to report depression, caregiving burden, or difficulty in care6-9. These are important differences to investigate because rural regions have a disproportionate representation of older adults. In the rural USA, 17.5% of residents are 65 years or older compared to only 13.9% in urban areas. Rural counties make up 85% of the 1104 older-age counties10.
The present study leverages the National Study of Caregiving (NSOC) and the associated linked National Health and Aging Trends Study (NHATS) to provide the largest national study to date to examine differences between rural and urban residing caregivers. The dataset includes both longitudinal data as well as data focused on specific moments in time. The most recent time point was chosen as the focus of the analyses and therefore a cross-sectional descriptive analysis was used for this study. Variables were chosen based on previously identified factors that differed between rural and urban caregivers as well as variables proposed to influence caregiver burden6-9,11. Such variables included demographics, competing work responsibilities, support, health, caregiver burden, and interaction with healthcare professionals12,13.
Methods
Data
This study leveraged publicly available data from the 2017 National Study of Caregiving Study Round III and the associated National Health and Aging Trends Study Round 8, a survey based dataset collected in 2017. A linked Metro-Nonmetro Indicator file was used for this analysis to characterize rural versus urban residence. NHATS is sponsored by the National Institute on Aging (grant number NIA U01AG32947) and was conducted by the Johns Hopkins University12,13.
The NHATS study includes a comprehensive interview of Medicare enrollees aged 65 years or more, living in the contiguous USA. The NSOC study includes telephone interviews conducted on family or unpaid helpers to participants from the NHATS who required assistance with self-care, mobility, or household activities. The two datasets are linked by a unique care recipient numerical ID. Caregivers were initially identified from NHATS Round 1 (2011) with a 68.1% unweighted response rate. At a 6-year follow-up (NSOC Round 3, 2017), 2652 caregivers were interviewed, corresponding with 1697 care recipients. Of these, 2278 care recipients had annotations for residential location. Therefore, 2278 caregivers, corresponding with 1431 care recipients, were used for this study and were connected across the datasets with a unique care recipient identification number. The 2017 survey data were chosen for a cross-sectional analysis in this study. Weights to adjust for caregiver non-response and sampling selection were already calculated and provided within the NSOC dataset12. All analyses were performed with these weighted values.
Variables
Caregivers were characterized based on the care recipient’s geographic location: metropolitan or non-metropolitan. Metropolitan residence included counties in metropolitan areas of fewer than 250 000, counties in metropolitan areas of 250 000 – 1 million in population, and those over 1 million in size. These categories corresponded with the 2013 Rural–Urban Continuum Codes (RUCC) of 1–314. Non-metropolitan caregivers included non-metropolitan rural areas with a population of up to 19 999 individuals either adjacent or not adjacent to a metropolitan area, urban population of 2500 to 19 999 either adjacent or not adjacent to a metropolitan area, and non-metropolitan urban populations of 20 000 or more adjacent or not to a metropolitan area. These had corresponding RUCC codes of 4–912,13.
Caregiver characteristics and responsibilities identified from the NSOC data included demographics, information on primary job responsibilities, caregiver assistance and resources, caregiver burden, distance to recipient home, health, and interaction with healthcare providers. Care recipient characteristics included functional status and whether the person was housebound.
Caregiver demographics included age (year of NSOC study subtracted from date of birth listed), gender, race, education, household size, partner in household, and income. Relationship to care recipient was classified as spouse, child (daughter, son, daughter-in-law, or son-in-law), parent, other relative (sister, brother, sister-in-law, brother-in-law, grandchild, niece/nephew, uncle/aunt, cousin, stepchild, or step grandchild), or non-relative. Caregiver’s current work status included whether they had a paying job, missed work for caregiving, caregiving affected their work, they carried more than one job, and whether the unpaid caregiver also had paid in-home care.
Caregiving resources were evaluated based on whether they looked for assistance, received training, or attended a caregiving support group. Caregiver burden was evaluated through binary self-reported difficulty with finances, emotional difficulty, or physical difficulty with caregiving. Caregiver depression was determined via Patient Health Questionnaire 2 (PHQ-2) (score of ≥3 scored positive for depression). Similarly anxiety was evaluated using General Anxiety Disorder Anxiety Test Questionnaire 2 (GAD-2) (score of ≥3 scored positive for anxiety)15. These scoring methods are widely used and have established validity and reliability. A GAD-2 cut-off score of 3 or more has been demonstrated to have a sensitivity of 0.76 and specificity of 0.81 for anxiety, while a PHQ-2 cut-off score of 3 or more has a sensitivity and specificity of 0.83 and 0.92 respectively for major depression16,17.
Caregivers were asked to evaluate the effect of caregiving on valued activities including visiting family or friends, attending religious service, participating in group activity, going out for enjoyment, working, volunteering, and providing care. If at least one of these variables was positive, then caregiving was reported to have had an impact on desired activities.
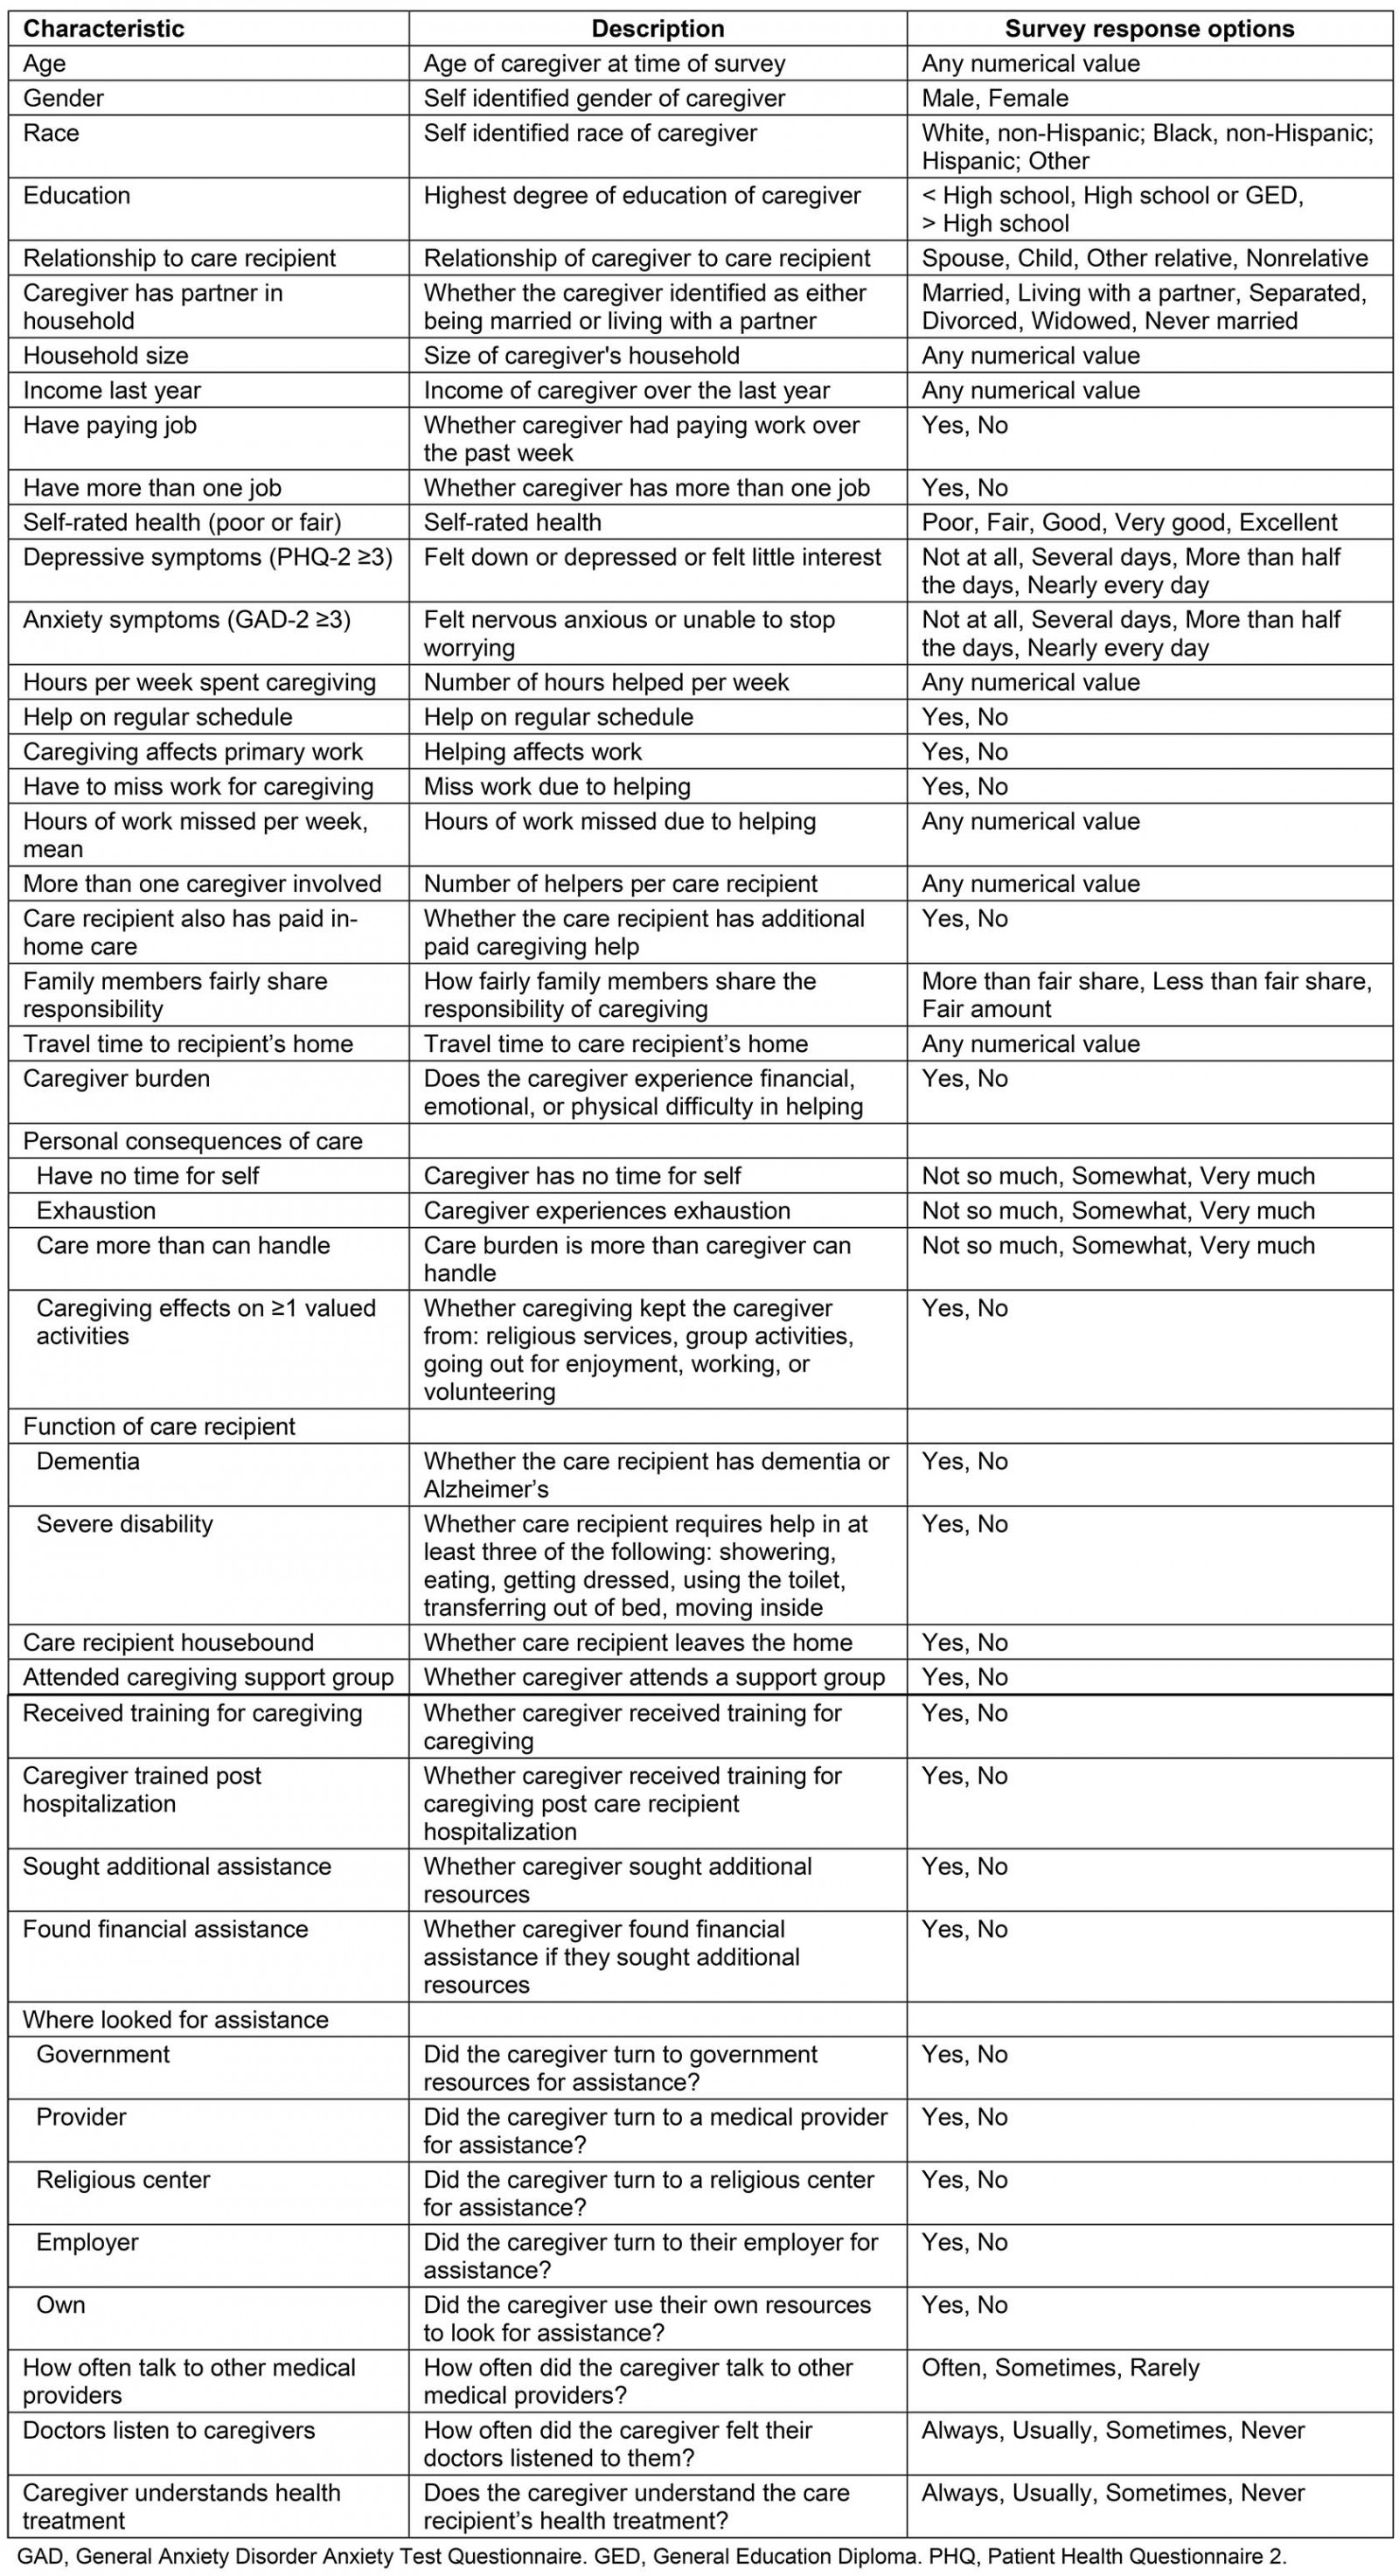
Care recipient characteristics were derived from the NHATS dataset. Functional status was evaluated via Riffin et al 2019, which used a composite of disability with dementia to determine overall function11. Dementia status was predefined within the NHATS dataset based on report by the sample person or proxy that a doctor had diagnosed him/her with dementia or Alzheimer’s; a score indicating probable dementia on the AD8 Dementia Screening Interview; or in scoring on cognitive tests that evaluated for memory, orientation, and executive function18. Disability was determined if the care recipient required assistance with three or more basic activities of daily living including bathing, eating, dressing, toileting, transferring, and indoor mobility. A summary of these investigated variables is included in Supplementary table 1.
Supplementary table 1: Summary of investigated variables
Statistical analysis
Given the binary RUCC geographic classification of the data, bivariate analyses were performed on all listed variables to detect statistical significance between each feature and site of residence, with alpha equal to 0.05. Categorical variables were tested with a χ2 test of independence and Welch’s t-test was used for continuous variables due to unequal population sizes. Benjamini–Hochberg correction was used to adjust the p-values for multiple hypothesis testing. Multivariable regression was performed on the related significant features from the bivariate analysis (p<0.05) in addition to age and sex in combination with rural status to assess for combined impact on caregiver burden (defined as financial, emotional, or physical burden) and caregiver health status. All analyses used weighted values as defined within the original NCOS survey to account for non-survey response and sampling bias. Within each variable, the caregivers without a response were excluded. Analyses were performed using R v.3.6.1 (R Foundation; https://www.r-project.org) and the ‘survey’ R package v4.0 (R Foundation; http://r-survey.r-forge.r-project.org/survey).
Ethics approval
The NHATs and NSOC data are publicly available data and do not contain identifiable personal health information. This study was deemed exempt from institutional review by Oregon Health & Science University Institutional Review Board.
Results
From 2278 caregivers, 1849 cared for older adults in metropolitan regions while 429 cared for those in non-metropolitan areas. These corresponded to weighted N values of 17 191 181 and 3 718 904 respectively. Caregiver age and gender were not statistically different between geographic locations. The mean age was 57.3 years in metropolitan and 54.5 years in non-metropolitan regions, and across residences caregivers were predominantly female (64.4% in metropolitan regions and 63.6% in non-metropolitan) (Table 1). The relationship of caregivers to their care recipients showed no statistically significant difference between geographic regions, with 52.5% (9 030 948/17 191 181) and 44.9% (1 671 476/3 718 904) of caregivers being a child (or stepchild) of the care recipient in urban versus rural settings respectively (p>0.05). There were no statistically significant differences in race, education, household size, whether the caregiver had a paying job, had more than one job, and in self-rated health, depressive and anxiety symptoms.
Mean income and whether there was a partner in the household were significantly different between geographic sites (p<0.05). Mean income was significantly greater in metropolitan regions, at $69,881 (standard error $3545) compared to $53,464 (standard error $2887). Further, only 53.2% were partnered in metropolitan regions compared with 63.1% in non-metropolitan regions (p<0.05) (Table 1).
There were no significant differences in caregiving responsibilities between metropolitan and non-metropolitan caregivers. These included hours per week spent caregiving, number of caregivers, and other family involvement. Non-metropolitan caregivers did miss less work than metropolitan caregivers (16.3% v 35.0% respectively) and had a significantly shorter travel time to provide care (12.8% at 11–30 minutes v 21.1%) (Table 2).
There were no differences in self-rated caregiver burden financially, emotionally, or physically. No significant differences were observed in having time for self, exhaustion, the feeling of caregiving being more than he/she could handle, or effect on valued activities (Table 2).
There were no significant metropolitan–non-metropolitan differences in the availability or utilization of caregiving resources. A total of 3.3% of metropolitan caregivers attended caregiving support groups compared with 3.2% of non-metropolitan caregivers (p=0.99). The distribution of locations where caregivers sought assistance between government, providers, religious centers, or employers was even between geographic locations. Metropolitan caregivers did additionally seek out resources on their own beyond those previously listed (79.8% v 37.9%, p<0.05) (Table 3).
Caregivers’ geographic location did not impact their relationships with medical providers. The majority of caregivers felt that doctors always listened to them irrespective of location (67.6% and 75.6% in metropolitan and non-metropolitan respectively, p=0.37). More than half of caregivers claimed that they always understood the care recipient’s health treatment (53.8% and 55.9% in metropolitan and non-metropolitan areas, respectively) (Table 3).
Significant features that differed between rural and urban settings in addition to age and sex were included in a multivariable regression model to account for their impact on overall caregiver burden and caregiver health. These variables included caregiver income, whether the caregiver was partnered, and distance to care recipient’s home. There remained no significant impact of geographic residence on caregiver burden (financial, emotional, or physical burden) (odds ratio 0.81–1.04). Further, there was no significant association between geographic location and caregiver health status (odds ratio 0.89–1.05) (Table 4).
Table 1: Caregiver demographics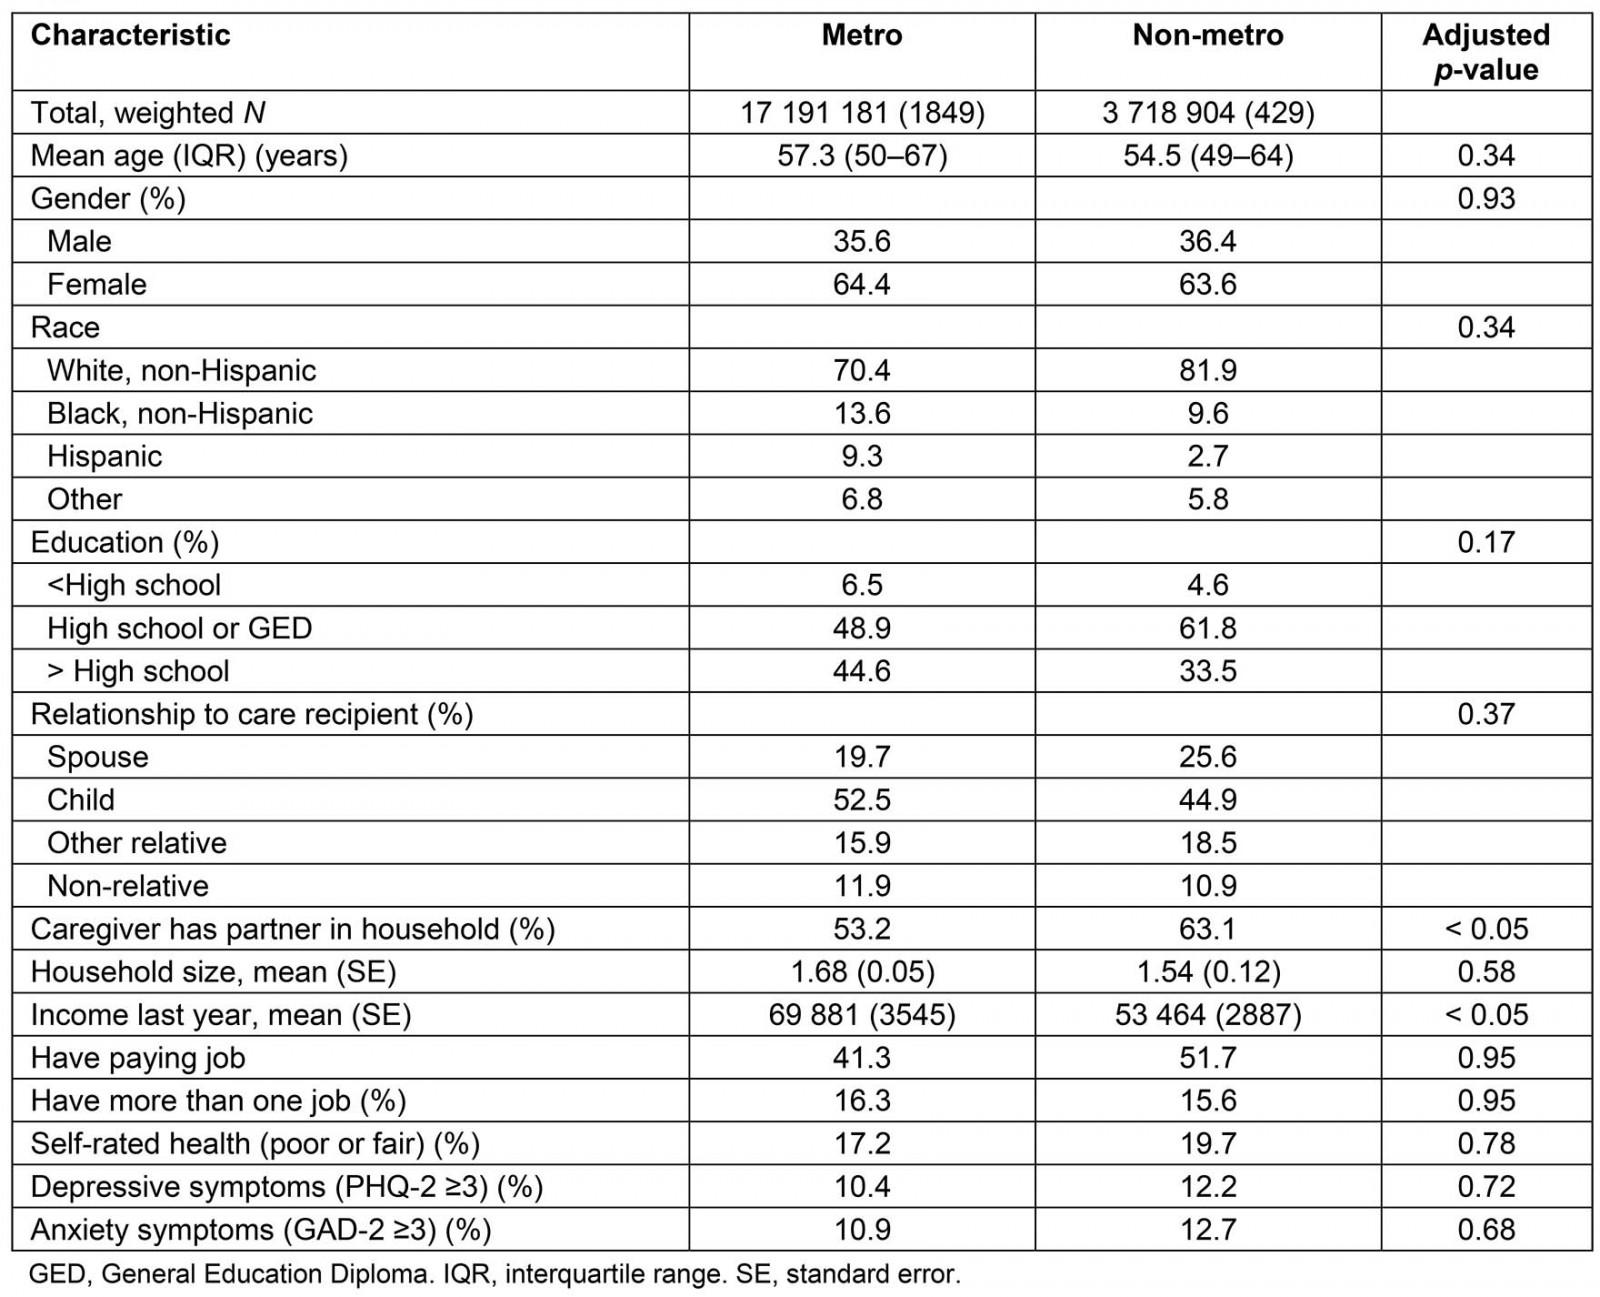
Table 2: Caregiving responsibilities and burden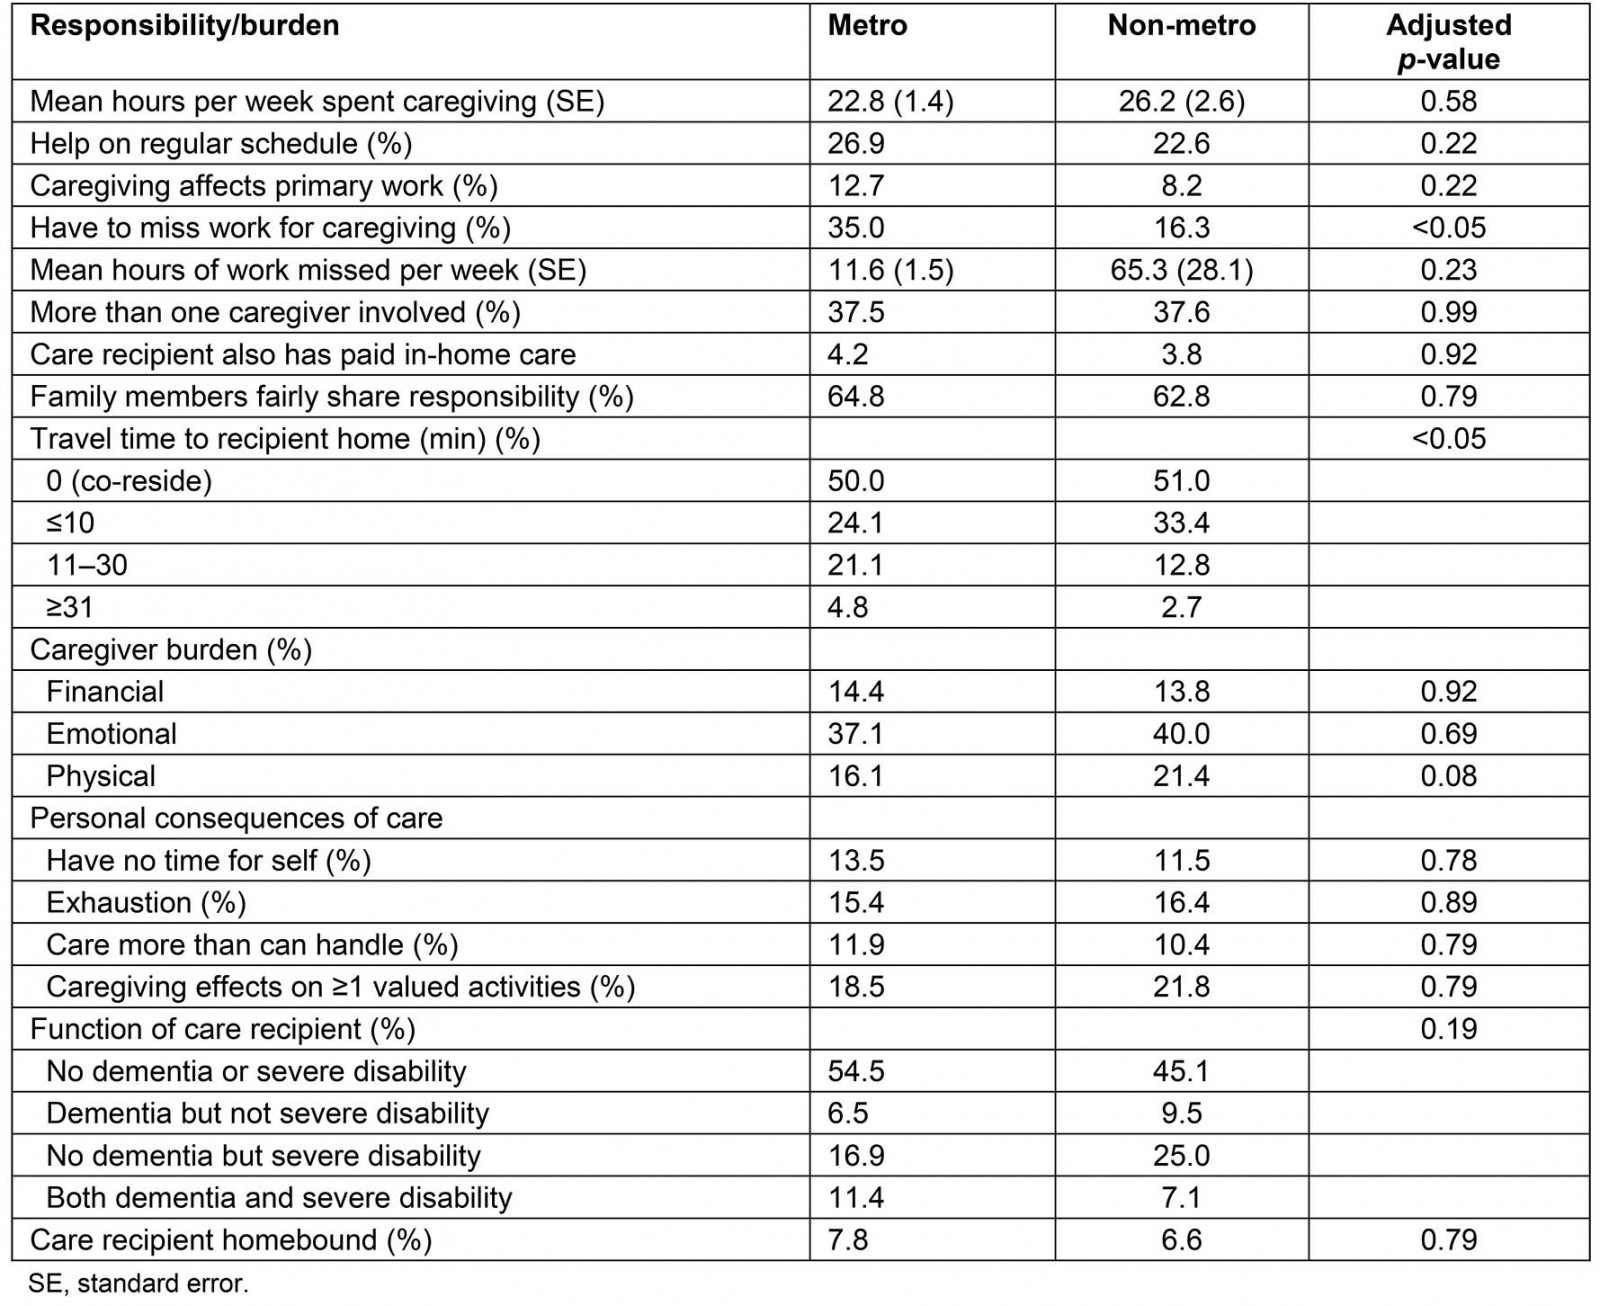
Table 3: Caregiving resources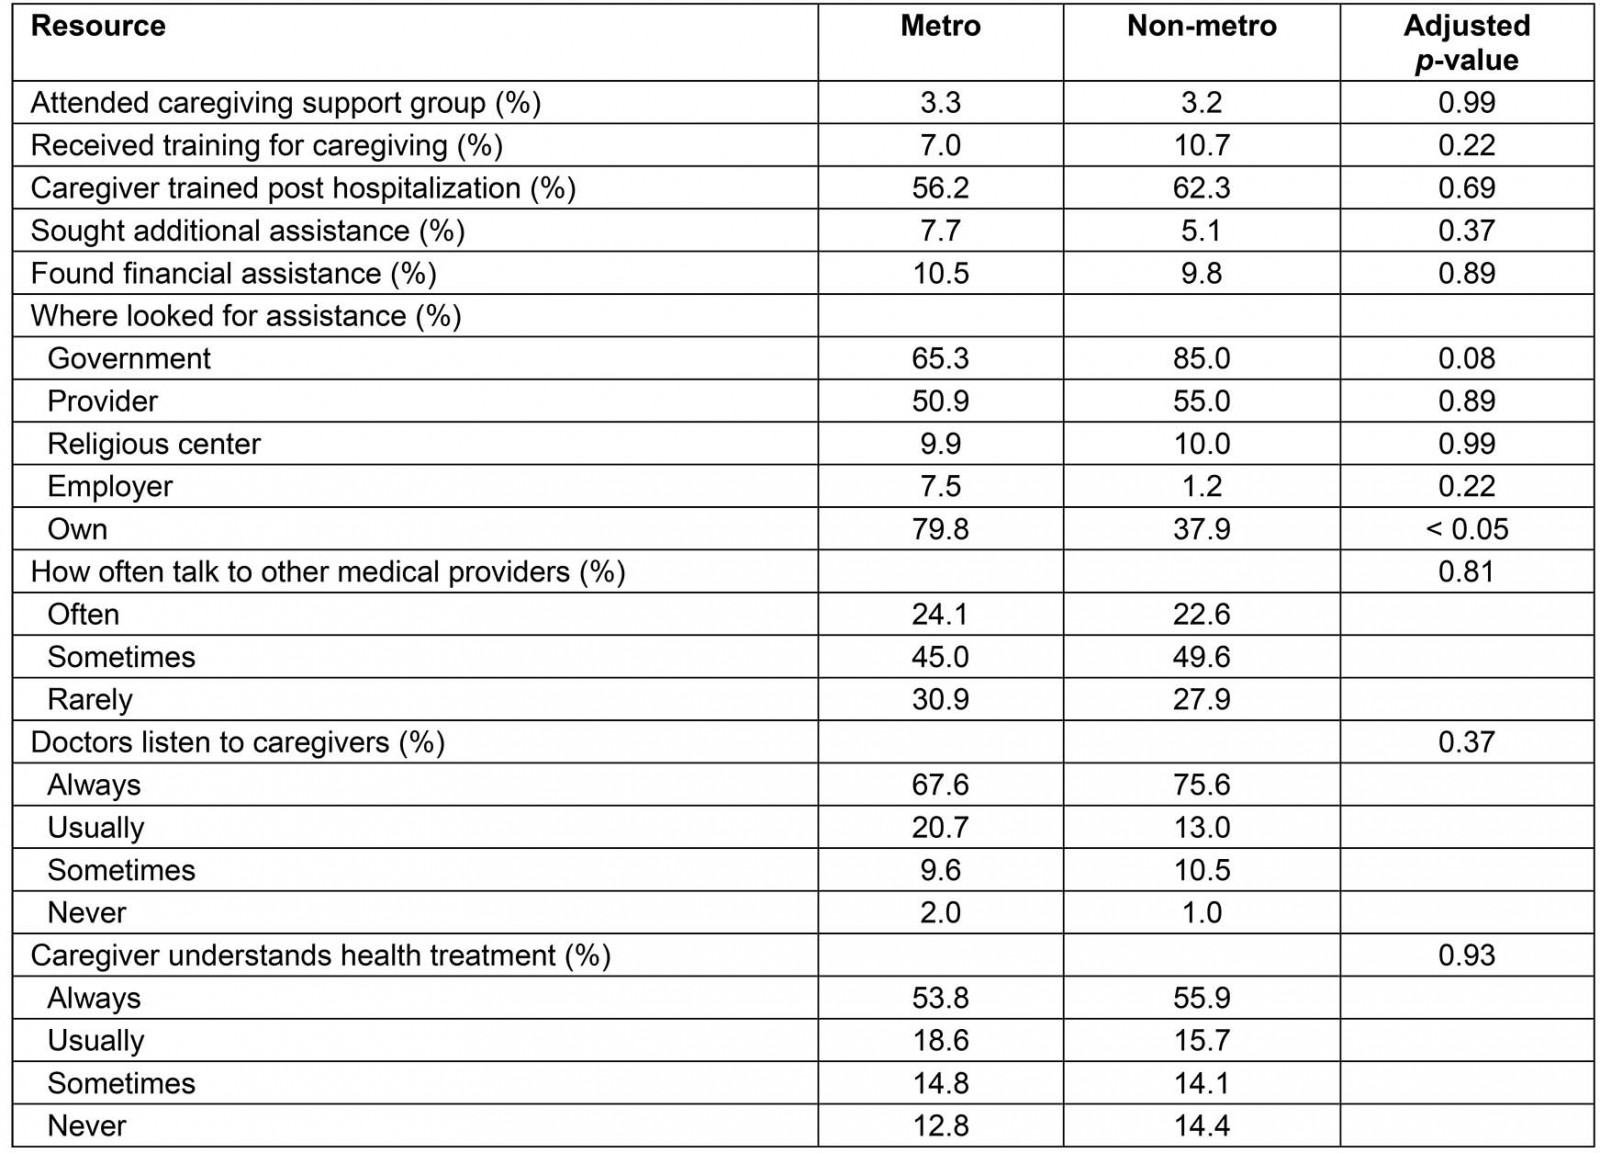
Table 4: Multivariable regression analysis for caregiver burden and health status†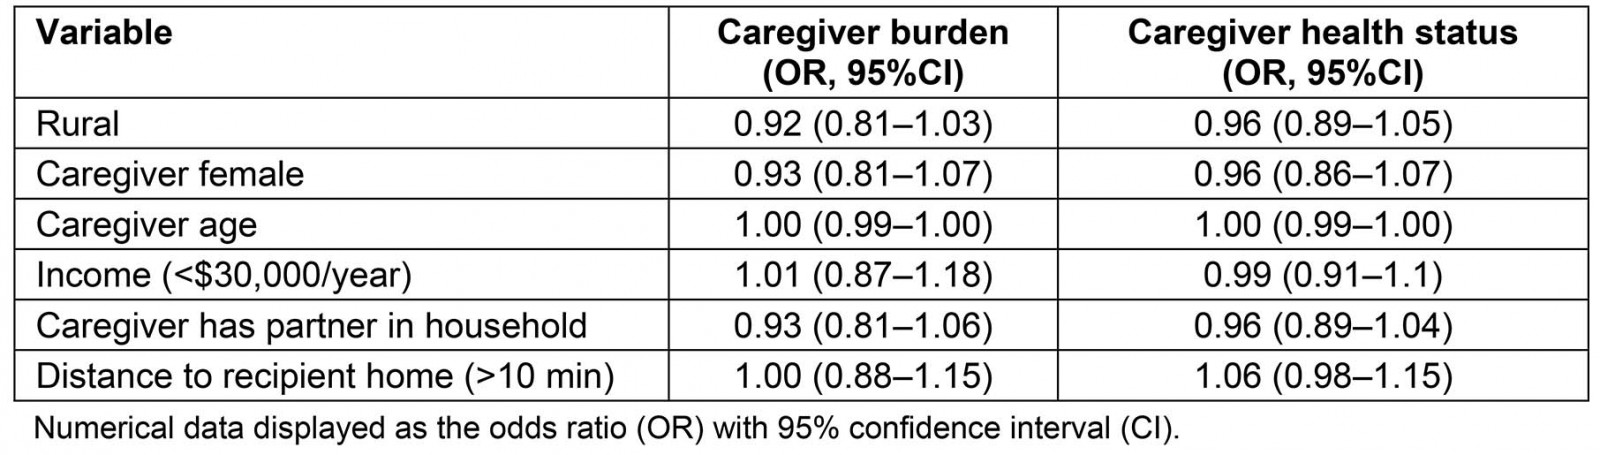
This study leveraged a national survey of family and other unpaid caregivers of older adults and found that non-metropolitan caregivers had a lower income, traveled less time to care for their care-recipients, missed less work, and were more likely to have a partner at home than their metropolitan counterparts. Surprisingly, many other factors were similar across caregivers, irrespective of residence. There were no significant differences in relationship to caregiver, financial assistance, resource utilization or access, caregiver burden, relationship with primary care providers, or self-rated caregiver health. Further, in a multivariable regression analysis accounting for the differences between urban and rural settings, rural status remained non-significantly associated with caregiver burden or self-rated caregiver health.
Discussion
This study is one of the largest national investigations to date to look at caregiving differences by geographical setting. The results confirm the results of previous reports in suggesting no differences in caregiver burden between rural and urban areas despite socioeconomic disparities, with some studies even supporting a protective factor of rural residence. A 2017 study leveraging the ‘Caregiving in the U.S. 2015’ National Alliance for Caregiving and American Association of Retired Persons survey showed rural caregivers had lower socioeconomic status than their urban counterparts and did not demonstrate a difference in physical, financial, or emotional burden of caregiving9. A larger study from 10 states identified that rural caregivers frequently had greater financial barriers than urban caregivers and were less likely to report any difficulty related to caregiving6. A focused study of Pittsburgh caregivers similarly found a protective factor to caregiving8.
Previous studies have hypothesized possible reasons for the lack of caregiver burden despite financial inequalities, including a possible greater perceived generativity in rural populations19, the use of social comparison where caregivers have an emotional benefit by comparing themselves to those less well off, or increased coping mechanisms that may have developed over time to address multiple life stressors. Additionally, rural caregivers may be underreporting burden as they feel a greater responsibility to care for a family member8,20. Finally, although there is an income disparity between metropolitan and non-metropolitan settings, the cost of living is less in rural areas and may buffer some of the disparity21,22.
Additionally, the present research might suggest that the presence of a spouse or partner, regardless of their role in the caregiving process, could be one factor in protecting rural caregivers from burden. Previous research has shown associations of informal social support with lower caregiver burden. However, further investigation would be required to confirm this hypothesis23.
In contrast to previous reports, the present study did not identify significant differences in self-reported health status between geographic residence. Other studies have indicated a higher prevalence of chronic conditions and an increased likelihood of reporting poor or fair health in rural communities, although one study only saw significance in a multivariate model rather than a bivariate model6,8,9,22. Additionally, there are mixed results for significance of self-reported health on perceived health burden6,11. The discrepancy across studies might be due to cohort size, definitions of rural areas, or geographic distributions of sampling. Additional larger studies are necessary to further evaluate the difference.
The NSOC and NHATS studies provide extensive, comprehensive datasets with excellent national representation to create a strong study of caregiver experience. However, the present report has a number of limitations. The publicly available data on residence were restricted to the resolution of ‘metropolitan’ and ‘non-metropolitan’. Future studies would benefit from further subdividing residence by the nine RUCCs to look at more nuanced differences in resource use and caregiver burden, because studies have shown spatial clustering of caregiver features8. That said, within the current dataset, only 429 caregivers were from non-metropolitan regions, thus further stratification of the data could be challenging to provide a sample size with enough participants to conduct detailed subgroup analyses. Further, the NSOC data selected caregivers that helped only with daily tasks, transportation, or medical needs. While comprehensive, it would be interesting to include self-reported caregivers regardless of tasks they perform in order to gain a broader representation of the caregiver experience.
This study demonstrates that, despite economic disparities, caregivers self-report no difference in financial burden between urban–rural settings. Future studies should include additional survey questions to better understand the reasons for this dichotomy. In this way, we might be able to learn from the resilience in the rural populations to improve universal caregiver experience.
Conclusion
This study builds on previous reports to understand geographical differences in the caregiver experience. Leveraging a large national study of 2278 total caregivers (weighted N of around 20 million), this study identified similar caregiver experiences across locations despite disparities in income. However, additional studies that further divide the cohort by population and include larger rural sampling are essential to determine if rural caregivers truly are thriving despite disparities, and, if so, how communities can learn from them to help all caregivers thrive.
References
Supplementary material is available on the live site https://www.rrh.org.au/journal/article/6062/#supplementary