


Introduction
Rural areas around the world have seen a steady decline in population, from 66.4% in 1960 to 44.7% of the world’s population in 20181. Gradually, people have moved to cities in search of better opportunities to live because they offer more in terms of health, education, work, recreation, and security, among others2. In addition, policymakers have focused investment on urban areas, mainly because these areas concentrate large numbers of people3. The definition of a rural area usually includes demographic and morphological criteria4, although a dichotomous definition excludes other concepts such as functional (agriculture, natural resources), political (education, infrastructure, institutional), social (culture, recreation), and aesthetic (perceptions)5. There is no universal definition of a rural area worldwide6, but population density and distance to the nearest city or urban area are often used in the definition7,8. For example, the USA defines rural areas as those with a population density of less than 289 inhabitants/km2, the European Union uses 100 inhabitants/km2 and the OECD uses 150 inhabitants/km24.
Regardless of the conditions used to define rural areas, governments must guarantee their population access to basic needs, classified mainly into four components: utilities (water and energy) and food, health, education, and economic aspects (market, livestock, recreation, and jobs)9-11.
Road infrastructure has been fundamental to connect rural areas to basic needs because isolated communities tend to suffer more from poverty and inequality10. Isolated communities are usually far from basic needs. The European Union was the first to realize this situation and initiated a program to improve territorial cohesion in their countries, understood as an ‘equitable distribution of resources and opportunities between regions and their people’12. The development of this program concentrates on rural areas, where people must travel long distances to fulfil basic needs13.
Accessibility has emerged as the central measure for estimating isolation and needs in rural areas because it focuses on the life opportunities open to people14. Accessibility is defined as the opportunity for people to interact through the road network15. Over the years, the concept has been developed by various researchers, with measures such as distance measures16, utility-based measures17, individual accessibility measures18, spatio-temporal measures19,20, gravity measures15,21, and the floating catchment area methods with their derivations: two-step floating catchment area, two-step enhanced floating catchment area and three-step floating catchment area22-24 appearing. Furthermore, the concept has different perspectives that make it particularly useful for policymakers and researchers, being used in topics such as health25, evaluation of new infrastructure18, social equity in transport services26, and coverage of fire station services27, among others.
Rurality, accessibility, and armed conflict: a brief literature review
A brief literature review about the three main topics involved in the research is given here. Research about health and education facilities located in rural areas is presented, especially if it uses accessibility measures as a method and the armed conflict is considered. In the 2000s, three research studies that match the present study’s topics were found geographically located in Africa. In 2001, Tanser et al developed the Distance Usage Index, an accessibility-based index to quantify and understand the access and usage patterns of health facilities in the Hlabisa District in South Africa, a rural zone in the country28. Handa performed a demand/supply analysis in Mozambique in 2002 to measure the impact of rural primary school enrolment. Results showed an increase in enrolment when more schools were built, and adult literacy was raised. Also, differences across genders were identified. The end of the armed conflicts was given as a determinant in Mozambique’s school construction29. Murawski and Church (2009) developed the Maximal Covering Network Improvement Problem model to measure the improvement in the accessibility to health facilities in Ghana when the transport network was upgraded30.
Salazar et al (2013) found strong differences in poverty between urban and rural areas in the Bío-Bío region of Chile. The researchers used four variables: labour occupation, population density, low-income households, and travel time to major cities (a measure based on accessibility and infrastructure)31. In the same year, Matsumoto et al (2013) used a combination of geographical accessibility and variables such as population size and density, and the rate of elderly and agriculture to identify an equitable distribution of health facilities, showing whether rural and remote areas of Hiroshima, Japan, had less access to dialysis facilities3. Djaya Bakri et al (2015) evaluated the integrated rural accessibility planning method to prioritize investment in transport infrastructure in northern Borneo, Indonesia32. The accessibility index was measured through the road network to health, education, market and marketing, and transport facilities in five regencies: Bulungan, Tana, Tidung, Nunukan, and Malinau. Sadoughi et al assessed geographical accessibility to rural health services in Khuzestan province, Iran, (2015) finding distance as the main access challenge33. Subsequently, Tamayo et al (2017) defined an analytical, quantitative, and cross-sectional study to identify differences in inclusive education within rural and urban areas in Chile, detecting that children with disabilities living in rural areas had fewer opportunities for equal education34. Concerning health facilities in the Wa West district of Ghana, Agbenyo et al (2017) combined geographical accessibility with semi-structured interviews to measure accessibility in rural areas35. They found 70% of communities with high accessibility (less than 5 km or 1.5 hours walking time). Ranković, Plazinić and Jović (2018) researched the accessibility of the elderly Serbian population located in rural areas based on household surveys36. They focused on the main facilities for the elderly population, such as food shops, health centers, post offices, and banks. An accessibility indicator was then measured based on the density of the transport network. A higher share of non-motorized modes was observed in areas of high accessibility, while the need to own a car was found to increase in areas of low accessibility.
Recently, researchers studying rural zones and their facilities used accessibility approaches based on spatial analysis. Benevenuto et al (2019) analyzed accessibility to healthcare facilities of low-income families in rural Northeast Brazil, finding that 53.5% of the population live farther than 5 km from the nearest health center37. Jo et al (2020) made a study considering the distribution of dental services in rural and remote areas across Scotland, Wales, and Northern Ireland. Close to 18% of people in remote areas of Scotland and Northern Ireland, and 8% in Wales, live farther than 2.5 km from the nearest dental facility38. In Fryslân, The Netherlands, Christiaanse (2020) examined changes in the distribution of and access to important facilities considering the population migration from rural to urban zones and three kinds of facilities: primary schools, general practitioners, and supermarkets39. Accessibility to healthcare facilities, considering economic cost, was investigated by Moro Visconti et al (2020) in rural areas of Uganda, identifying more than 9 million people (50% of the population) as remote users (travel time of more than 60 minutes)40. Similarly, Verma and Dash (2020) employed geographic accessibility to build spatial coverage of healthcare facilities in the Poonch District, India, considering disruption variables such as armed conflict. When this variable is considered, 90% of villages located in armed conflict zones perceived low accessibility41.
The enhanced two-step floating catchment area method was used by Shah et al (2020) to measure geographic accessibility to primary care providers among elderly people in urban and rural areas of Southwestern Ontario, Canada42. They considered a 30-minute driving time threshold with Gaussian decay function, uncovering an unequal distribution between high-accessibility zones to primary care providers and areas with a high percentage of seniors. Furthermore, the spatial autoregressive model with latent variables was developed by Anekawati et al (2020) to navigate into education quality in Sumanep Regency, Indonesia. They found migration of students seeking a higher education quality and unequal provision for children in rural areas43.
In 2021, some related research has been published with Germany as the study zone. Frank et al (2021) built an optimization model to improve rural accessibility considering mobility hubs, with Heinsberg as a case study44. Neumeier and Kokorsch (2021) evaluated geographic accessibility of rural Germany to supermarkets using GIS tools detecting ‘food deserts’ across the country, where reaching food is more difficult45.
Table 1 shows a summary of the literature review in terms of methods, whether the research covered armed conflict, the facilities studied (jobs, health, education, and food), the scale of analysis and the region, type of country, name of country and continent. Most methods included accessibility measures (eg geographical accessibility, spatial analysis, or the enhanced two-step floating catchment area method). Only two articles mentioned armed conflict as a variable29,41. Moreover, the most frequent analysis related to health facilities. The regional scale prevails over local or national studies, and the study areas are in low- and middle-income countries. Most of the research was conducted in Africa, Asia, or Europe.
The research objective is related to the typology definition and isolation through geographical accessibility considering health and education facilities, and armed conflict. The novelty of this research is the consideration of armed conflict as a variable, and the inclusion of health and education facilities at the same time. Nevertheless, it contributes to the literature on rural and remote areas in Latin America from the perspective of accessibility. The use of the Google Distance Matrix API to calculate travel times is an advance in the methodology of accessibility measures.
Table 1: Summary of brief literature review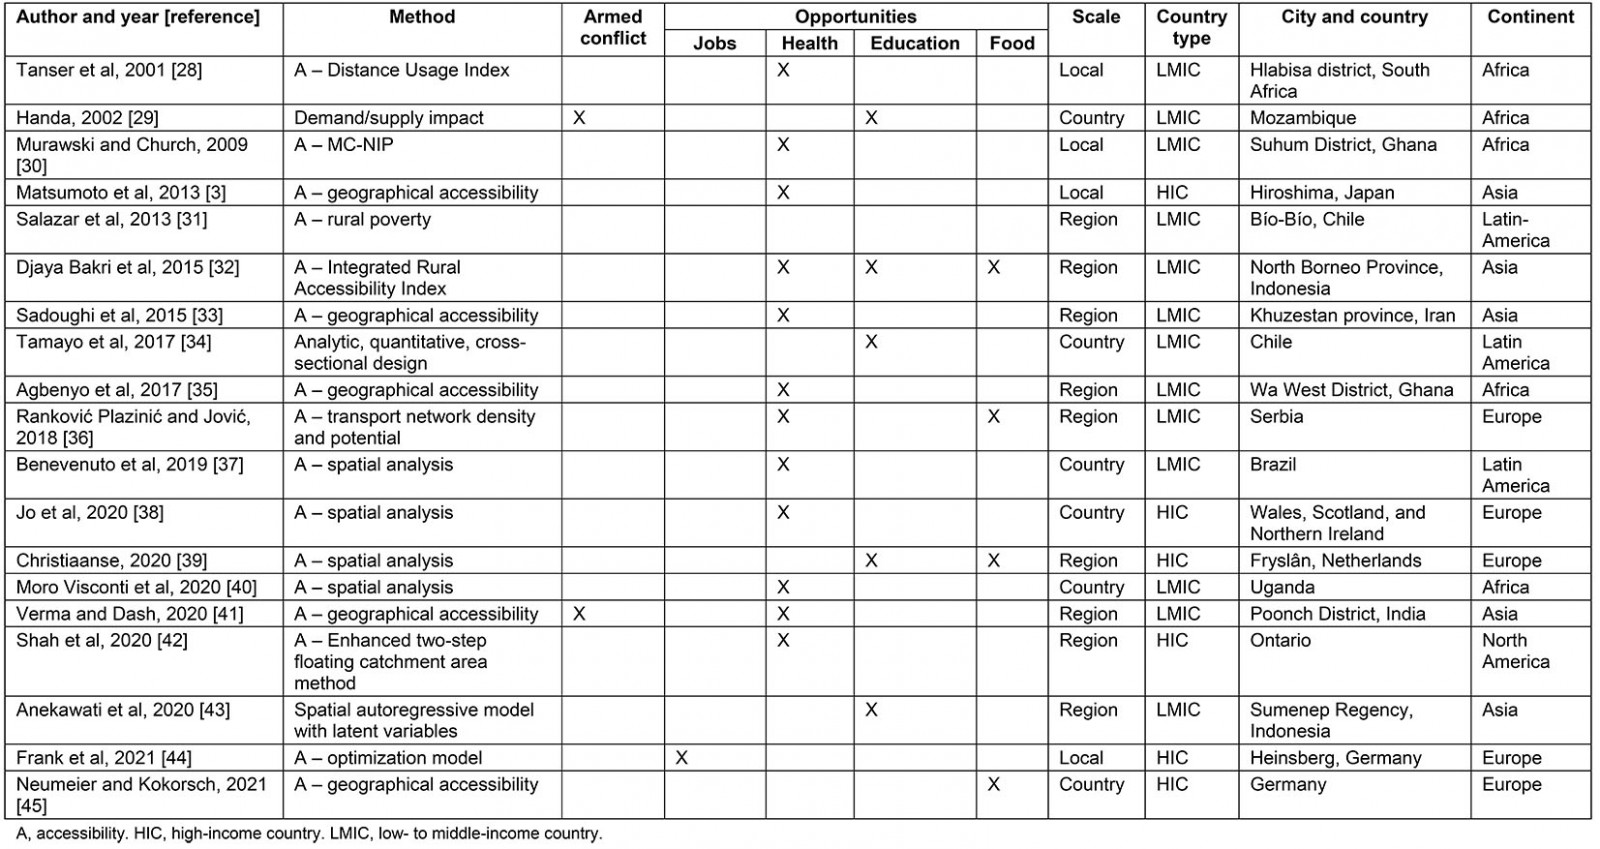
Rurality, accessibility, and armed conflict in Colombia
Rural areas in Colombia have suffered from state neglect over many years, yet some governments have initiated agrarian reforms to connect isolated areas to the country’s development46. The neglect of rural areas was one of the main reasons for the guerrillas to start an armed conflict in the 1960s46. With the peace treaty, signed by the state and the country’s largest armed group (FARC-EP)47,48, the government will initiate a process of investment in rural areas to close the development gap historically accumulated with more than half a century of armed conflict48.
The definition of rurality in Colombia was made by the Departamento Nacional de Planeación (National Planning Department) in 2014 and determined four categories (cities and agglomerations, intermediate, rural, and dispersed rural) according to three variables: rurality among the system of cities, population density, and ratio between the population living in urban areas and the population not living in urban areas49. Colombia had 15.8% (7 624 842 inhabitants) of its total population (48 258 494 inhabitants) in dispersed rural areas, as measured in the census conducted by the Departamento Administrativo Nacional de Estadística (National Administrative Department of Statistics) in 201850.
In 2017, the United Nations Economic Commission for Latin America and the Caribbean (CEPAL) constructed the Territorial Agglomeration Index and rurality categories for the provinces of Colombia. For the index, population density, the province’s population proportion living in the municipal capitals, and the population of the largest municipality were used and, for the rurality categories, travel time from the provinces to the main city by private car on the road network was used10. Here, rural areas represent 81.2% of the area of the national territory and 24.2% of the population.
Related to armed conflict, some indexes per municipality in Colombia have been measured. In 2016, the National Planning Department calculated the Índice de Incidencia del Conflicto Armado (IICA; Index of Incidence of Armed Conflict) according to six variables (armed actions, murder, kidnapping, anti-personal landmines, forced displacement and cocaine cultivation) measured in each municipality of the country for the period 2002–201351. In 2014, the Resource Centre for Conflict Analysis defined six categories for armed conflict typology according to the presence of armed conflict in the municipality (persistent, interrupted, finalized, and without conflict) and intensity (strongly affected and weakly affected)52.
In Colombia, accessibility measures have been used in various areas such as public transport and equity53, health services25 and higher education54; however, most of them have been concentrated in cities and agglomerations such as Bogotá or Manizales. Although some research measures accessibility at the regional level55,56, there is no research related to rural areas in Colombia.
Although rural areas in Colombia are defined, policymakers have not used objective methods to plan their development by considering their basic needs. With the peace treaty, rural areas should have special attention from the government; for this reason, this article proposes a methodology to calculate the isolation of municipalities in Caldas, Colombia based on National Planning Department rurality categories, IICA, and access to health and higher education as basic needs. To measure access to basic needs, travel times between Caldas municipalities are used, calculated using the Google Distance Travel Matrix API57,58. Geographical accessibility of the department is measured, understood as the average travel time from one municipality to another, to determine connectivity through the department’s road infrastructure network58,59. Minimum travel times to health services in each municipality were measured according to the equipment facilities reported by official government entities such as the secretary of education and the Dirección Territorial de Salud de Caldas (Territorial Directorate of Health of Caldas).
Caldas is a department located in the central east of Colombia, with 998 255 inhabitants, 27 municipalities, and 25.8% of the population living in sprawling rural zones50. Manizales, the capital city, concentrates with Villamaría 46.2% (461 094 inhabitants) of the department’s population in their conurbation zone. Manizales supplies a large percentage of basic needs as health, higher education, and recreation (shopping malls) to the rest of the people in the department.
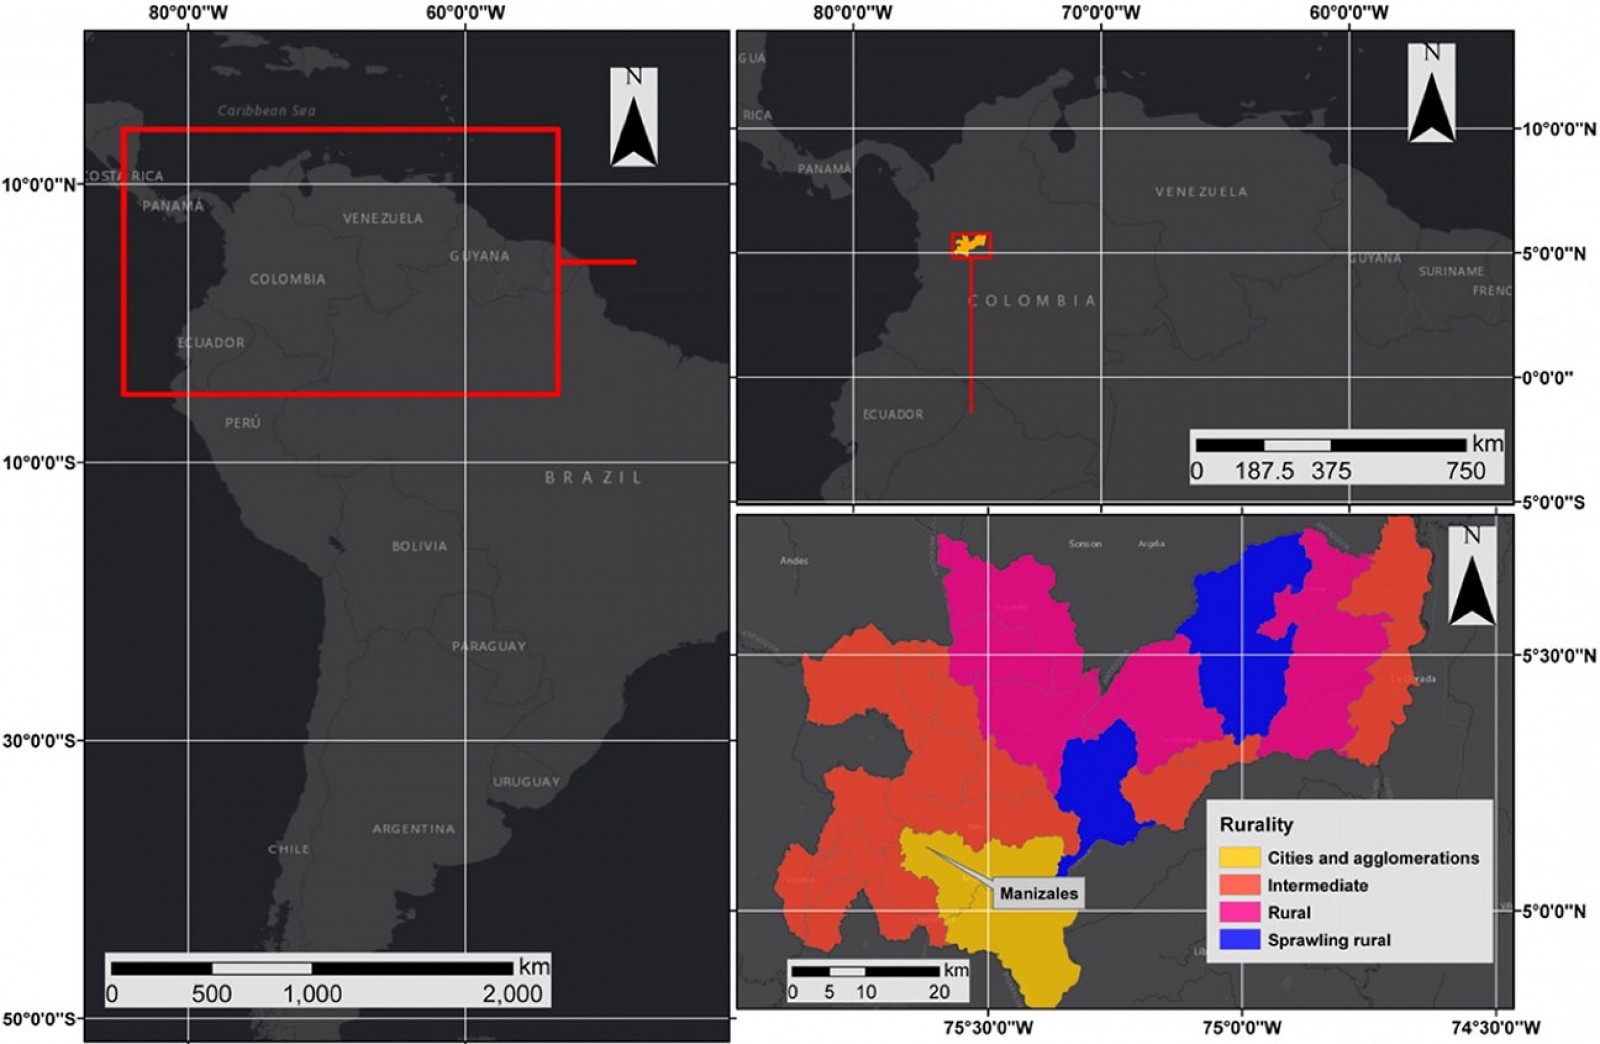 Figure 1: Location of study zone.
Methods
Rural health and education service settings are too sensitive and vary according to geographical and spatial scale. Moreover, the estimated results of geographical accessibility depend on the input data (quality and reliability), the access method, and the geographical area/scale. The research article follows the methodology shown in Figure 2.
Data collection
This research was supported in secondary information collected from Colombian national, official databases: (1) data for geopolitical and administrative division of Caldas department from the Geographic Institute Agustín Codazzi60; (2) IICA categories and scores from the National Planning Department51; (3) rurality categories defined by the National Planning Department50; (4) National Census of Population and Household 2018 data downloaded from the National Administrative Department of Statistics in CSV format50; (5) data on health facilities of Caldas department downloaded in CSV format from Colombia’s open data portal61; (6) data for higher education institutions of Caldas department downloaded in CSV format from the Ministerio de Educación y Formación Profesional (Ministry of Education)62. This information was manipulated using geographic information systems and georeferenced where necessary.
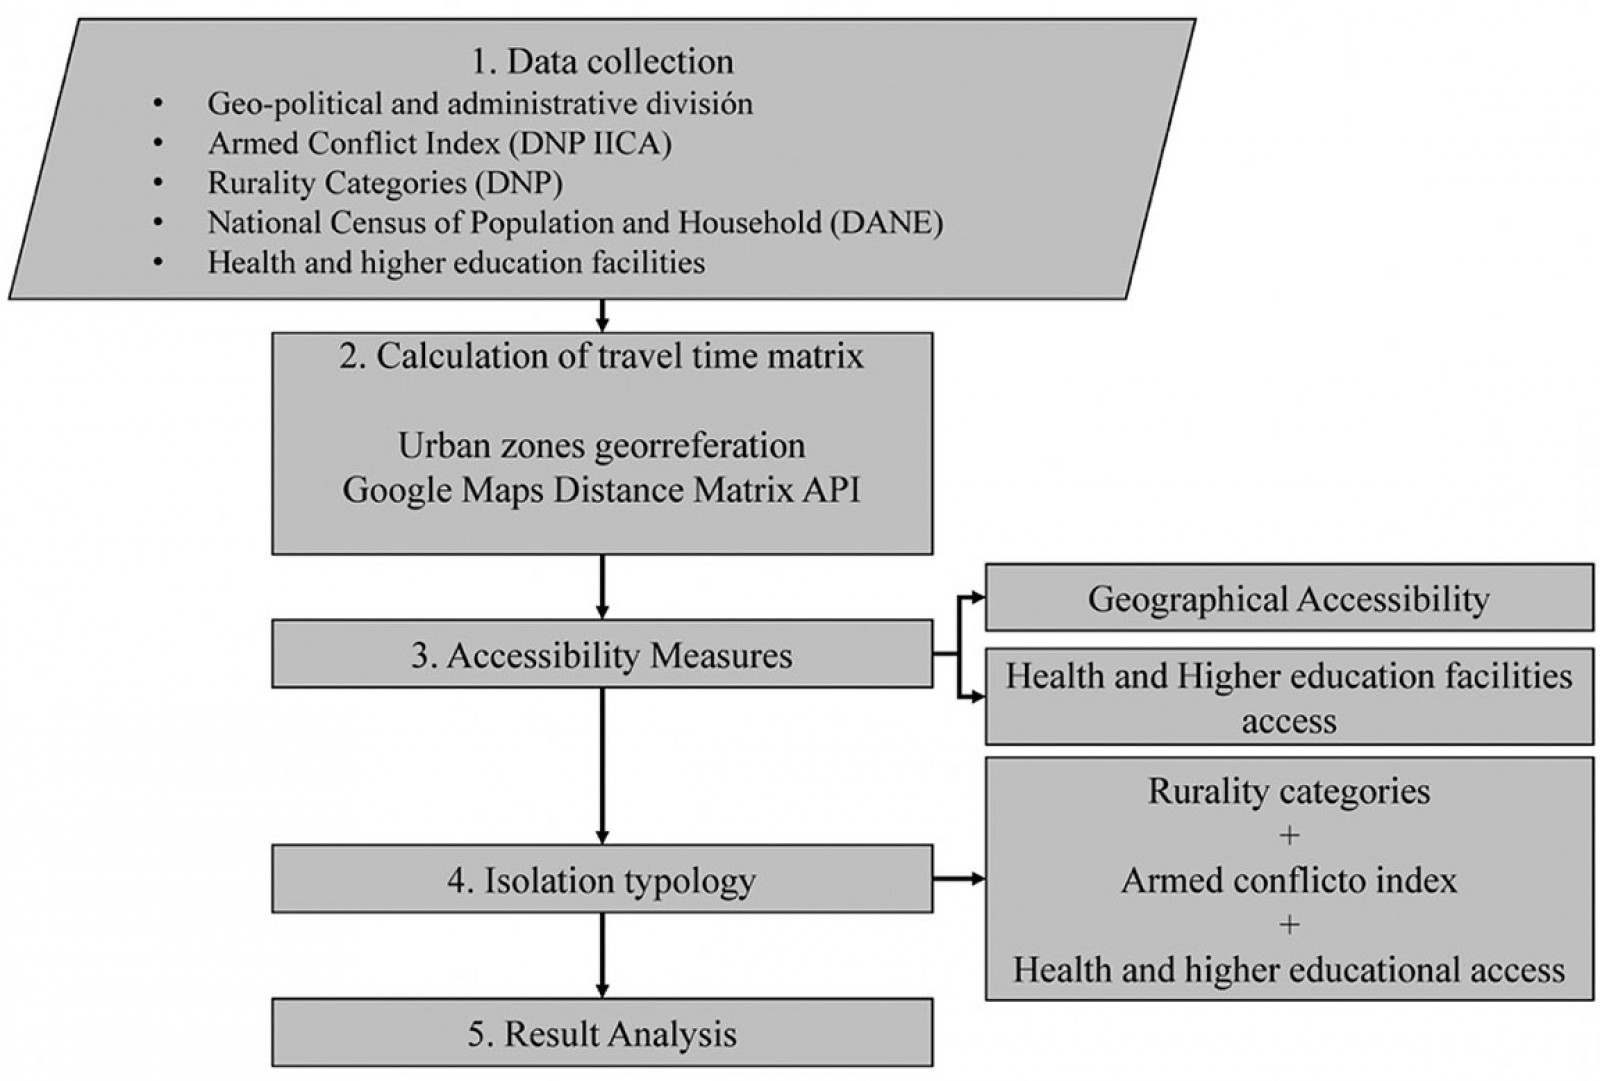 Figure 2: Flow chart methodology.
Calculation of travel time matrix
This phase was composed of two consecutive subphases, as follows.
Urban zones georeferencing: Urban zones for 27 municipalities in the Caldas department were georeferenced using ArcGIS software v10.5 (Esri; https://www.esri.com/en-us/arcgis/products/arcgis-pro/overview). Latitude and longitude coordinates were calculated for each point.
Distance Matrix API: A request to the Distance Matrix API of Google Maps was made considering latitude and longitude coordinates per municipality. This API responded with the shortest path within required points in terms of distance and time using historical data collected by Google Maps users. There is no need to have a road network because all the calculations are based on Google Maps data. The API has a variety of transport modes and the option to include schedules for transit39. In this study, the private vehicle was used as a transport mode since the study is regional and data for transit were not available. The API request was made using the Google Maps service library, and the Pandas library63, both from Python v3.7 (Python; https://www.python.org/downloads), was used to build the travel time matrix63 (see an example code with the implementation at https://github.com/scardonau94/Request-Google-Distance-Matrix-Api-for-urban-zones-in-Caldas).
Accessibility measures
Two accessibility measures were calculated based on Caldas’ department travel time matrix: geographical accessibility, and access to health and higher education facilities.
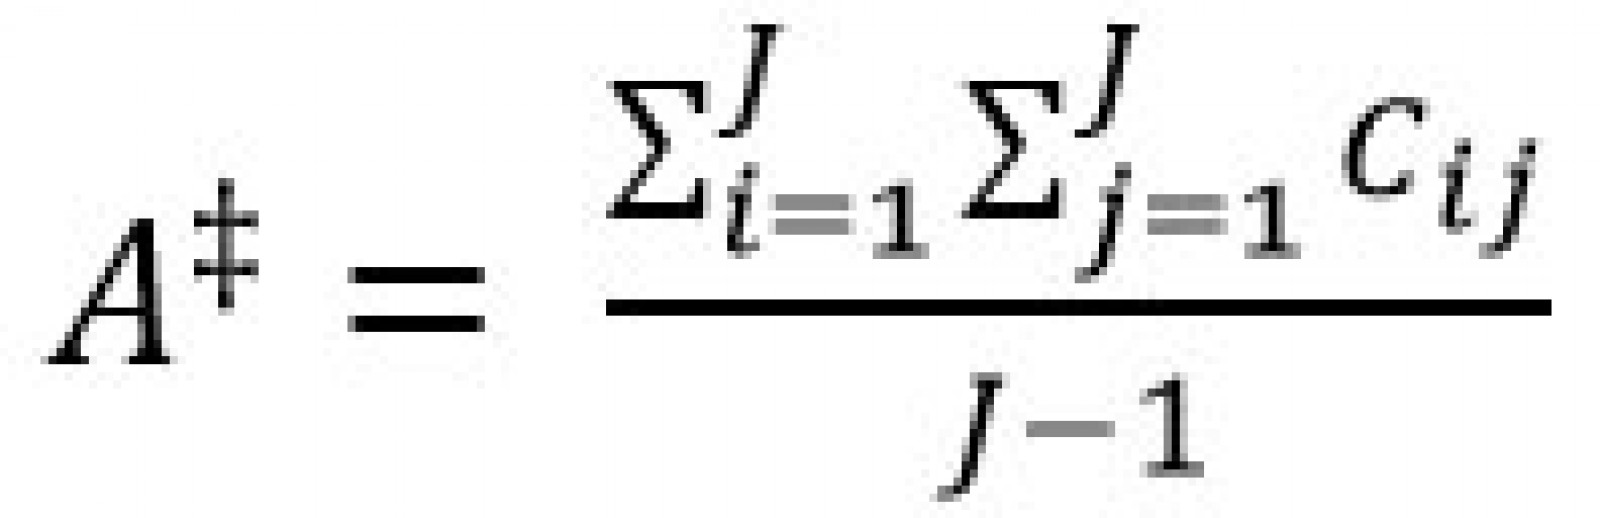
Geographic accessibility: Travel impedance (Cij) between the municipalities in the study zone (where i is origin, j is destination) was used to determine travel time, which was estimated with the Google Distance Matrix API. Geographical accessibility (A‡) per municipality (i) was then calculated as follows, where J is the total number of municipalities18,59.
Health scenarios: Scenarios were constructed considering the patient flows defined by the Territorial Directorate of Health of Caldas, where three levels of complexity are considered, creating patients’ movements within the municipalities in search of appropriate health care.
Higher education scenarios: Municipalities with higher education institution facilities were considered. The Ministry of Education divides higher education institutions into four levels: technical profession institutions, technological institutions, technology schools, and universities. Higher education institution facilities in the study zone were downloaded from the database of the Sistema Nacional de Información de la Educación (National Information System of Higher Education) and complemented with data from the Servicio Nacional de Aprendizaje (National Learning Service)62. Two scenarios were considered: travel time from each municipality to the nearest municipality with higher education institutions of any level and travel time from each municipality to the nearest municipality with higher education institutions with university institutions.
Isolation typology
This measure was defined using the rurality and IICA per municipality. Categories were built according to those of the National Planning Department49,51 and accessibility measures for geographical accessibility, health, and higher education facilities (Table 2) per municipality to determine their isolation typology using different thresholds. The average department geographical accessibility was used as a threshold for this accessibility measure. A time of 1 hour was chosen as the threshold for health facilities, considering the literature review35,64. For higher education facilities, 1.5 hours was used considered as the travel time limit for a person wanting to study in a certain municipality without changing their residence65-67.
Table 2: Isolation categories for health and education facilities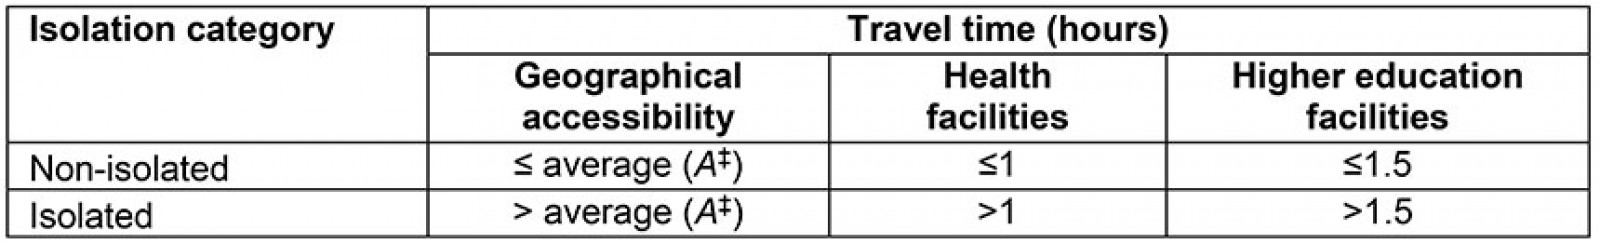
Results analysis
Results relating to armed conflict and rurality data were analyzed from a geographical and quantitative perspective. Isolation typology following accessibility measures (geographical accessibility, health, and higher education facilities) was also considered. In this case, Pearson’s rank correlation coefficients and their p-values were measured using Python v3.7 statistical tools. Those correlations have been used in previous investigations related to geographical accessibility, rural areas, and isolation3,68.
Ethics approval
The research did not use personal information data about patient’s health or performed health experiments on humans; consequently, ethics approval was not required.
Results
Figure 3 shows the geopolitical and administrative division of the department of Caldas, composed of 27 municipalities. The municipalities’ urban areas are represented by black triangles. Manizales (Caldas’ capital city) (1) and Villamaría (17) form a conurbation of 461 094 inhabitants (7.6% in rural areas). In the east, La Dorada (9) is the second-largest municipality in the study area, with 71 905 inhabitants (13% rural). Marulanda (4) has the smallest population with 2607 inhabitants (68.4% rural).
Results of geographical accessibility are shown in Figure 4, with the average travel time per municipality. Manizales (1) has the minimum average travel time of 2.4 hours despite its distance from the department centroid (red circle in Figure 4) which is near to Marulanda (4), a municipality with 3.5 hours as the average travel time. This result shows the road infrastructure development around the capital city apart from the remote municipalities. For example, municipalities located in the east zone of the department have average travel times of more than 3.7 hours with maximums of 5.6 and 5 hours in Norcasia (15) and Samaná (21), respectively.
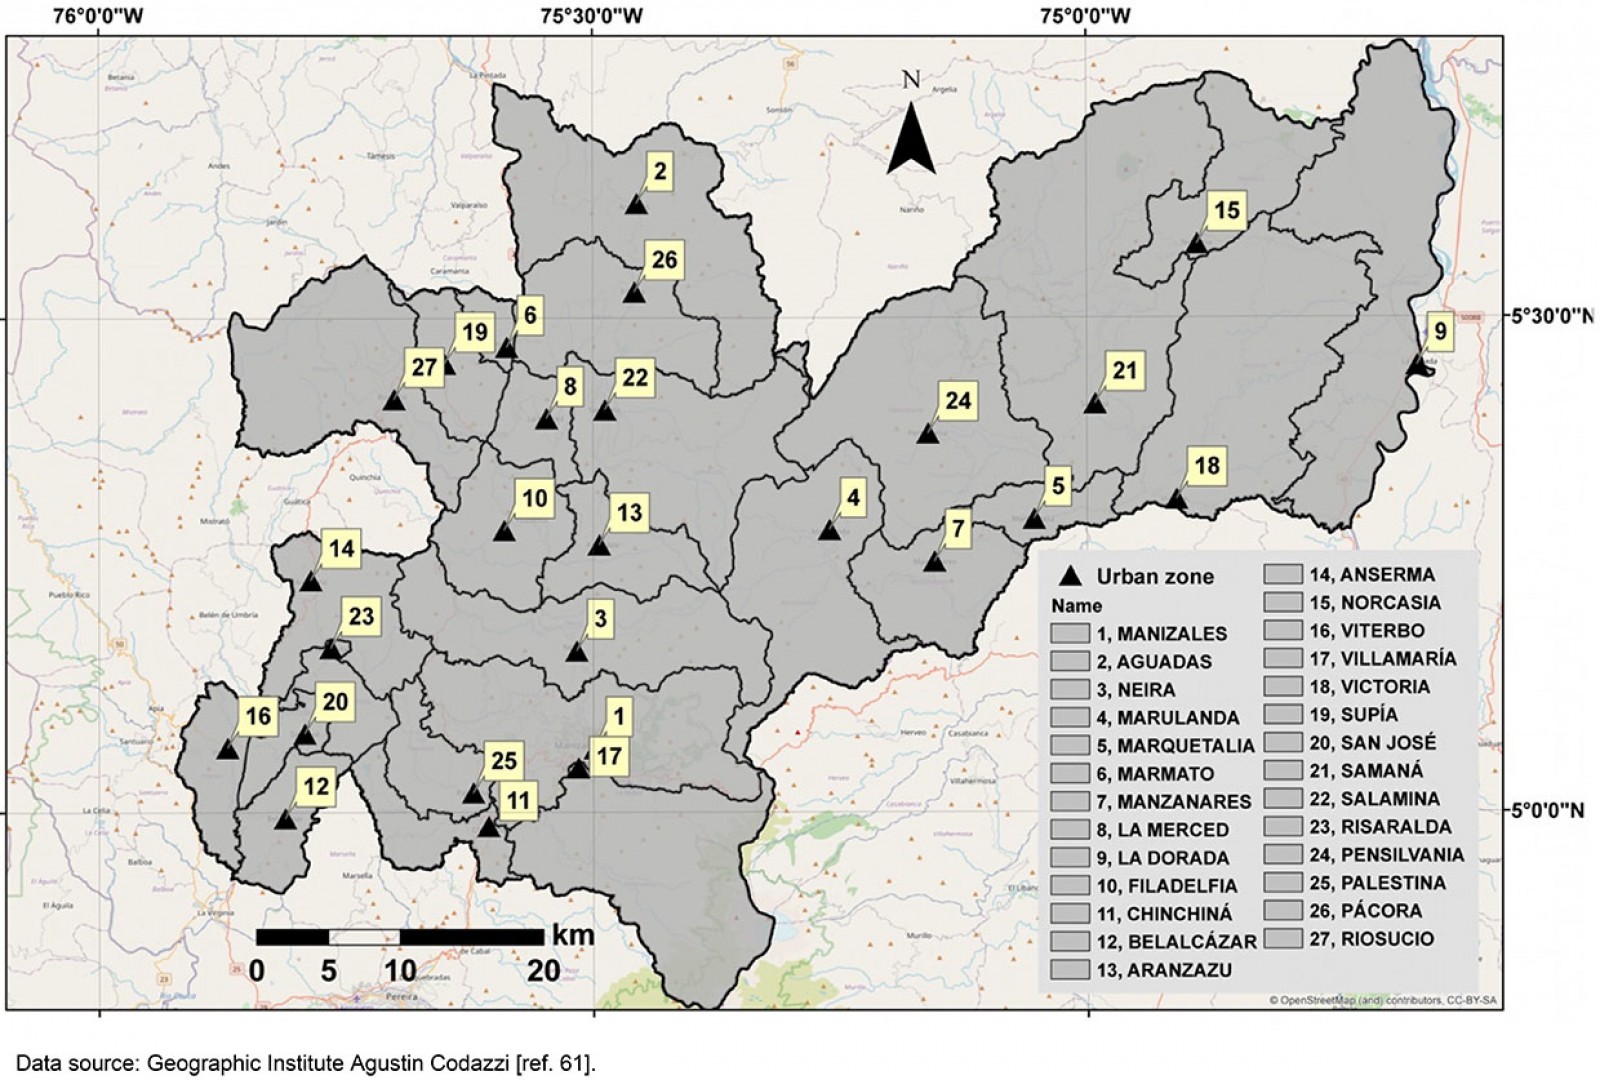 Figure 3: Geopolitical and administrative division and urban zones in Caldas.
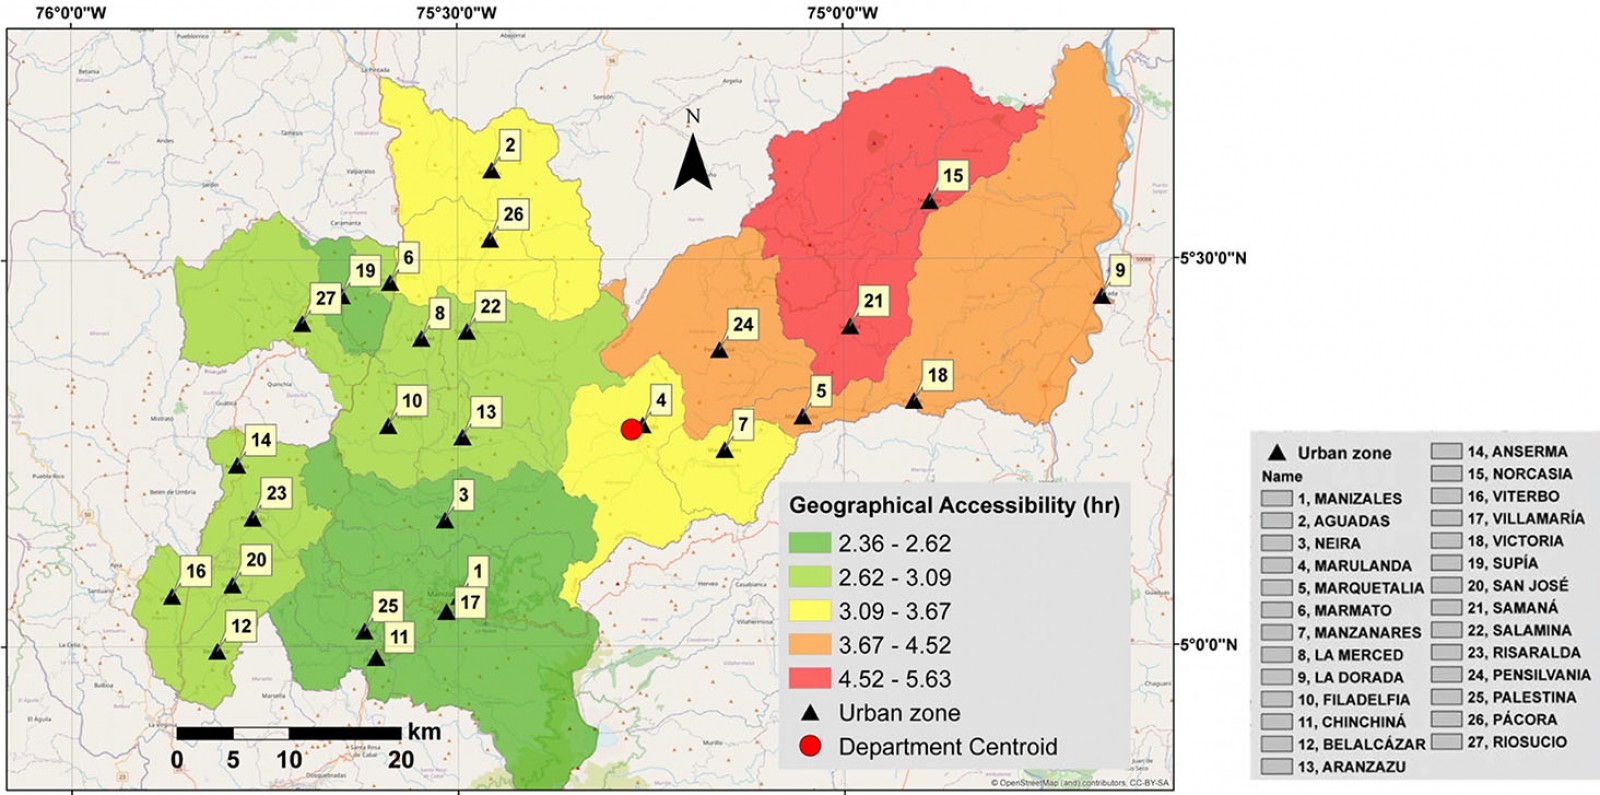 Figure 4: Geographical accessibility in Caldas.
Index of Incidence of Armed Conflict in Caldas
The IICA calculated for Caldas by the National Planning Department is shown in Figure 551. Samaná is the only municipality with a very high IICA, which shows that it has been affected by the Colombian armed conflict, especially in the period from 2002 to 201269. Twenty five municipalities have IICAs of medium and medium-low, showing that the department of Caldas has not been affected by the armed conflict as much as other territories in Colombia51,69.
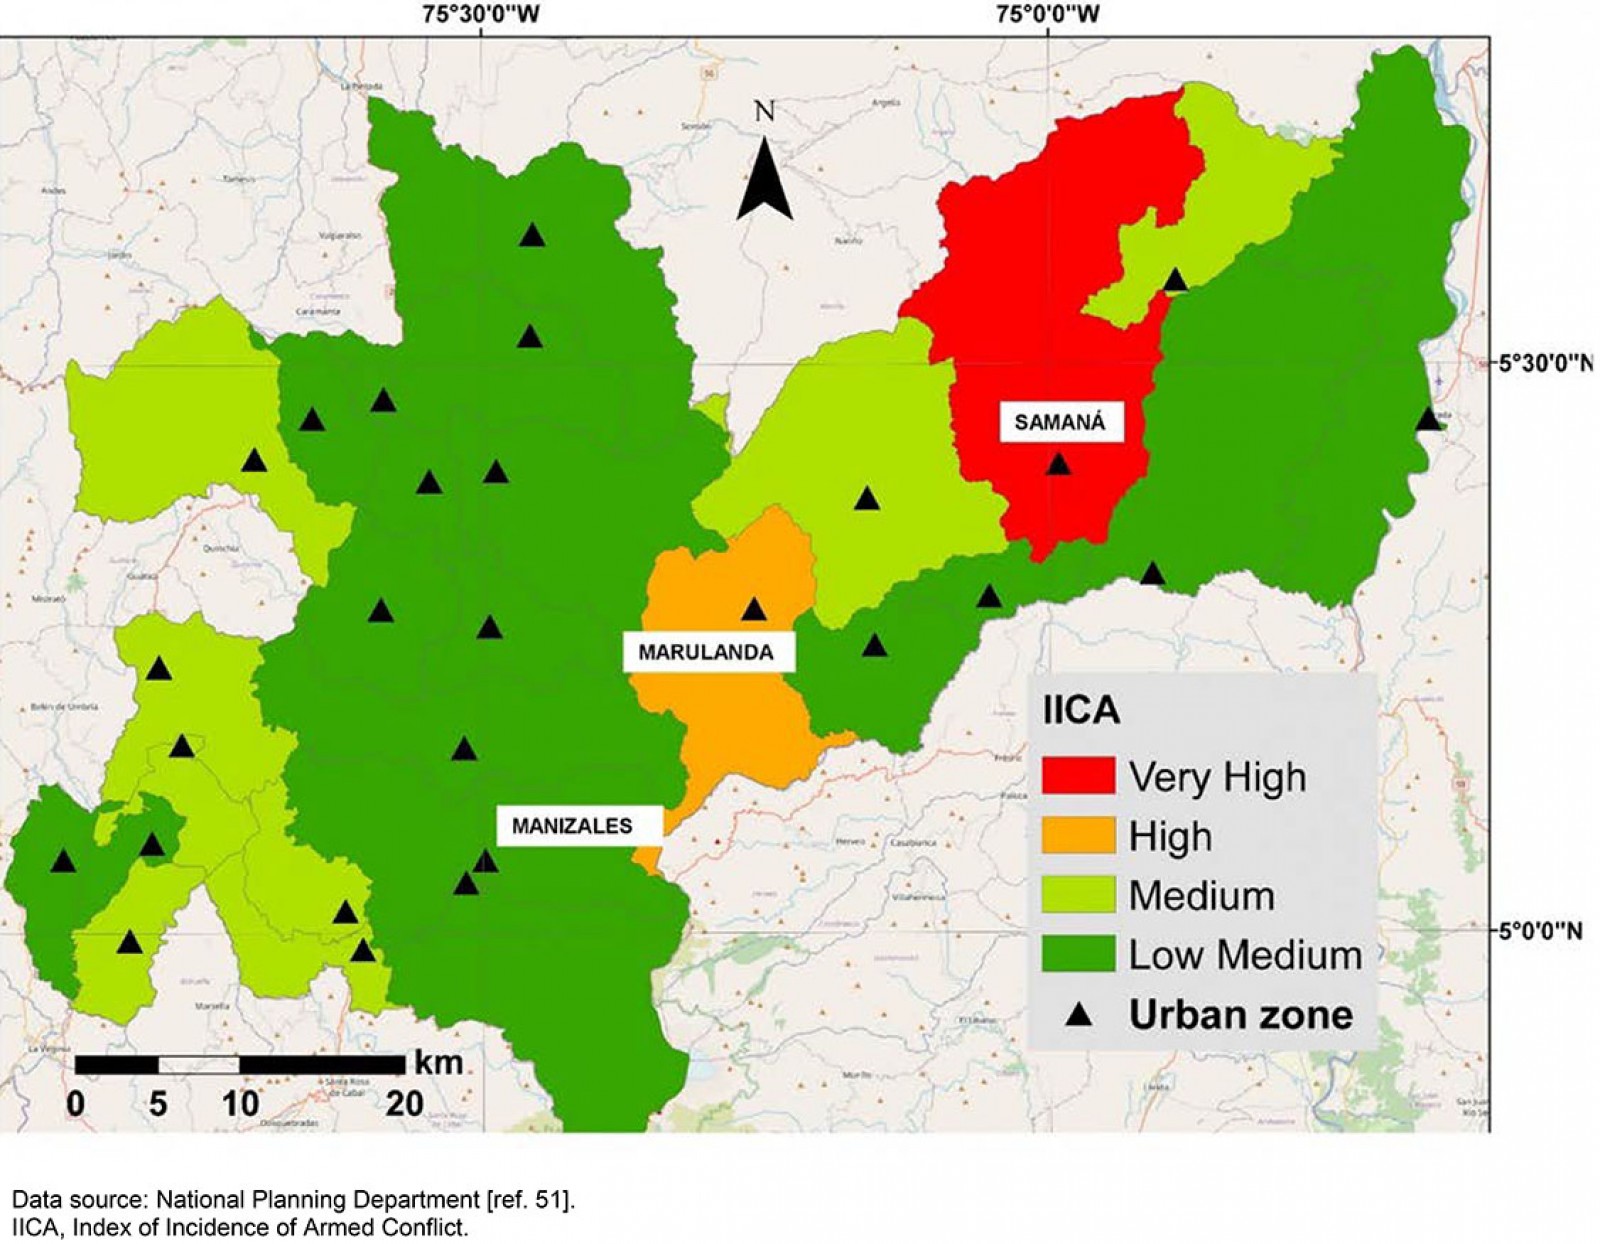 Figure 5: Index of Incidence of Armed Conflict for Caldas.
Healthcare flow and levels of health care
Figure 6 shows the complexity level of health care in Caldas. Four complexity levels constitute the healthcare plan defined by the Territorial Directorate of Health of Caldas. Zero is the basic level of health care. All the municipalities are included in this level. The third level is the highest complexity level, where the most severe pathologies and injuries are handled (Fig7). Manizales is the only municipality with the third level; consequently, patients requiring this complexity of care must travel there from other municipalities. Health scenarios of access were built with a cumulative method: the first scenario corresponds to access from a municipality with basic health care to one at the first complexity level; the second scenario aggregates first-level travel times to reach municipalities with second-level health care, and the third scenario represents access to third-level health care from the second level.
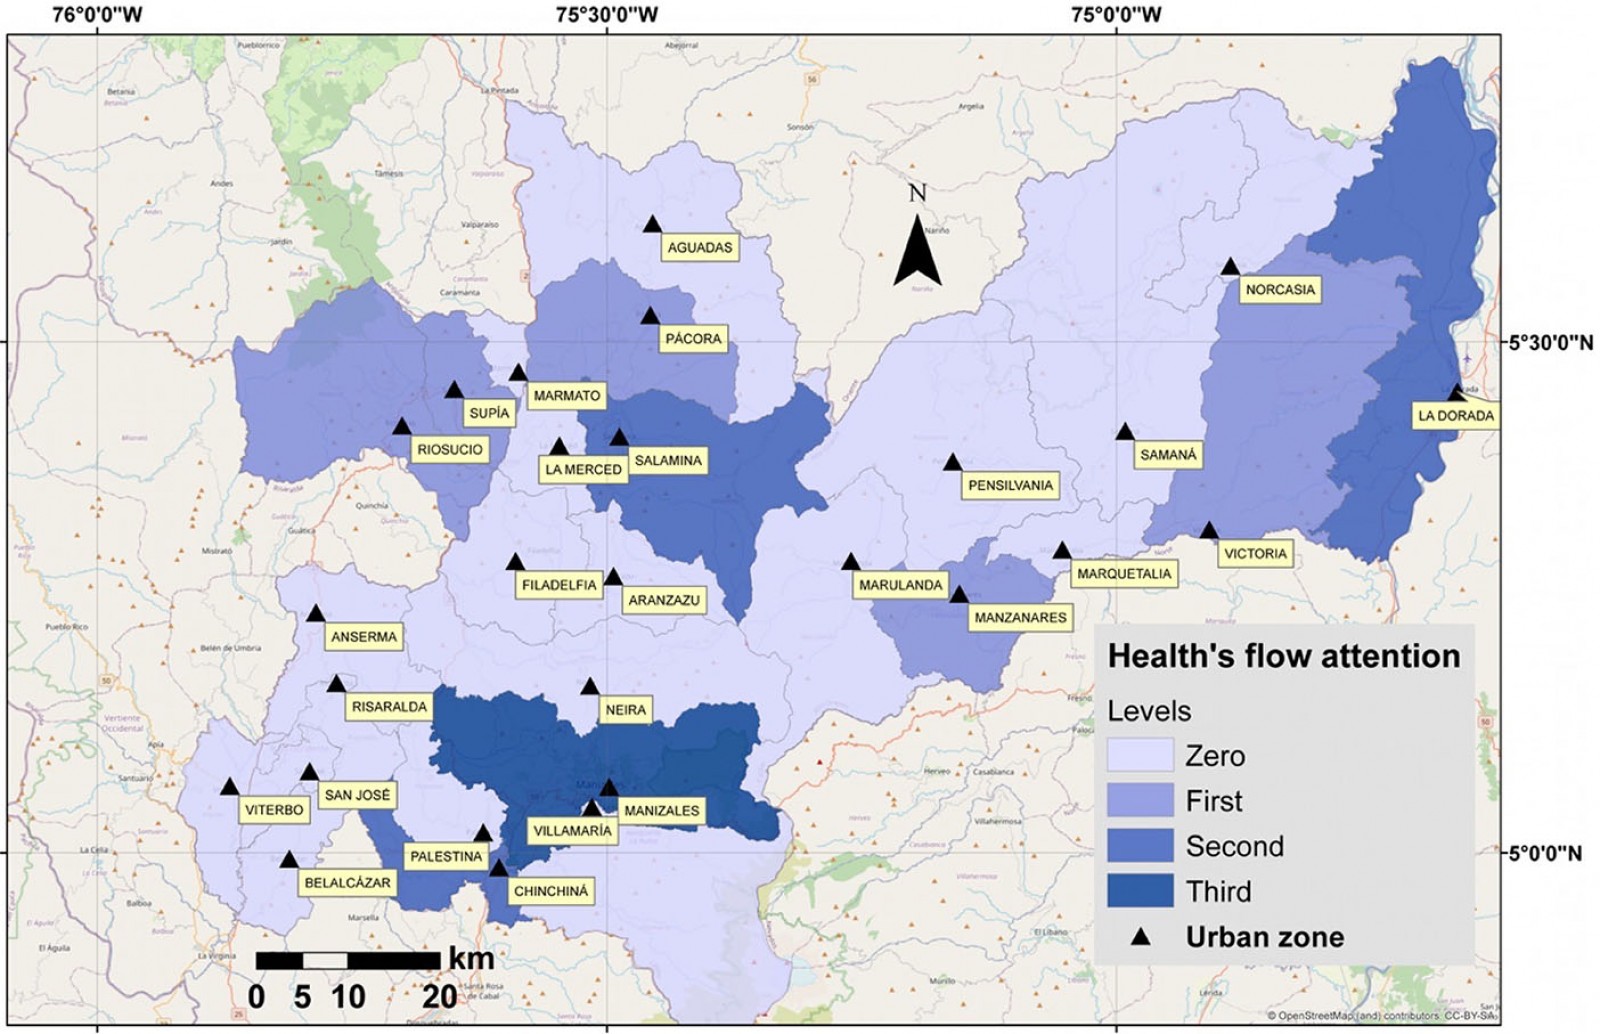 Figure 6: Complexity levels per municipality.
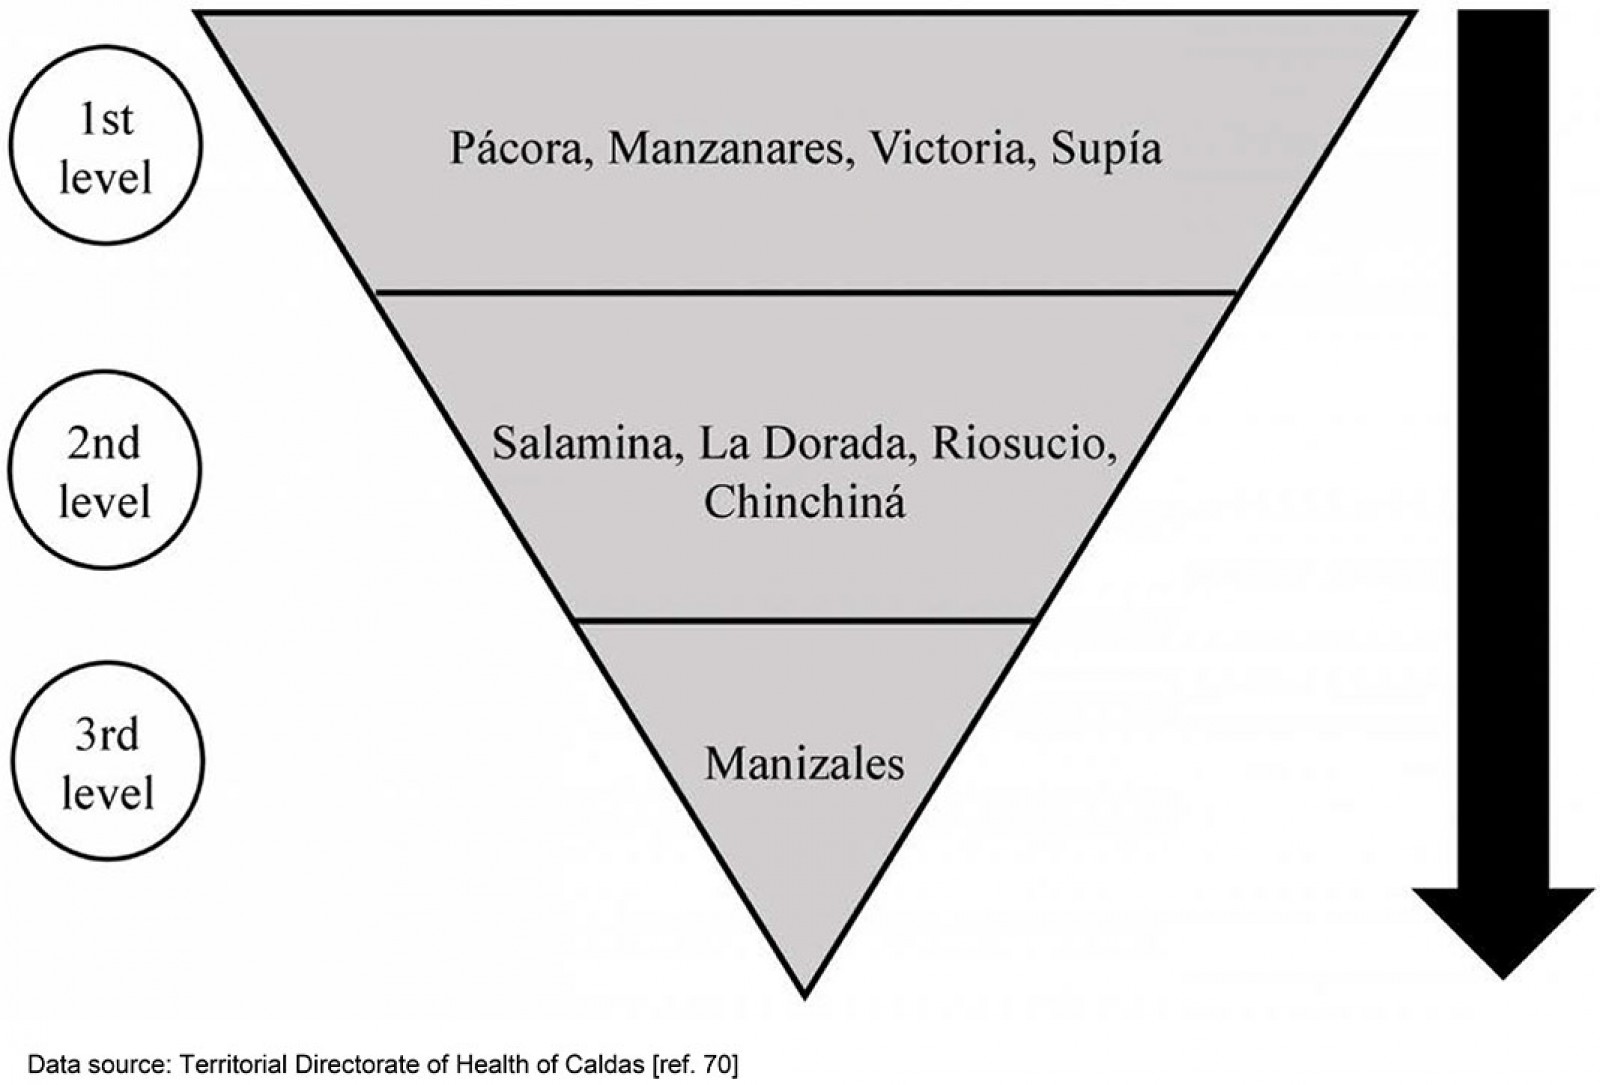 Figure 7: Availability of health care by complexity level in municipalities of Caldas70.
The travel time to the first level of care is shown in Figure 8. The blue arrows represent the flow of patients between level zero and the first level of care. Municipalities such as Anserma (14), Filadelfia (10), Viterbo (16), and Marulanda (4) have travel times of more than 1.5 hours in this scenario, while 10 municipalities have more than 1 hour as travel time.
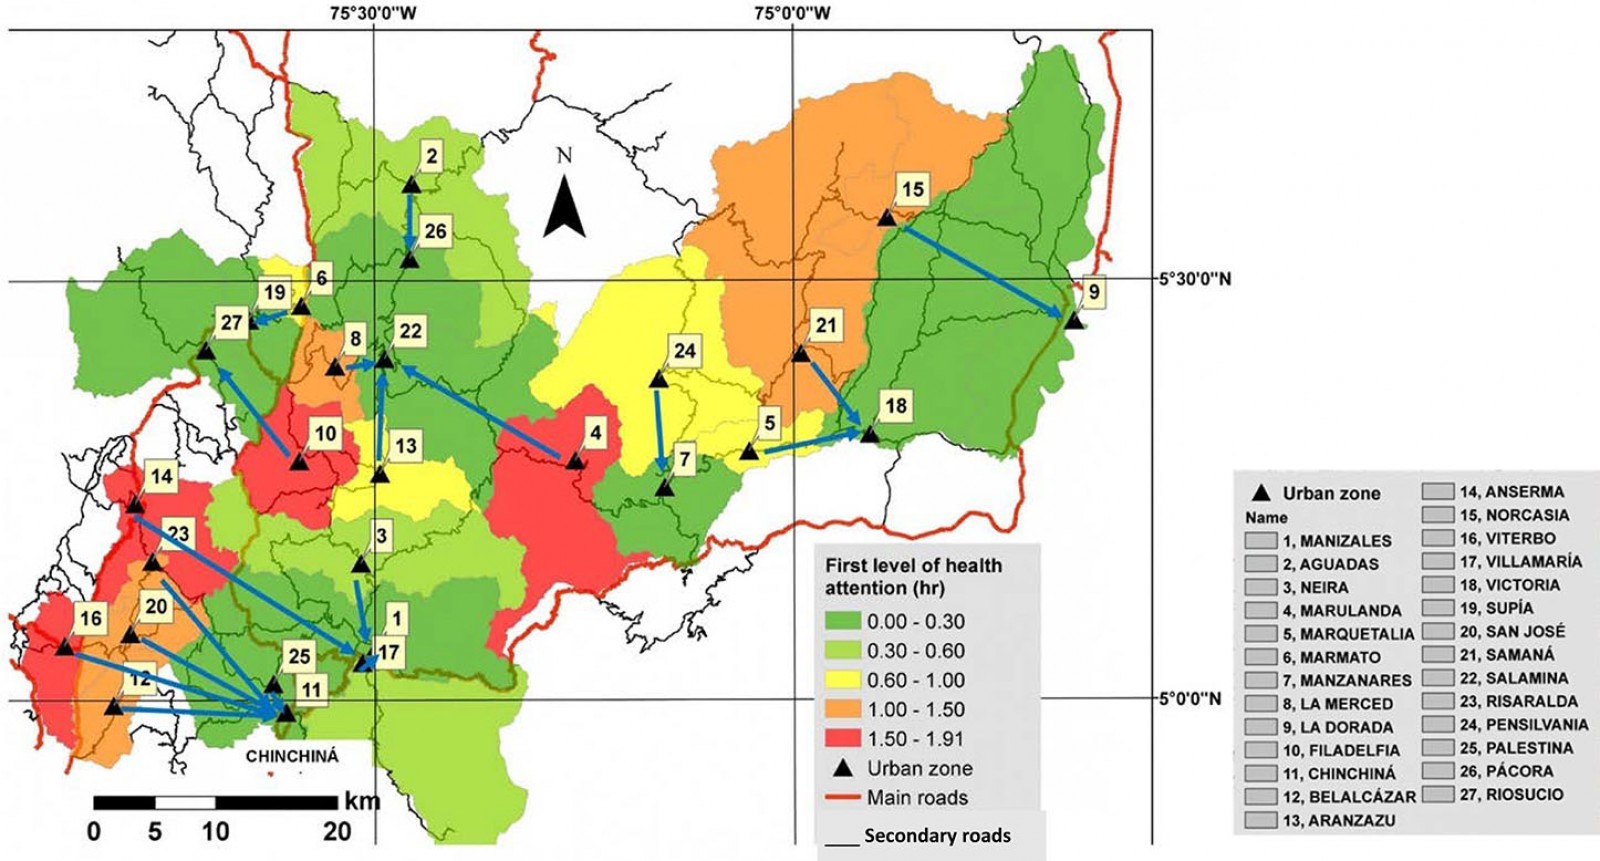 Figure 8: Travel times for first level of health care in department of Caldas.
Care at the second level of complexity is shown in Figure 9. Purple arrows represent the direction of each municipality from the first to the second level of health care. In this scenario, travel time is cumulative; consequently, municipalities such as Samaná (21) and Pensilvania (24) have the highest travel times. Moreover, this scenario shows 16 municipalities with travel times more than 1 hour, compared to 10 in the first scenario.
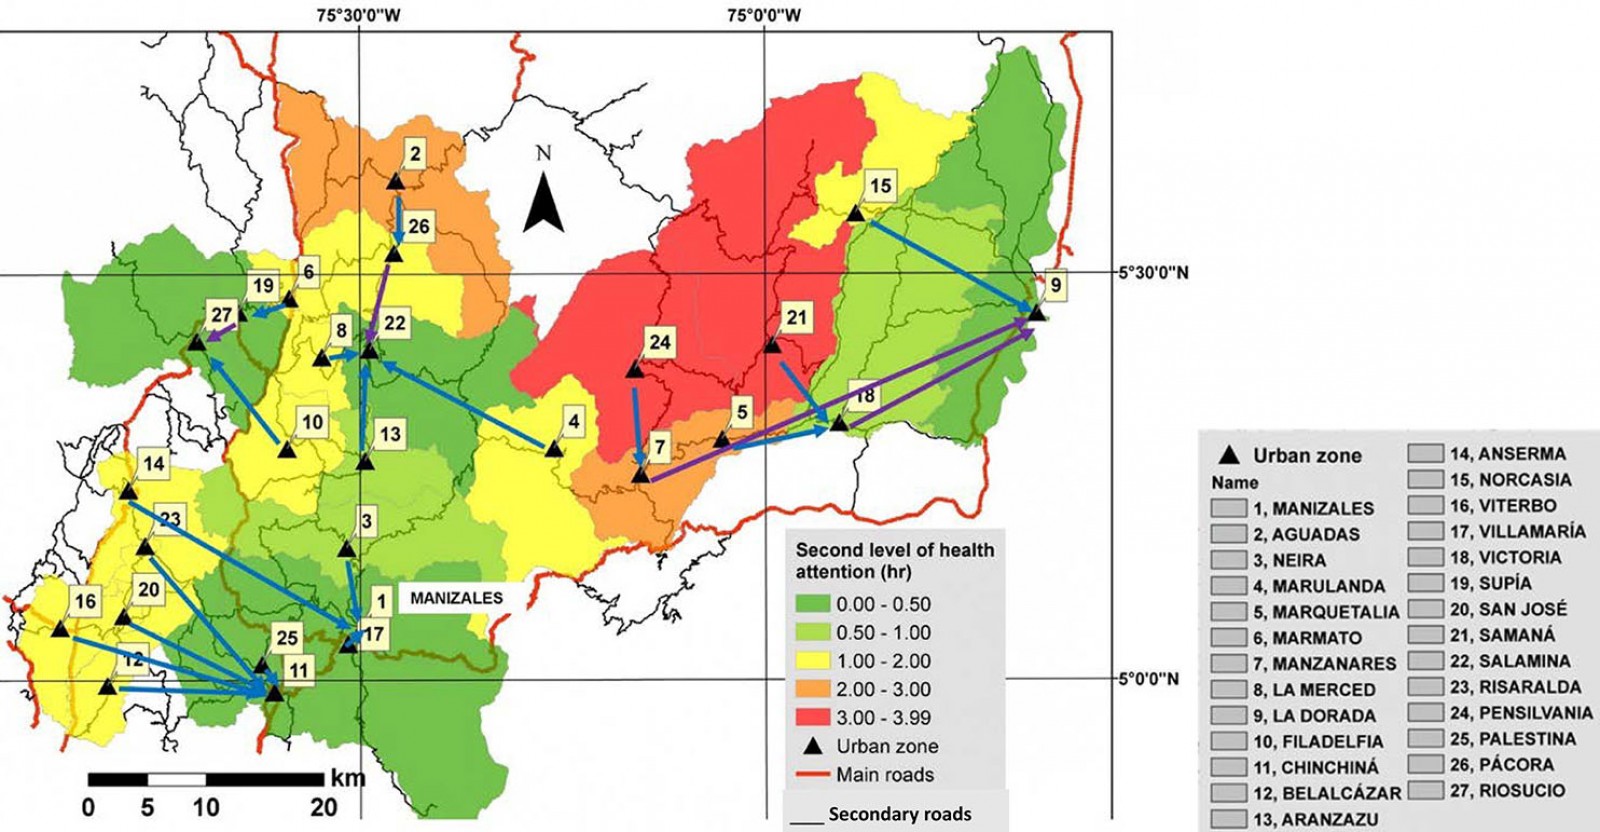 Figure 9: Travel times for second level of health care in department of Caldas.
Travel times from the municipalities to the third level of care is shown in Figure 10. For this level of care, patients from all other municipalities must travel to the capital, Manizales (1). The maximum travel time is 7.9 hours in the municipality of Samaná (21): the route of care goes first to Victoria (18), then to La Dorada (9), and finally to Manizales (1) (Fig10). The number of municipalities with a travel time of more than 1 hour increases to 23 for this level of care. Only three municipalities (Chinchiná (11), Neira (3), and Villamaría (17)) are within a 1-hour travel time of Manizales (1). These municipalities, along with Palestina (25), are in a draft bill to establish the Centro-Sur metropolitan area56.
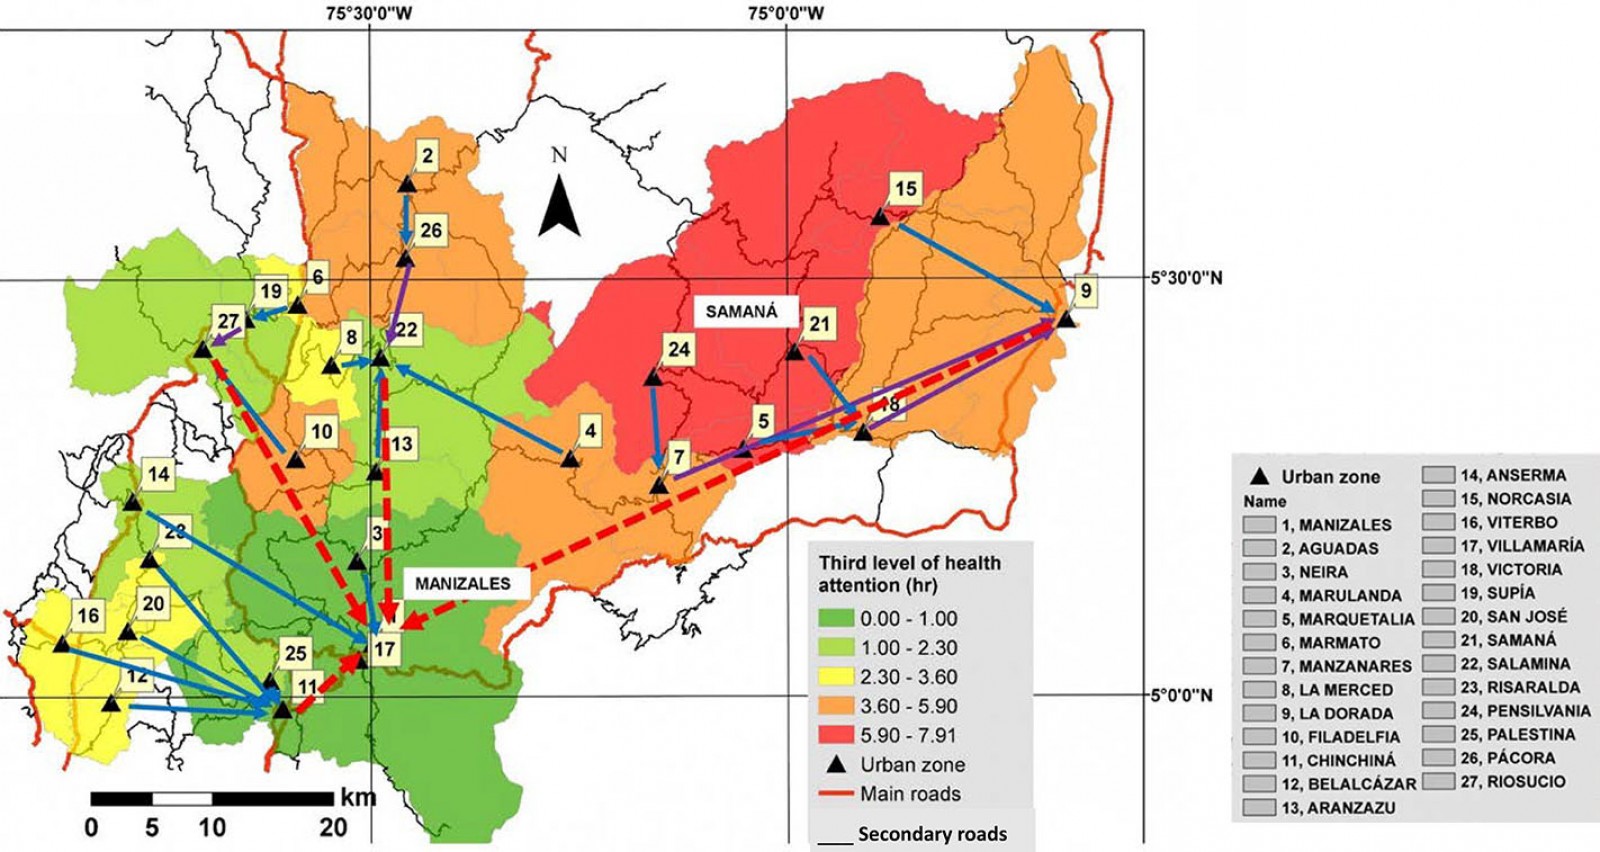 Figure 10: Travel times for third level of health care in department of Caldas.
Higher education facilities
According to the National Information System of Higher Education data set in Caldas Manizales (1), Pensilvania (24), and La Dorada (9) have higher education institutions. As the capital city, Manizales has higher education institutions at all levels according to the Ministry of Education62. It is also trying to position itself as the university capital of Colombia through the project ‘Manizales University Campus’36. Pensilvania (24) has the main campus of Colegio Nacional Integrado de Caldas Oriental, which offers technological programs with branches in municipalities such as Marquetalia (5) and Manzanares (7). The National Learning Service offers technical and technological programs in Manizales (1) and La Dorada (9).
The travel times from each municipality to the nearest higher education institution facilities are shown in Figure 11. The municipalities in the south-central metropolitan region have travel times of less than 1. Municipalities around the college have travel times of 1.4 hours (Samaná, 21) and 1.6 hours (Marulanda, 4), showing high travel times despite the large distribution of college headquarters among the three municipalities. Municipalities in the north of Caldas have travel times of more than 2.5 hours to the nearest higher education institution, demonstrating the worst accessibility to higher education facilities in Caldas.
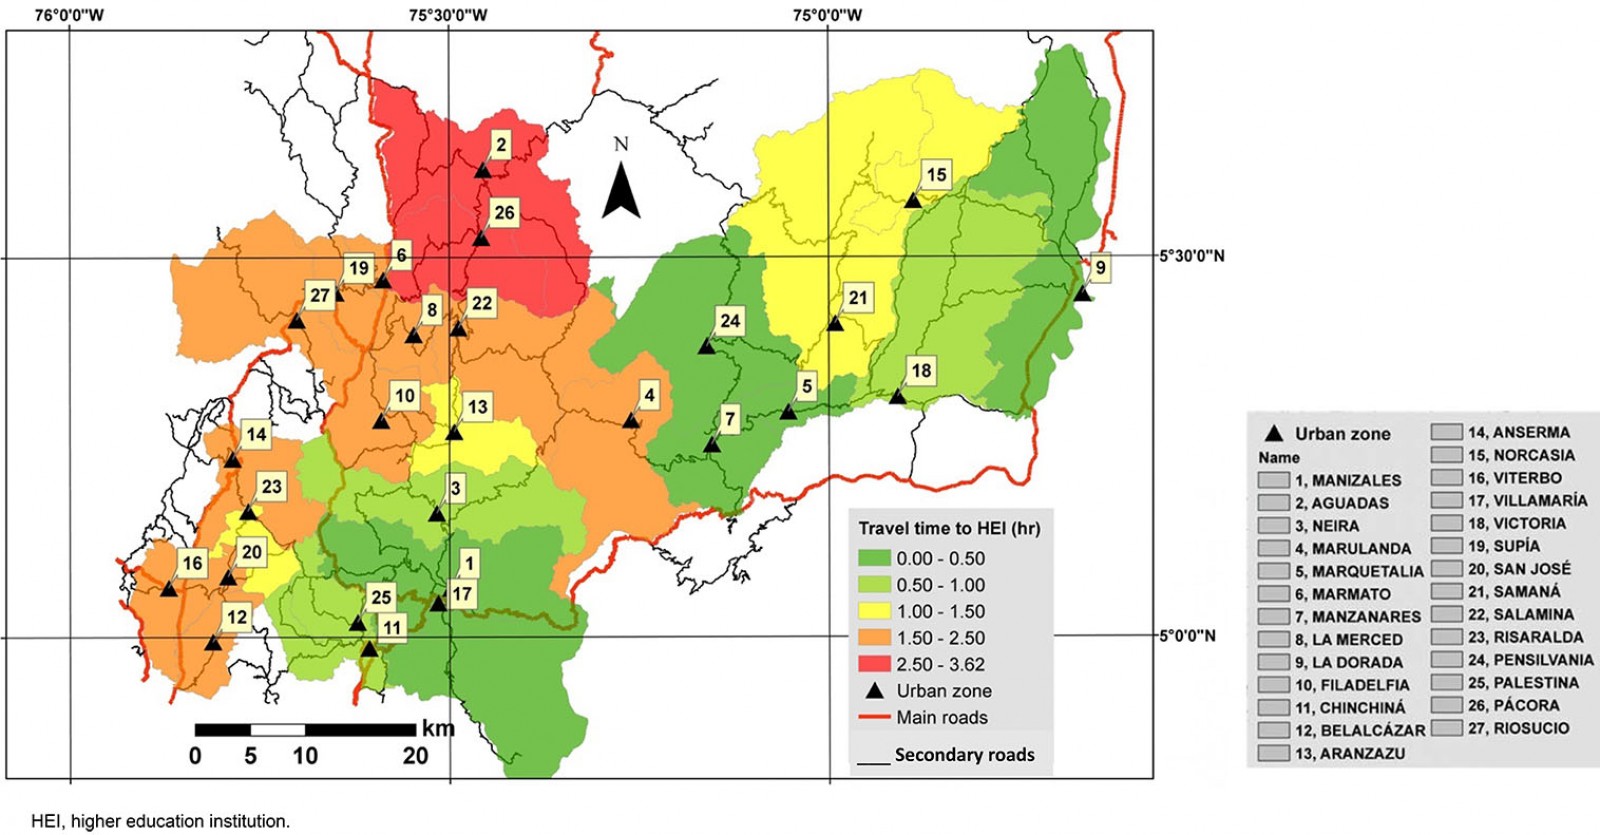 Figure 11: Travel times to nearest municipality with a higher education institution.
Figure 12 shows the travel time of each municipality to reach university, the highest education level, in Manizales (1). In this scenario, municipalities in the east and north of Caldas have travel times of more than 2.5 hours. La Dorada (9), Samaná (21), and Norcasia (15) have the highest travel times to Manizales with 4.1, 4.9, and 5.3 hours, respectively.
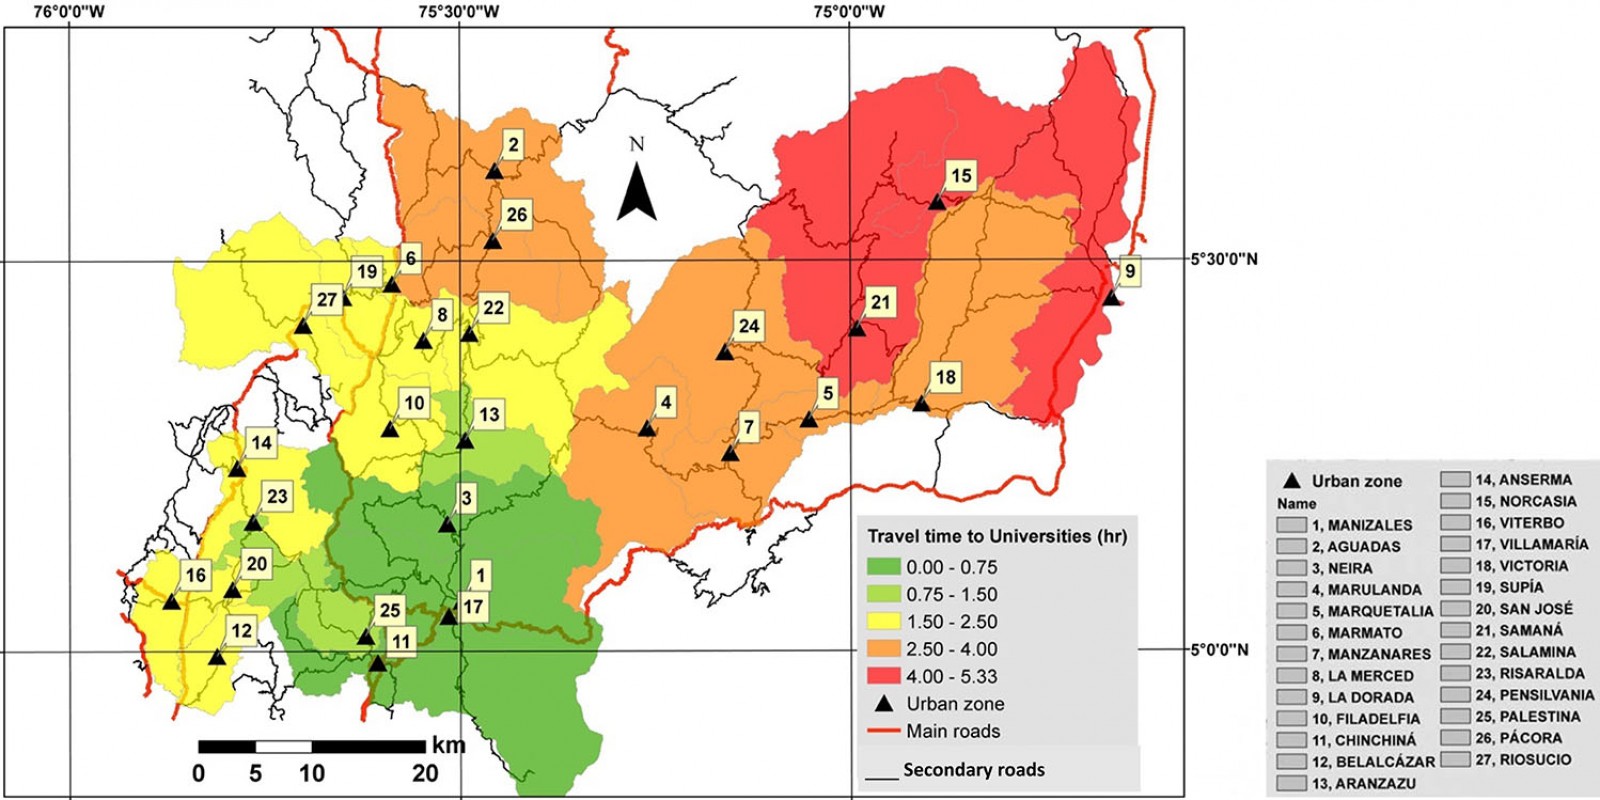 Figure 12: Travel times to university in Manizales.
Statistical analysis
Results of the statistical analysis performed in Python v3.7 are shown in Table 3, where the Pearson’s rank correlation coefficient and p-value for the relationships of all variables measured in the research with rurality and IICA are shown. Rurality has a stronger relationship with IICA, geographical accessibility, third level of health care, and higher education institutions to universities. IICA has a strong relationship with rurality and the first level of health care.
Table 3: Pearson’s rank correlation coefficient and p-value for rurality and Index of Incidence of Armed Conflict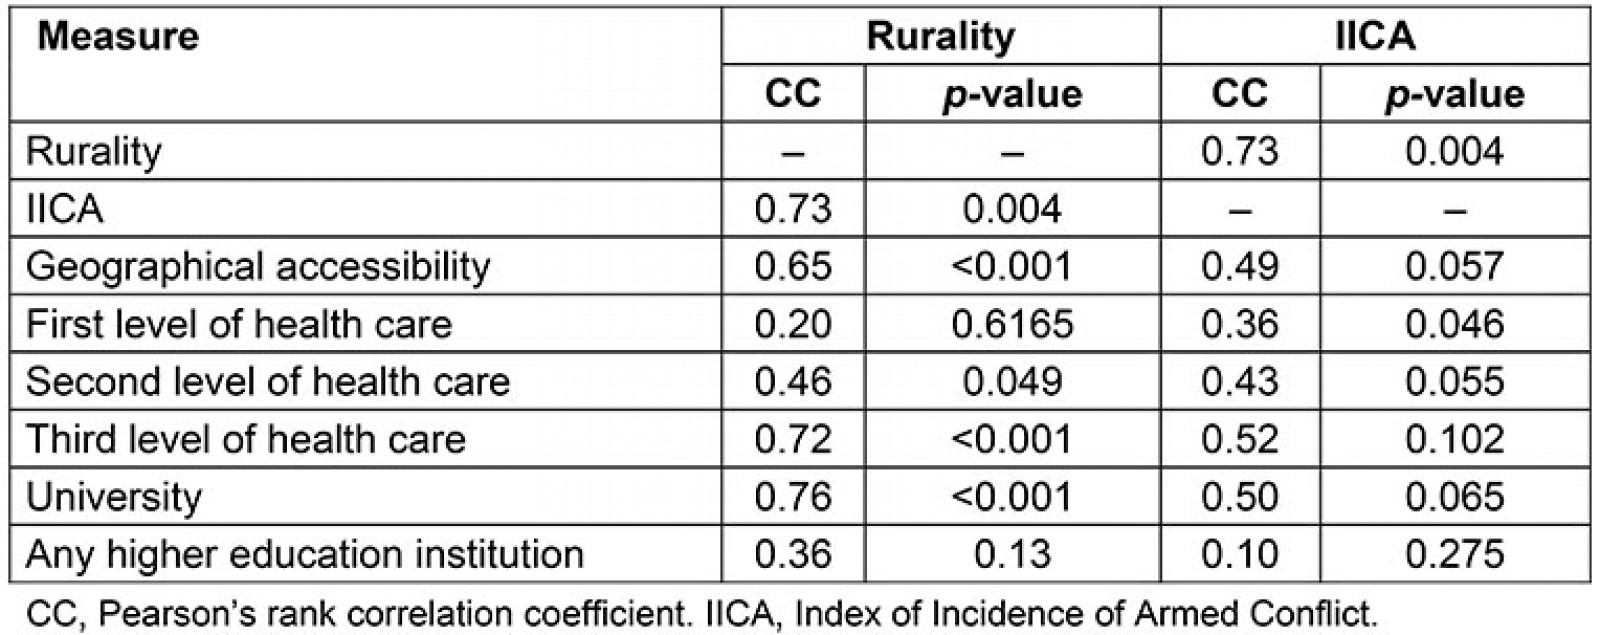
Isolation typology
According to geographical accessibility and department average travel time (3.2 hours), Figure 13 shows the results of isolation typology for Caldas. The north and east parts of the department are isolated, as well as municipalities with a high presence of armed conflicts, such as Samaná and Marulanda.
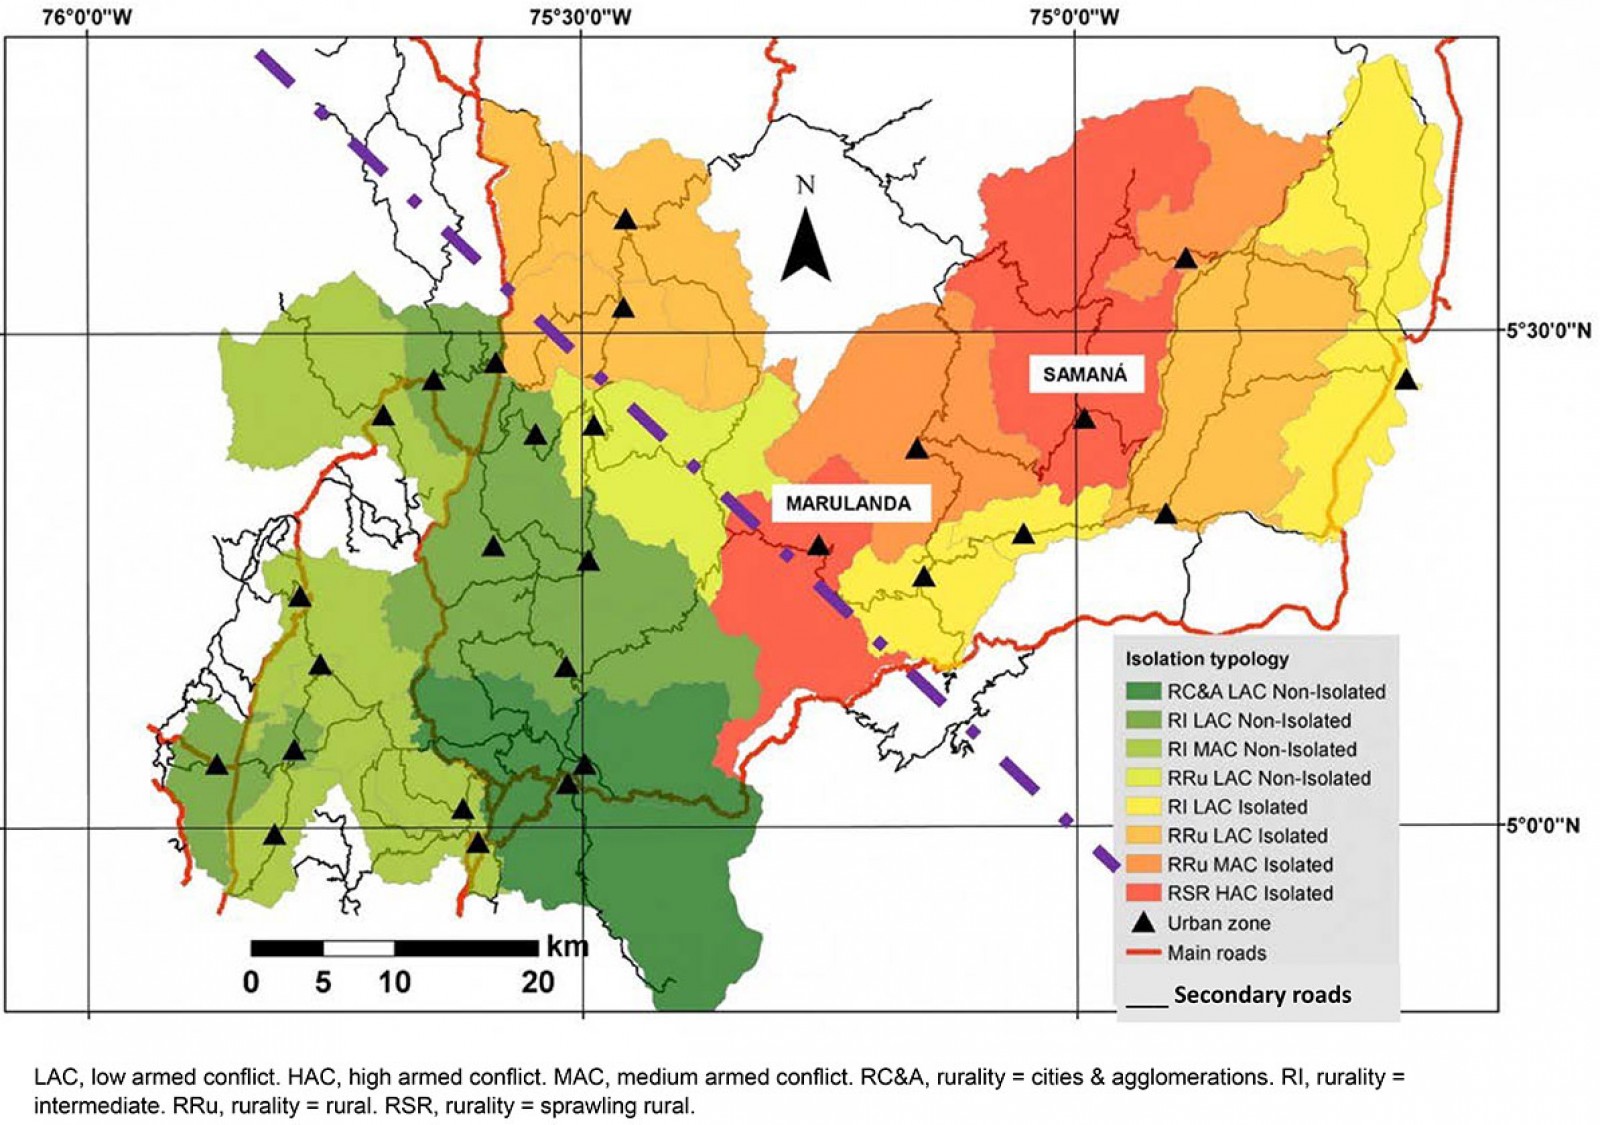 Figure 13: Isolation typology for geographical accessibility.
Considering the three health scenarios measured and the threshold of 1 hour as a travel time, the results for the typology of isolation are shown in Figure 14. At the first level of care, 10 municipalities are isolated (12.2% of the department’s population). Samaná and Marulanda, with a high presence of armed conflict, are isolated (shown in red), in addition to their rurality categories as rural areas of dispersion. At this level of health care, most of the municipalities are in the western part of the department. At the second level of care, six more municipalities are categorized as isolated, located mainly in the north and west (22% of the department’s population). At the third level of care, only four municipalities are non-isolated (43.2% of the department’s population is isolated): Manizales and Villamaría, considered as cities and agglomerations, Chinchiná and Neira (both as intermediate are non-isolated).
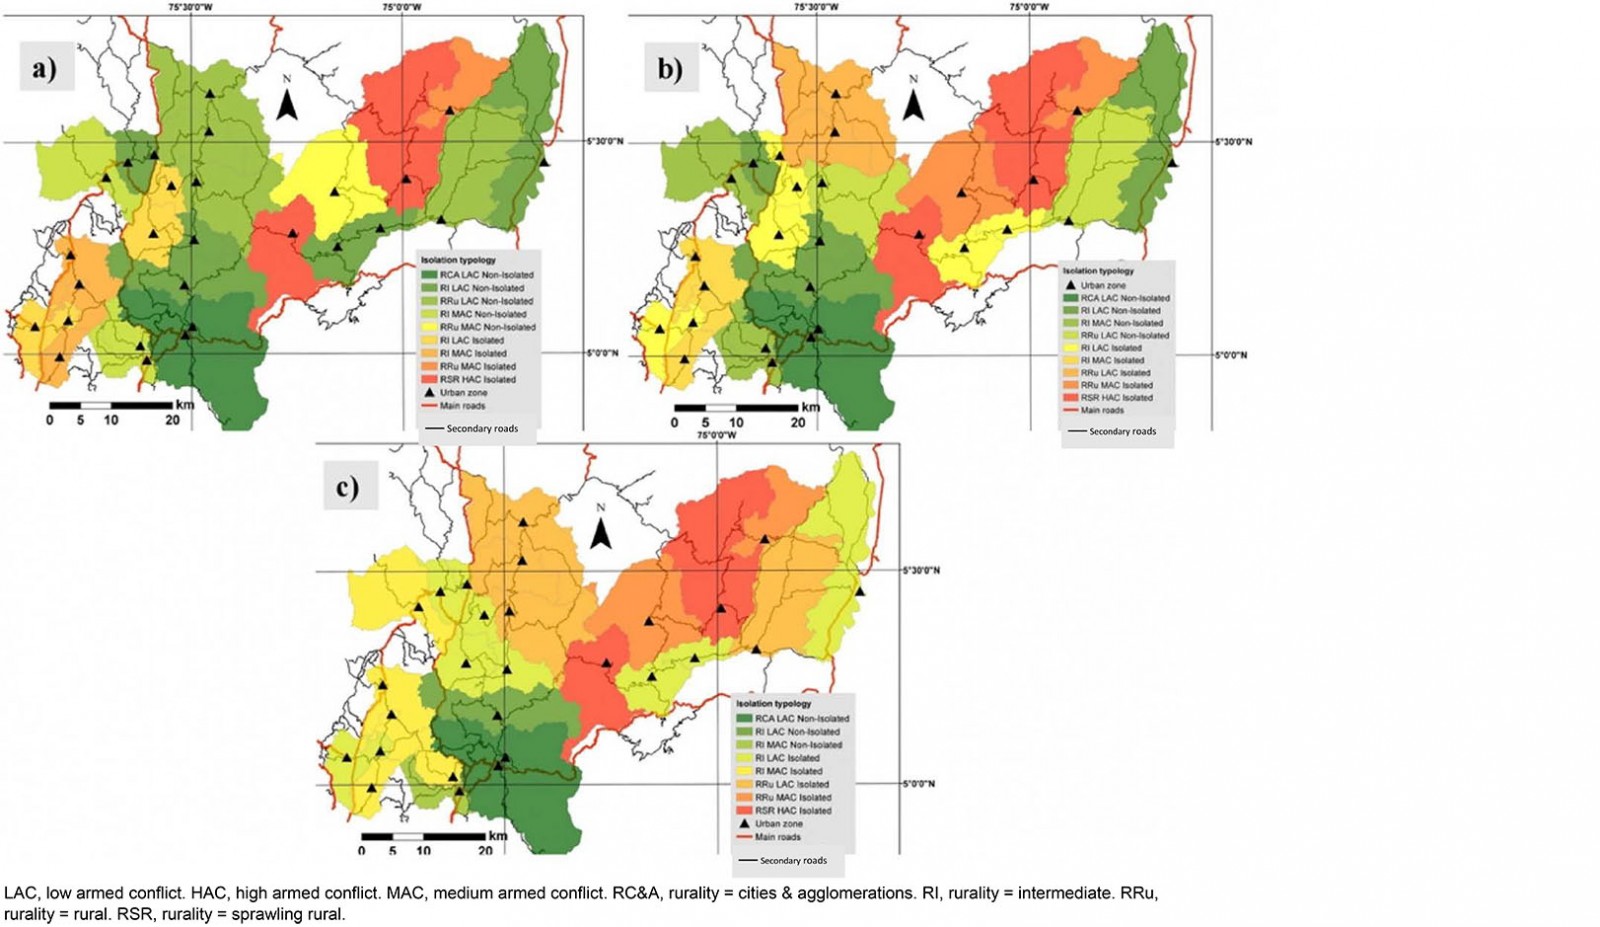 Figure 14: Isolation typology at (a) first level, (b) second level, and (c) third level of health care.
Figure 15 shows the results of isolation typology considering higher education in the two scenarios analyzed: travel time to the nearest city with any level of higher education institution and to Manizales, with the only university-level education. In the case of any higher education institution, municipalities in the north and west zone are isolated (23.3% of the department’s population), and many of them are considered rural. In the case of university, only 6 municipalities are non-isolated apart of Manizales (39.5% of the department’s population are isolated). Four of them are part of the project Metropolitan area of Centre-Sur (Chinchiná, Villamaría, Neira, and Palestina)56.
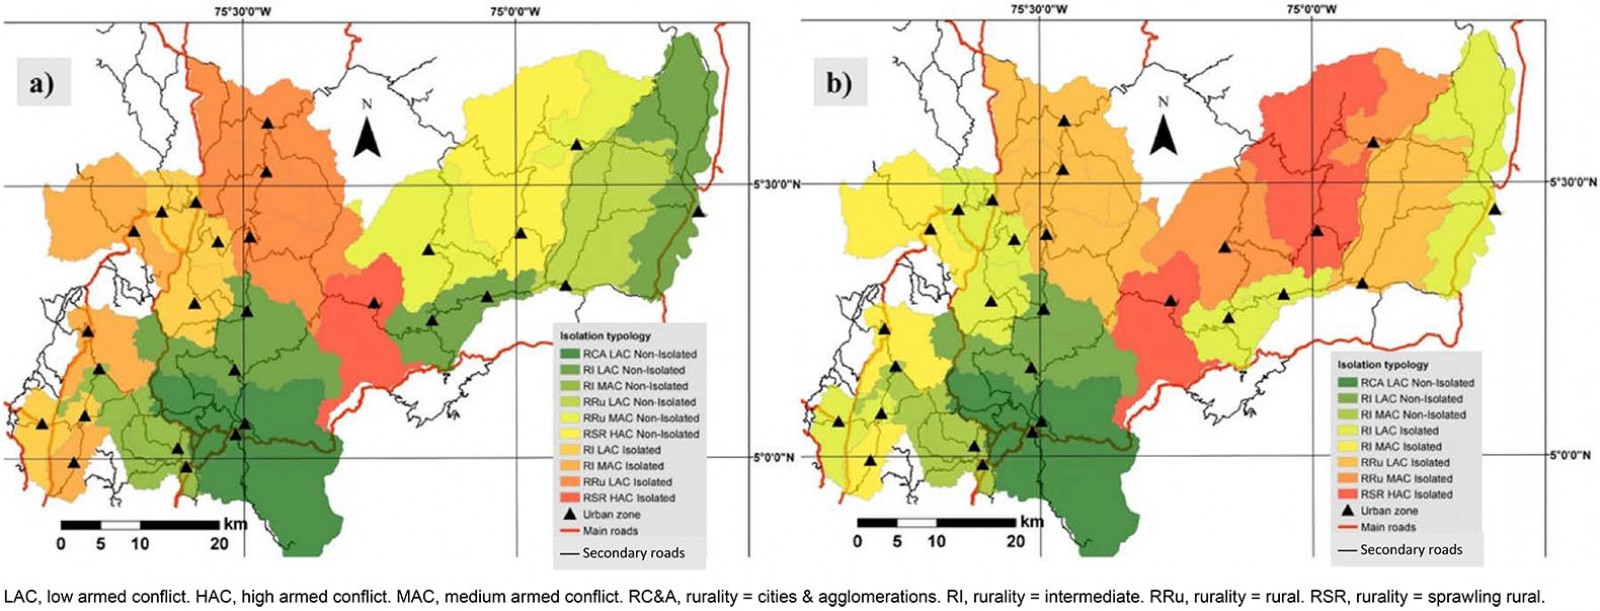 Figure 15: Isolation typology for (a) any level of higher education institution and (b) university.
Discussion
Rurality in Colombia was categorized according to three variables: rurality within the city system, population density, and the ratio between the population living in urban areas and the population not living in urban areas49. It is necessary to measure the typology of isolation of municipalities to enrich the definition of rural areas in Colombia. Measuring isolation can help define whether an area is underserved or not, including whether it is categorized as rural or not, to enrich planning policy decisions in different areas with health and higher education facilities3.
In 2017, CEPAL published a study in which the Territorial Agglomeration Index and rurality categories were measured4. First, the index was calculated using population density, the proportion of the province’s population living in the municipal capitals, and the largest municipality’s population. From the index, three province categories were determined: urban, intermediate, and rural. The rural categories for intermediate and rural provinces were then established using the travel time from the provinces to the main city by private car on the road network4. However, this calculation was according to provinces in Colombia and lacks the level of detail needed to use its results to build public policies. The 27 municipalities in the department of Caldas are in only six provinces. This study should be done according to each municipality in the country and could be complemented using this methodology to determine the geographical accessibility, health, and higher education isolation of the regions.
Considering geographical accessibility for isolation typology, Caldas’ department is divided into two zones: the southwest as non-isolated and the northeast as isolated. In this sense, the road infrastructure network should be improved in the latter to connect these municipalities to the rest of the department and Manizales since some facilities (eg the third level of health care or universities) are only offered by the capital city.
Regarding health supply, Caldas has 10 municipalities in the first scenario 1 (12.2% of the department’s population), 16 in the second scenario (22% of the department’s population), and 23 municipalities in the third scenario (43.2% of the department’s population) with travel times of more than 1 hour to health services. This situation is better than that experienced in African countries such as Ghana and Uganda where more than 50% of the population is isolated from health facilities according to Agbenyo et al and Moro Visconti et al35,40. Three scenarios have higher population percentages than those shown by Sadoughi et al, where 10.3% of the population of Khuzestan province, Iran, is outside the health service delivery area33. In addition, expanding rural areas with a high presence of armed conflict have the highest travel times to health facilities, demonstrating the government neglect they have historically suffered.
Isolation typology for higher education institutions in the department of Caldas shows that 48% of the municipalities are isolated (23.3% of the department’s population) as they cannot reach any of the higher education institutions in less than 1.5 hours. Furthermore, only six municipalities can reach Manizales in less than 1.5 hours to access universities, (ie 39.5% of the department’s population is isolated in this scenario). Concerning these indicators, Walsh et al found that 29% of higher education students in Ireland live more than 75 km from their nearest university65. However, these indicators could not be compared because in Caldas the whole population was considered while in Ireland it was only higher education students. Moreover, the literature review showed no research on higher education and rural and remote areas.
Isolated regions are highly correlated with expanding rural municipalities with a high presence of armed conflicts, such as Samaná and Marulanda. Armed conflict increases the likelihood of isolation in rural areas42. This result shows the profound neglect that these regions have experienced from the government. For this reason, the guerrillas started the armed conflict 60 years ago and their bases were dispersed in rural areas46,69. With the peace treaty signed with the FARC-EP, the government must concentrate on closing the development gap in these regions47,48.
Conclusion
This research article shows a methodology for calculating the isolation typology of municipalities in the Caldas department in terms of geographical accessibility, health, and education access. Results were related to the IICA and rurality categories in Colombia. This method could be reproduced in other contexts and regions if necessary data are available. Policymakers and planners supporting decisions and investment in fields such as health, higher education, and infrastructure for rural and remote areas should use this method.
The definition of rurality in Colombia should be rethought by incorporating isolation typology variables into the population and territory variables normally used49, as CEPAL did in its 2017 index. However, CEPAL’s measurement was made before the 2018 national census, and they use provinces, a sum of municipalities to calculate rurality categories. This should be updated using data from the latest census and municipalities to make the index more accurate according to the specific conditions of each municipality4.
According to the variables used to measure isolation typology, Caldas needs improvements to the road infrastructure network to connect the department’s northeast zone better. Moreover, healthcare flow must be reorganized so that people can reach health facilities faster. Access to appropriate health care could represent life or death for many people in isolated municipalities.
Distance to higher education institutions is crucial for accessibility65-67; the department of Caldas has an unequal situation because 39.5% of the population is isolated from universities. Consequently, more higher education institutions should be opened in the department, particularly in the north, and the offer of university programs in the department should be expanded to improve access to this level of higher education. This could be done by opening new campuses in isolated municipalities or by promoting online courses.
In this study, travel time was used instead of travel distance, commonly used in the research literature on geographical accessibility to higher education65-67 – mainly due to the topographic conditions of Colombia and especially the department of Caldas, where road construction is difficult and costly, making operating speeds lower than countries with flat topography and better infrastructure. For this reason, this research considered travel time with realistic operating conditions using the Google Distance Matrix API57,58.
In terms of health, the typology of isolation could help the government to better plan care pathways for patients with different complexities. In addition, it could help determine the investment for upgrading an existing hospital or building a new one considering underserved areas. In terms of higher education, the isolation typology could help to understand where the underserved areas are and initiate investment policies to improve access to higher education for residents.
Municipalities such as Samaná and Marulanda, heavily affected by the armed conflict in Colombia, should receive special support from the national and regional government to close the development gap resulting from decades of armed conflict.
There are some limitations to this research as the dataset of education and health facilities in remote rural areas is difficult to obtain. There may be a lack of concordance between the data sources used in the analysis (Google data, OSM/Open Street Map, National Planning Department rurality categories, armed conflict index), as in most cases the available official data may report potential errors that cannot be verified in the field. Likewise, the technical validation of the estimated travel time used through the speed data of the vehicles in operation implies a constant updating of the database, as in this case the results are related to a static situation, and the operating speed varies throughout the day, season of the year, etc. Another limitation is the absence of information regarding the motivations of citizens when traveling within the region (eg for work, recreation, education), which means that the research does not take into account an origin–destination matrix, a variable that could be included in future research.
Acknowledgements
The authors express their sincere thanks to the Sustainable Mobility Research Group (GIMS), as well as to the Faculty of Engineering and Architecture of the National University of Colombia and the Ministry of Science and Technology of Colombia, making it possible thanks to the support of Jóvenes Investigadores e Innovadores (Young Researchers and Innovators Program), call 812 of 2018.