Introduction
The coronavirus disease 2019 (COVID-19) is a global pandemic, with more than 31 million cases reported in the USA and deaths approaching 600 000 by April 2021.1 Case and death rates vary by state and county, as outbreaks and new hotspots have begun shifting from more densely populated urban areas to smaller and more rural municipalities.2,3 Broadly, characteristics associated with poor COVID-19 outcomes, such as older age, fewer health care providers per population, and poorer general health, are more prevalent in rural communities.4-7 Specifically, predicted COVID-19 case fatality rates have been shown to increase as counties become more rural.8,9
The Centers for Disease Control and Prevention and the World Health Organization have recommended the widespread use of face masks in public to limit the spread of COVID-19,10,11 due in part to confirmation of disease transmission by asymptomatic individuals.12,13 Face masks are one part of a broader strategy to curb disease transmission, which also includes physical distancing, rapid testing and contact tracing. Lyu and Wehby recently demonstrated a significant association between state policies mandating the use of face masks and a reduction in daily COVID-19 incidence14. Similarly, a study by Van Dyke and colleagues in Kansas demonstrated that daily case rates decreased in counties that implemented face mask mandates, while daily case rates continued to increase in counties that opted out of the mandate15. Both reports highlight the importance of health policy during pandemics and states of emergency. However, individual-level measures of mask wearing are also needed, as some communities or populations may continue to be reluctant to wear a mask in spite of state laws. For example, the effect of state mandates on COVID-19 incidence rates may vary depending on an individual’s perceived risk. While several studies have investigated perceived risk of COVID-19,16-18 none have incorporated the interaction between perceived risk and state mandates.
Several demographic characteristics have also been shown to be positively associated with mask wearing, including non-White race/ethnicity and older age.19,20 Women have been shown to be more likely to wear masks than men,20 due in part to the role of toxic masculinity and affective responses among some men.21 In addition, an observational study conducted in the summer of 2020 in Wisconsin found that urban/suburban shoppers were much more likely than rural shoppers to wear a mask (48% v 20%, respectively).19
Scientifically correct and consistent health communication during pandemics is critical but faces challenges, including streamlining and expediting communication between government officials, health providers, the scientific community, the media, and the public.22 Other factors that complicate the public’s adherence to public health recommendations include information overload, information uncertainty, and misinformation.23 A high or increasing COVID-19 incidence rate is likely one factor that affects mask-wearing behavior, as individuals in counties with only a few reported cases may have a low sense of personal risk, even in the midst of a global pandemic. Political partisanship has also been shown to be associated with COVID-19 preventive behaviors, such that more right-leaning individuals tend to be less likely to take preventive measures such as quarantining and social distancing.24
Studies have shown that retention of health messaging is lower in rural versus urban or suburban areas,25 and the meaning of health may be socially constructed differently within populations.26 For example, distrust of medical providers and perceived outsiders may be embedded in some rural communities.27 As a result, COVID-19 messaging about masks from federal or state authorities may be viewed cautiously by rural residents.28 Additionally, perceived susceptibility to a disease is a key factor in the success of public health campaigns,29 which highlights the implications for how messages should be prepared and disseminated to subgroups within rural areas.
Methods
Data sources and variables
The New York Times’ mask-wearing survey data30 (maintained by the New York Times COVID Data Repository)31 to calculate the percentage of county residents who responded that they always or frequently wear a mask in public when they expect to be within six feet of other people. Survey response options included wearing a mask in public always, frequently, sometimes, rarely, or never. The mask-wearing survey was administered by the global data and survey firm Dynata on behalf of the New York Times. The survey was cross-sectional and completed online by roughly 250 000 participants between 2 July 2020 and 14 July 2020. The survey data were weighted by age and gender, then weighted survey responses were transformed into county-level estimates. The weighting strategy used to derive the final analytic dataset has been described in further detail by the New York Times and Dynata.30
The focal independent variable was a county-level indicator for rurality. Definitions of rurality differ, and it is incumbent on researchers to clearly describe rurality metrics in research, while also considering additional factors related to geography and environment that affect health.32 The Index of Relative Rurality (IRR), which was developed by Waldorf and Kim,33 was used as an alternative to threshold-based or categorical measurements of rurality, like the Rural/Urban Commuting Area Codes,34 for example. The IRR is a continuous measurement and ranges between 0 (very urban) and 1 (very rural). IRR scores are at the county level and account for several geographic and population characteristics, including population size, population density, remoteness, and built-up area. For a county-level map illustration of mask wearing and rurality across the USA, each county was color coded based on nine combinations of low/mid/high mask wearing and low/mid/high rurality. For the map only, low/mid/high were defined by the 16th and 84th percentile distributions of mask wearing and rurality.
Also considered were several county-level variables that likely confound the relationship between rurality and mask wearing. The New York Times’ COVID-19 Data Repository was used to obtain case counts for all counties with at least one case. Dates were restricted to the 2 weeks before the mask survey was administered, or between 15 June 2020 and 1 July 2020. The mean daily case rate per 100 000 county residents was calculated for each county, using total county population estimates from the US Census Bureau’s American Community Survey.35 A continually updated, online report published by the American Association of Retired Persons36 was used to define whether a county was in a state whose governor had issued a statewide mask mandate by 15 July (California, Connecticut, Delaware, Illinois, Maine, Nevada, New Mexico, New York, North Carolina, Oregon, Rhode Island, Virginia, Washington). Presidential election data for 2020 were used to determine the percentage of a county that voted for the Republican candidate, sourced from publicly available data that was aggregated from several national news organizations.37 Additional variables were sourced from the Robert Wood Johnson Foundation’s County Health Rankings dataset.38 Included as covariates were the percentage of a county that is non-White, female, and aged 65 years and older. Also included was a county-level indicator for income inequality, which is the ratio of the household income at the 80th percentile of the distribution of household income values to that at the 20th percentile.
The final sample included counties that had at least one COVID-19 case reported during the study time frame and had complete information for all study variables (n=3103 counties), representing 99% of all 3141 US counties.
Analysis
All analyses were conducted using SAS software v9.4 (SAS Institute; http://www.sas.com). Descriptive statistics for the sample of 3103 counties were reported, as well as characteristics for five counties with the highest mask-wearing percentages and five counties with the lowest mask-wearing percentages. Always or frequently wearing a mask was modeled using multivariate linear regression, adjusted for the focal independent variable IRR, as well as all confounders. Derived from the output of the multivariate model, the authors then plotted the predicted values for the percentage of a county’s residents wearing masks across levels of IRR, adjusted for daily case rates and confounders.
Ethics approval
This study was determined non-human subjects research by the University of Arkansas for Medical Sciences' Institutional Review Board (approval number 261595).
Results
Across 3103 counties, the majority of county residents reported wearing a mask always or frequently between 2 July and 14 July 2020 (median = 72%; Table 1), and the median IRR score was 0.52. The median daily COVID-19 case rate between 15 June and 1 July 2020 was 243 per 100 000. The five counties with the highest percentages of mask wearing were in California, Virginia, and Florida (average IRR score = 0.42; Table 2). The average IRR score for the bottom five counties was 0.55, or more rural. The most apparent cluster of high rurality and low mask wearing spanned the Midwest, upper Midwest, and mountainous West (Fig1).
In multivariate regression analyses, an increase in rurality was significantly associated with a decrease in mask wearing (β=–0.560; p<0.0001) (Table 3). In addition, compared to residents in counties without a statewide mandate, those in counties with mandates were more likely to wear a mask (β=0.090; p<0.0001). The percentages of county residents who were non-white (β=0.002; p<0.0001) and aged 65 years and older (β=0.004; p<0.0001) were positively associated with mask wearing. Conversely, higher percentages of county residents who voted for the Republican presidential candidate in 2020 were associated with a decrease in mask wearing (β=–0.084; p=0.013). No association was identified between income inequality and mask wearing. The adjusted predicted values for the percentage of county residents wearing a mask are illustrated in Figure 2.
Table 1: County characteristics (n=3103 counties)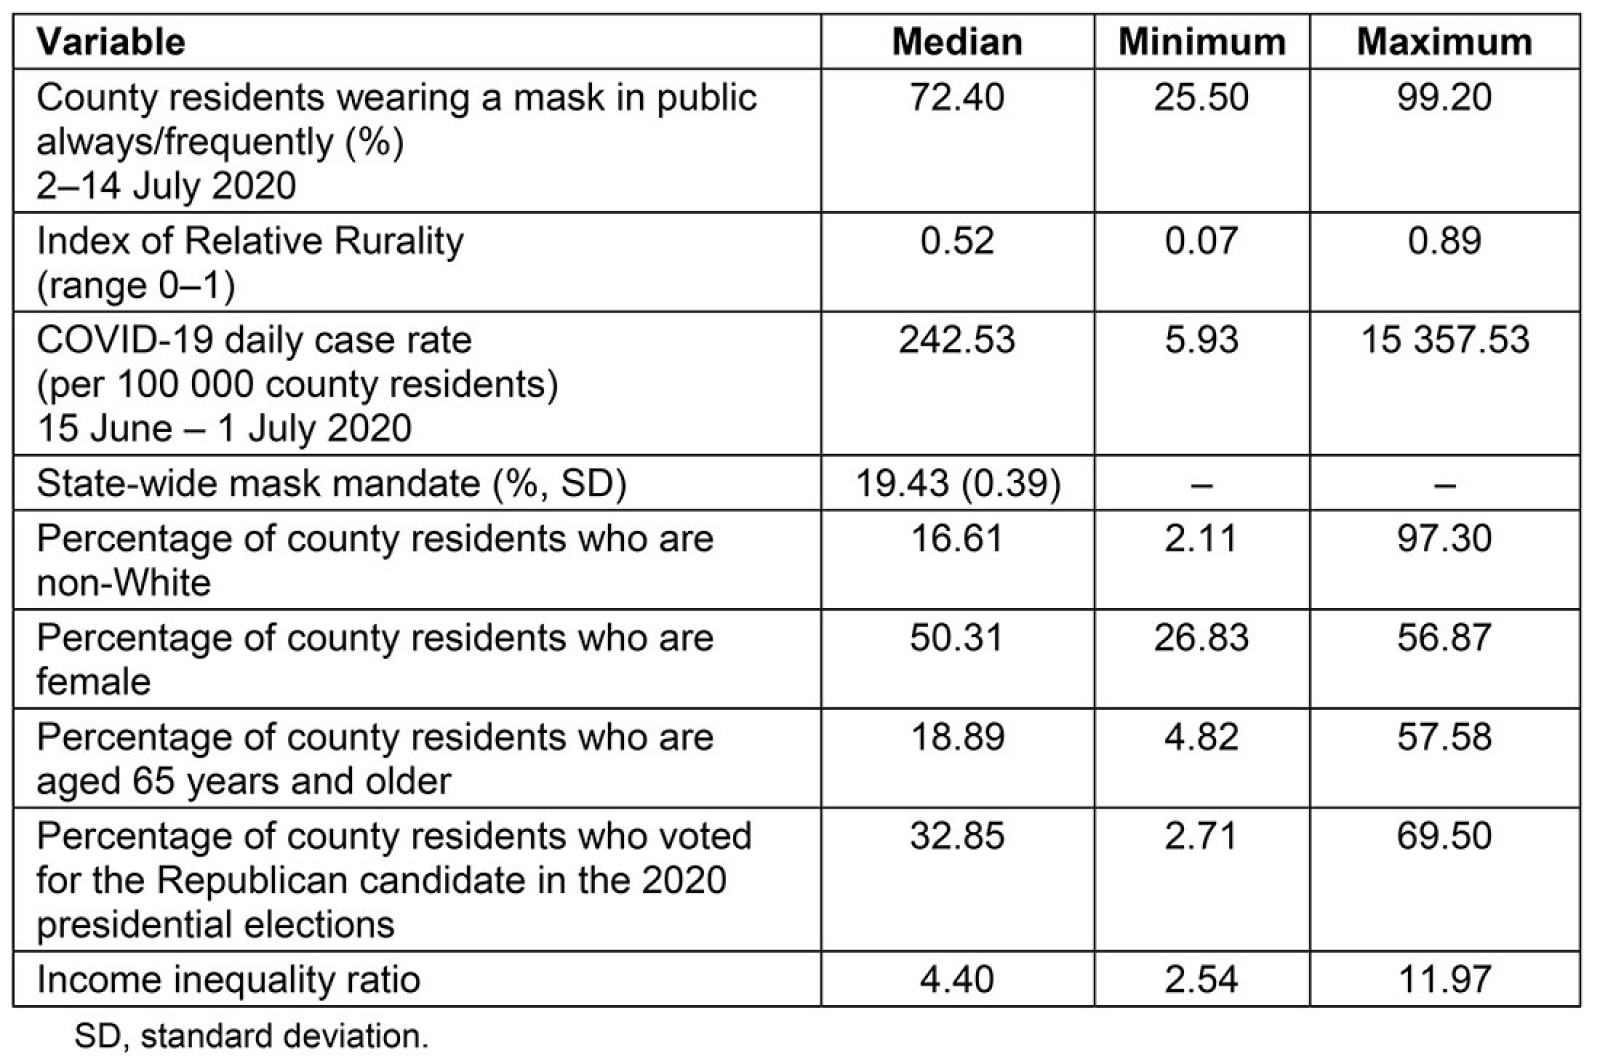
Table 2: Characteristics of top five and bottom five counties by mask wearing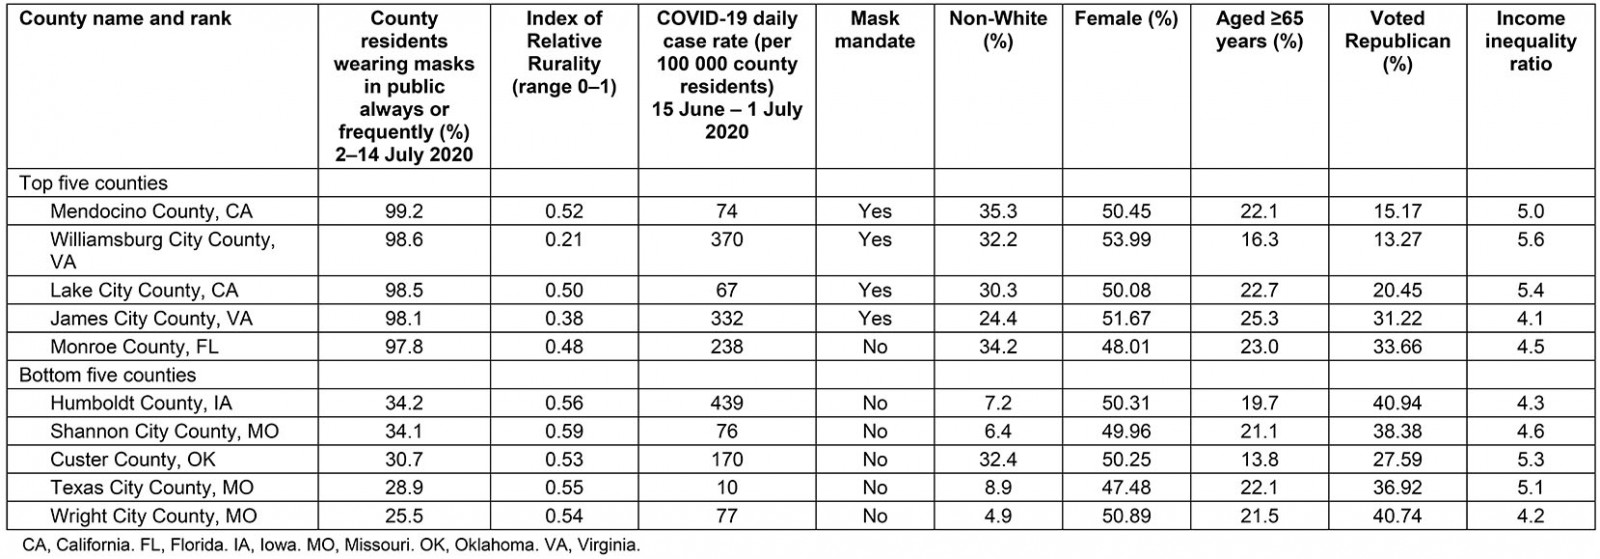
Table 3: Multivariate linear regression modeling mask wearing, 2–14 July 2020 (n=3103 counties)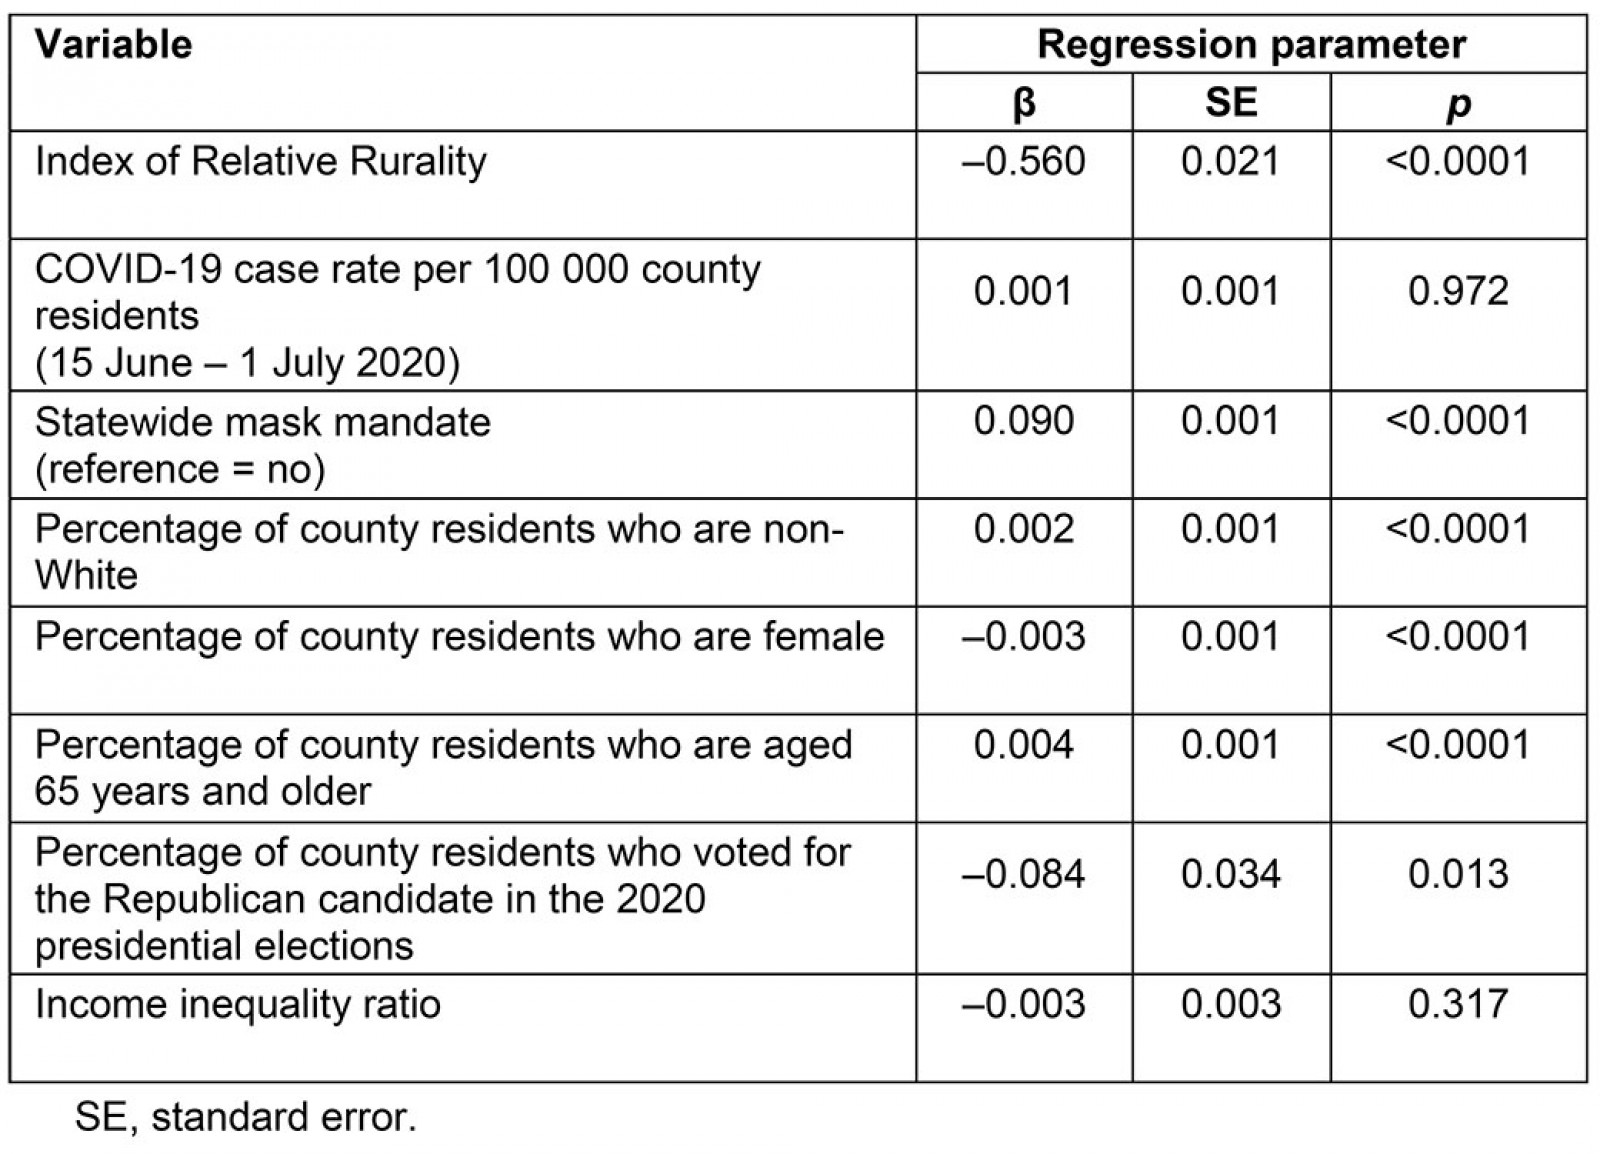
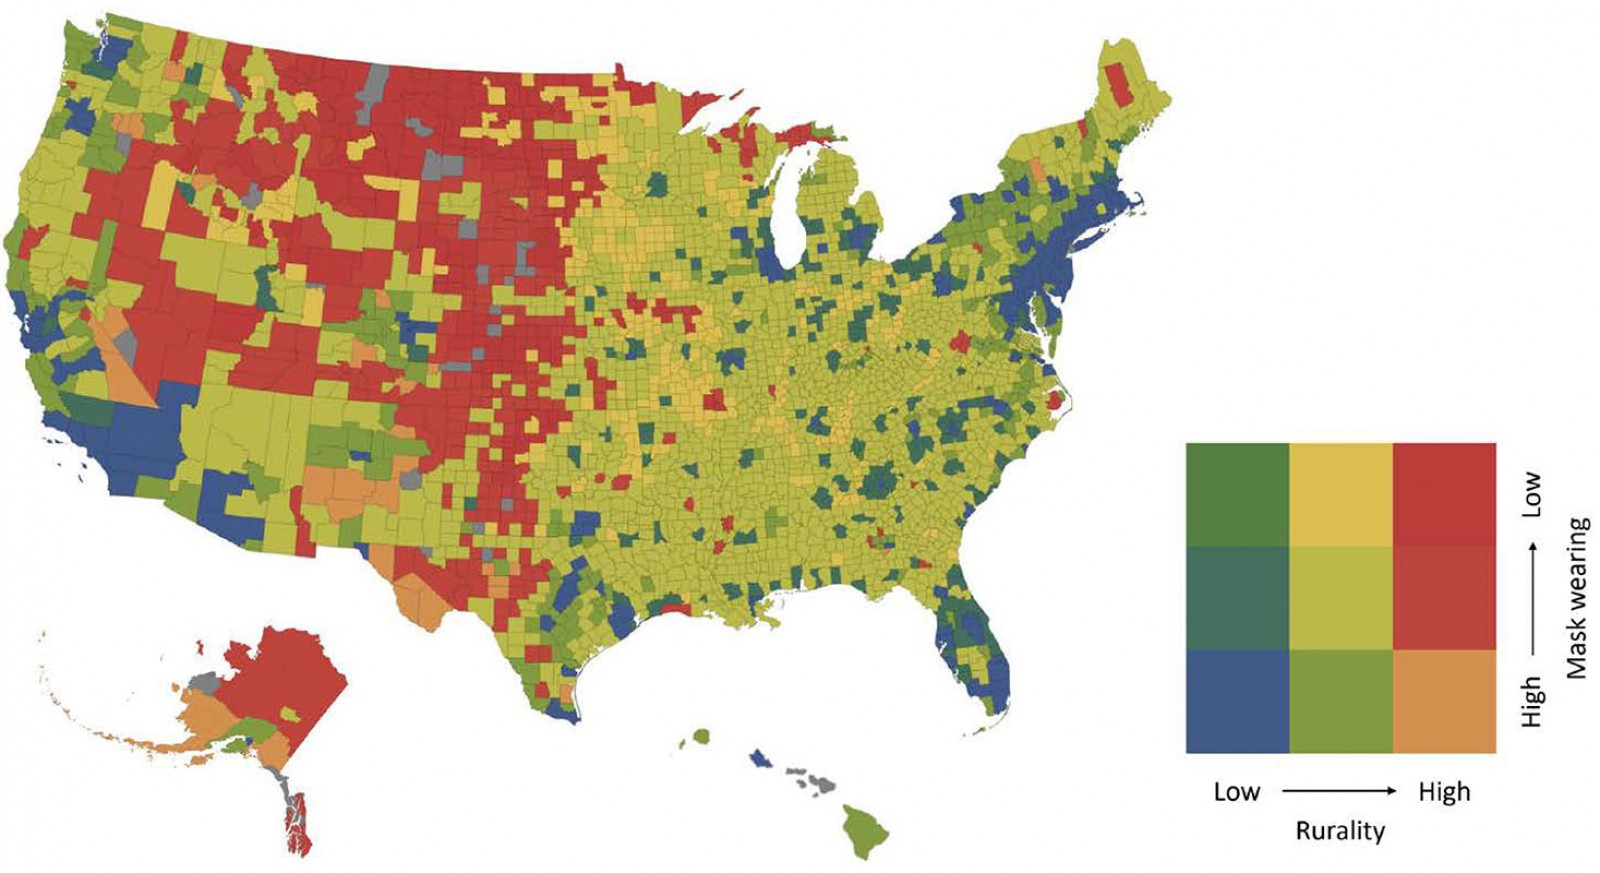 Figure 1: County-level map of mask wearing and rurality.
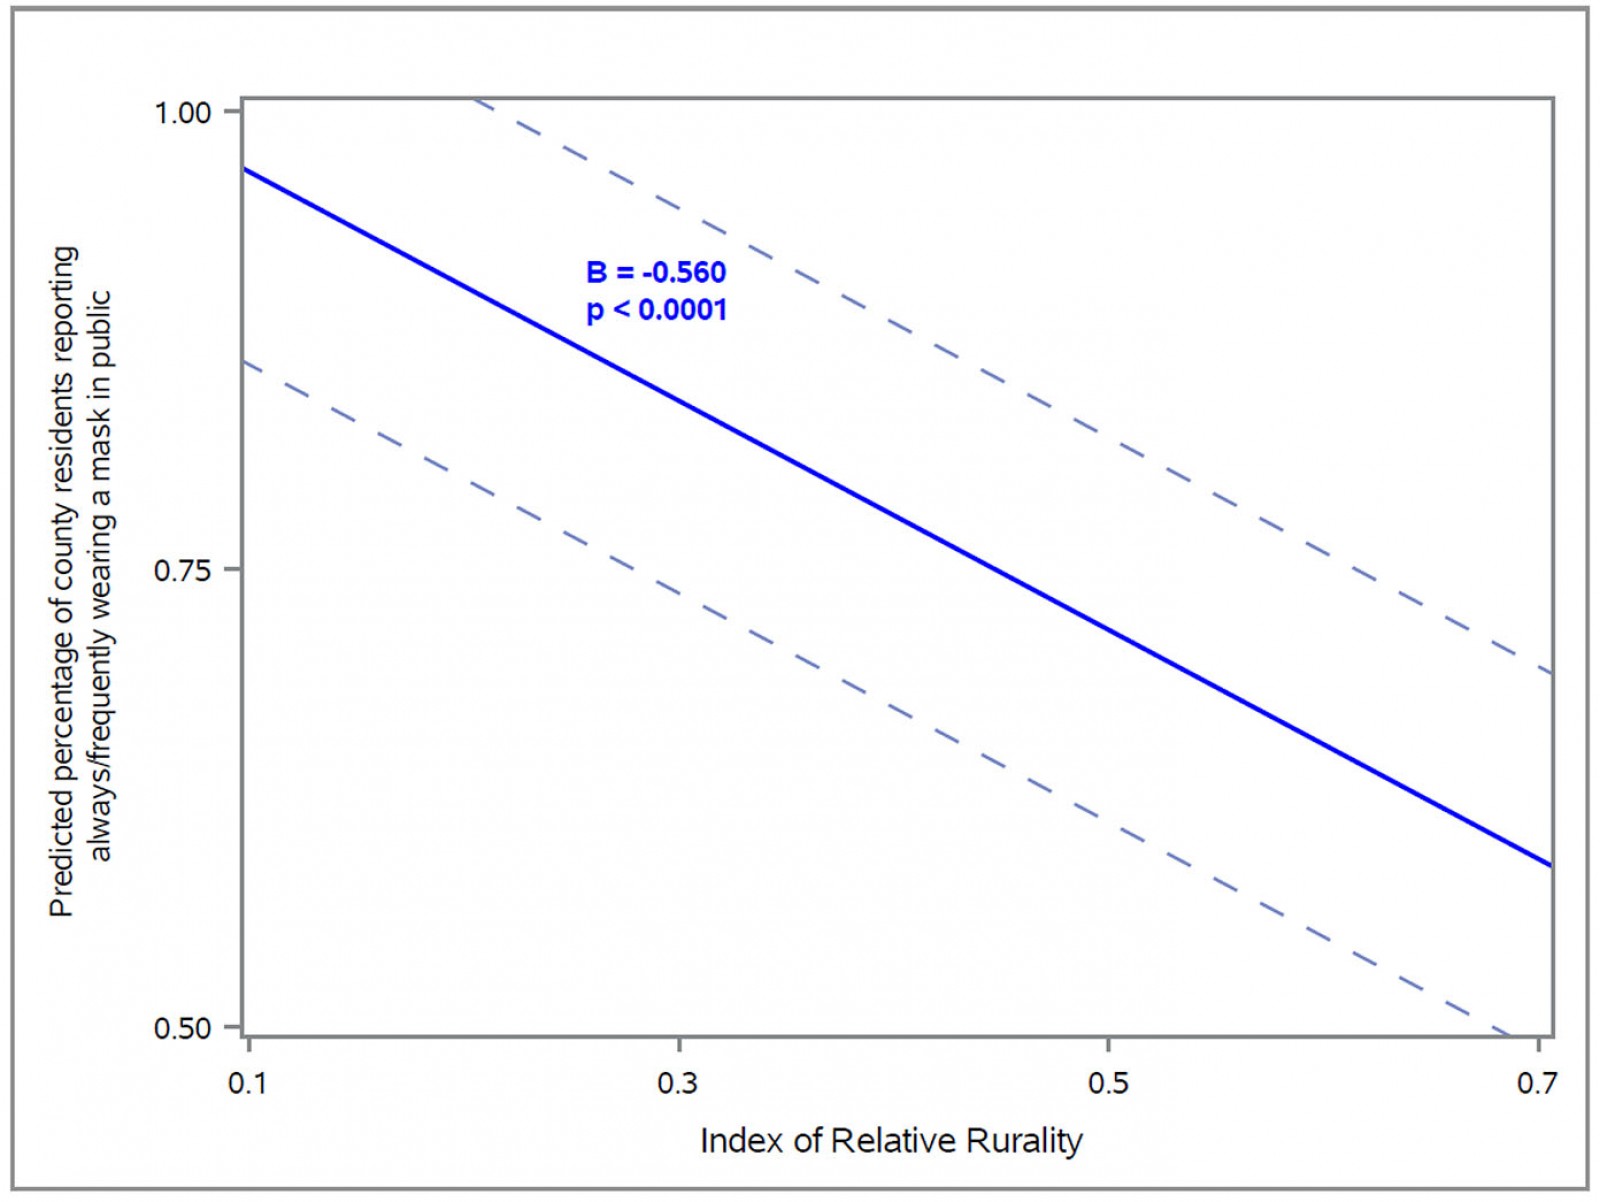 Figure 2: Adjusted predicted probability of mask wearing across levels of rurality.
Discussion
Face masks are a critical preventive measure to curb the ongoing spread of COVID-19. The present analysis included nearly all US counties and our results are broadly representative of national trends. In the adjusted model, mask wearing became significantly less likely as the level of rurality increased, after holding constant case rates, race/ethnicity, age, gender, political partisanship, and socioeconomic disparities. The study’s national findings are aligned with previous state reports that mask wearing is less common in more rural areas.19 Case rates were hypothesized to have an impact on perceived risk and mask-wearing behavior, because perceived susceptibility is a key cue to action.39 However, case rates during the 2 weeks prior to the mask survey were not associated with subsequent mask wearing. Also identified was a relationship between Republican-leaning counties and lower rates of mask wearing, which is very likely attributable to contradictory messages about masks and the overall severity of the pandemic exhibited by the Republican presidential candidate. For example, perceived susceptibility to COVID-19 may be related to messaging by many elected political leaders and popular media outlets who publicly questioned the importance of mask wearing, which likely decreased many individual’s perceptions of susceptibility.40-42 Other reports have also identified associations between more conservative political ideologies and less mask wearing.43 The present findings highlight the need to better understand the personal, geographic, and political mechanisms underlying health behavior and factors that drive individual perceptions of COVID-19 risk.
Research shows that the small size and tightly knit social structures of rural communities can foster community resilience.44,45 Rural social networks are critical to supporting behavior change and have shown to be influential in a variety of public health areas.46,47 For example the Popular Opinion Leader model, utilized to promote HIV risk reduction, posits that behavior change is achieved when new risk-reducing methods are disseminated by social network opinion leaders through their personal contacts.48 In the COVID-19 pandemic, rural community influencers should be trained and given resources to connect community members with health services, reduce disease stigma, discuss the benefits of mask wearing, and provide accurate, up-to-date epidemiologic information in their area. Faith leaders are one such group that have been shown to effectively disseminate public health information in rural communities.49,50 Adapting the Popular Opinion Leader model to enhance mask wearing is one example of adapting existing interventions to complement other public health efforts during the COVID-19 pandemic.51
Potential limitations
Several additional potential confounders are important to consider, but county-level data were not available and therefore not included in the multivariate model. County-level confounders may include the frequency and style of mask communication campaigns, information about social networks and peer mask-wearing behavior, and an indicator of each county’s enforcement of mask mandates.
Conclusion
Wearing a face mask during a viral disease pandemic is a preventive strategy that reduces transmission and decreases mortality. Despite this, adherence to wearing a face covering in public varies widely by geography and rurality. Holding the case rates and other county-level characteristics constant across all US counties, the present study found that individuals in rural counties were less likely than their more urban counterparts to wear a mask. This is particularly concerning in light of recent surges in cases, hospitalizations, and deaths in rural communities.3 Activities centered around public health prevention and education should be grounded in behavior change theories while focusing on the unique strengths and assets of rural communities.
Acknowledgements
The authors thank Dr J. William Pro for assistance with creating the US map. This work was partially supported by the Northern Arizona University Southwest Health Equity Research Collaborative (NIH/NIMHD, Grant #U54012388).
References
You might also be interested in:
2014 - Gestational diabetes in a rural, regional centre in south Western Australia: predictors of risk
2009 - Youth alcohol and drug use in rural Ireland - parents' views


