


Introduction
The Bahamas is a nation of more than 388 000 residents, an archipelago of more than 700 islands, of which 30 are inhabited1. The import and export of food items to and from The Bahamas is made more costly and labor intensive by the island’s remote status, decreasing the amount of diverse and nutritious food available to Bahamians. Over 70% of the population of the nation resides in New Providence, where the capital, Nassau, is located. The most recent poverty data available are from 2013, when 12.5% of the Bahamian population lived on B$1.25 (US$1.25) per day or less1.
Research on Bahamian food prices conducted in 2017–2018 further raises questions about the cost of a healthy diet2. Local food, while generally less expensive, is difficult to find in stores as 90% of the nation’s food is imported3. Imported foods tend to be costly; as much as B$12 for a gallon (approx. 3.8 L) of milk, for example, and these imports are generally heavily processed and laden with sugar, salt, and fat2. These costly imports disproportionately affect poorer households, limiting access to diverse and healthier foods4. In response, substantial efforts have been made to help improve access to local food, including an investment started in 2014 to develop the 50 ha (124 acre) Bahamas Agriculture and Marine Science Institute on Andros Island, as well as the development of a plan called Agri-Vision 2021, which sought to establish more than B$500 million in local production5.
At the same time, health concerns in The Bahamas related to diet-related disease and dietary quality are increasing. From 2005 to 2012, the percentage of overweight people in The Bahamas increased from 70.5% to 79.2%, respectively3. Such increases raise significant public health concerns, as overweight and obesity increase risk for developing further chronic non-communicable diseases such as heart disease, stroke, and diabetes, which represent four of the top five of the major causes of death for the nation1.
The Food Insecurity Experience Scale (FIES) is one of four scales developed by the Food and Agriculture Organization (FAO) of the UN. Designed in the context of the Voices of the Hungry project, the purpose of the FIES is to measure food insecurity through individuals’ lived experiences. In 2017, the UN recommended use of the FIES tool as a global mechanism to monitor progress on the eradication of hunger and is recommended for global use under the Sustainable Development Goals framework6. Although the tool is used globally, there are no reports of its validity for The Bahamas7, nor have prevalence rates of food insecurity ever been reported for the island nation. Prevalence rates of moderate or severe food insecurity are necessary to understand Bahamians’ access to affordable, healthy food. Furthermore, FIES survey answers provide a unique characteristic profile of food security when utilized in different regions. Moderate food security refers to the lack of consistent access to food and is an indicator of diminished dietary quality, quantity, and disrupted eating patterns. Severe food insecurity is a worse condition, whereby persons have run out of food for a day or days. Both conditions are associated with hunger, and compromised health and wellbeing7.
In 2016 a comprehensive, collaboratively developed working document, the National Development Plan ‘Vision2040’, was issued by the Bahamian government to provide guidance for future policy efforts and create a framework for goals and objectives across four main policy pillars: the economy, governance, social policy, and the environment. The plan most directly emphasizes the critical nature of food security in its ‘Strategy 7.1: Achieve food security and end hunger’ section, and calls for improved data collection as part of its monitoring and data collection framework8. This article responds to this call by examining the validity and reliability of the FIES for The Bahamas prior to Hurricane Dorian and the COVID-19 pandemic. Further, the authors examine levels of moderate and severe food insecurity as well as their relationship to sociodemographic factors.
Methods
Sampling
A landline telephone survey was conducted in New Providence (Nassau), the most populous Bahamian island, between June and July of 2017. A local survey research firm, Public Domain Research and Strategy, in conjunction with the established non-profit Hands for Hunger, was responsible for conducting interviewer-assisted surveys by telephone. Given that there is no public record of phone numbers in The Bahamas, a combination of three-digit constituency codes and seven-digit random numbers was used to generate plausible phone numbers. The three-digit constituency codes were selected based on the 2010 census for the purpose of limiting participants to the New Providence region. Calls were made repeatedly until the quantity of survey participants reached a sample size large enough to produce a reliable validation of the FIES (Lesson 3; 9). Calls made to invalid phone numbers were disregarded.
The process yielded a sample of 1000 Bahamians from the New Providence region. Data were then weighted using a simple iterative proportional fitting method (ie raking) where each case weight was adjusted until the sample distribution aligned with the last known population parameter for the demographic variables of age and gender. Weights were calculated based on the known marginal proportions as well as by two-way cross-classification for the pair of demographic variables, and were based on data reported in the 2010 Bahamas Census, the most recent census. Weighted data were used for all analyses.
Measurement
The survey included a total of 24 questions divided into two subsets of items: questions ascertaining participants’ sociodemographic characteristics as it made up the sample, and questions explicitly assessing participants’ individual level of food insecurity using the FIES tool.
Sociodemographic survey: Sixteen items in the survey captured demographic characteristics known to impact food insecurity. Individual-level variables included age, gender, education, and employment status. Household-level variables included ownership status, household size (ie number of members), household type, total income, and health risks.
Food Insecurity Experience Scale survey: The FIES was developed by the UN FAO10. The FIES is an eight-item questionnaire about experiences with food insecurity that can be implemented at the individual level or household level. It has also been implemented with various reference periods (ie 30 days or 12 months). For this study, participants were asked to reflect on their individual experiences within the past 12 months. Table 1 shows the FIES items as they were phrased to participants, the order in which they were asked, and names customarily used to refer to the items. Each FIES item is related to a unique aspect of food insecurity as determined by a meta-analysis of food insecurity scales and ethnographic studies from around the world11-13. By utilizing the tool in diverse regions, especially in rural and remote areas, which are more likely to have unique food systems due to their isolation, the FIES tool shows how the extent and signifiers of food security differ across the globe11. A minor modification was made to the HEALTHY item to clarify that the question is focused on the quality rather than the quantity of available food. The survey was conducted in English.
Table 1: Food Insecurity Experiences Scale for The Bahamas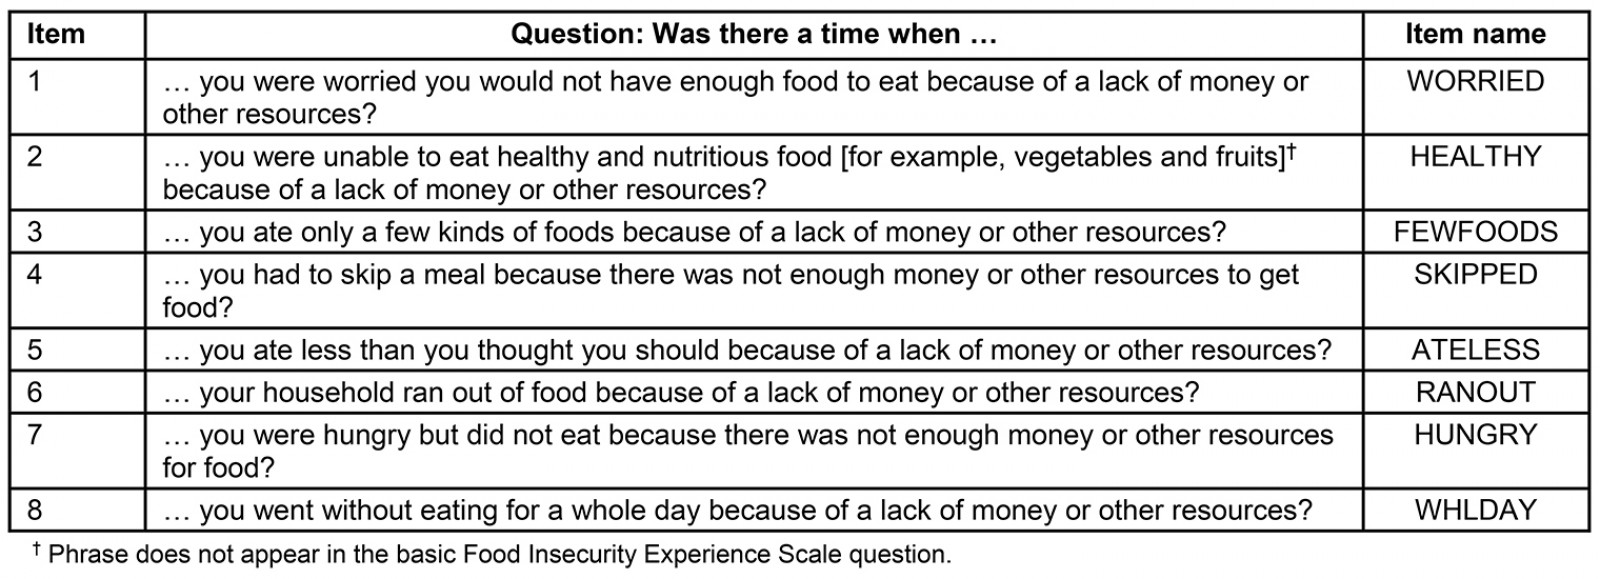
Statistical analyses
The analyses of the sample data were conducted at the University of Delaware’s Center for Research in Education and Social Policy in R using the RM.weights package v 3.6.3 (https://www.r-project.org)14,15. Although other software can be used to conduct Rasch analysis, the FAO elearning Academy 9 provides explicit instruction (See ‘Lesson 3 – Statistical validation of FIES data’ and ‘Lesson 4 – Using the FIES data to calculate food insecurity prevalence rates’) on how to use the RM.weights package to validate the FIES to facilitate equating and comparison to the FIES global standard scale 10,14-16.
Descriptive statistics: Frequencies were calculated to describe the characteristics of sample and sociodemographic subgroups. Weighted percentages were calculated to adjust for the parameters of the population. Percentage of missing data was calculated for each variable.
Rasch modeling: Following the FAO e-learning Academy course guidelines9, Rasch modeling procedures were used to generate information about the FIES (ie item parameters) and about the population of interest (ie respondent parameters). Item parameters provide information about whether the FIES is a valid and reliable measurement tool for the sample. In addition, item parameters allow for an assessment of whether individual items are redundant or uninformative for the given sample and/or whether the relative severity of items differs compared to applications among other samples. Respondent parameters provide information about participants’ degree of food insecurity. In accordance with FAO guidelines, participants with a missing response to any of the eight FIES items were excluded from the analysis. Also, to avoid biased estimates, participants with extreme scores of 0 or 8 (ie responding ‘no’ to all items or ‘yes’ to all items, respectively) were excluded. The analysis also included examining FIES item difficulty as part of the scale equating process. In this context, item difficulty is conceptualized as how difficult it is for a respondent to answer ‘yes’ to each food insecurity question included in the scale. The probabilities are calculated using a normal probability distribution that accounts for the person parameter and measurement error generated by the Rasch analysis.
Equating: The equating process was completed using the ‘Lesson 4 – Using FIES data to calculate food insecurity prevalence rates’ guidelines and the recommended FAO Excel template9,10. Equating procedures serve two purposes: first, to calibrate this study’s results to the global FIES reference scale; second, to compute internationally comparable prevalence rates of both moderate and severe food insecurity, and of severe food insecurity. In aligning responses to the FIES reference scale, item parameters are an estimate of the severity of the items on a logit scale with a mean of 0 and standard deviation of 1. The numeric value of an item parameter cannot be interpreted per se, but higher values are associated with greater food insecurity, akin to item difficulty. Also, prevalence rates of moderate and severe food insecurity are calculated as the sum of the products of the weighted percentage of the population and the probability.
Regression analyses: General linear modeling procedures were used to explore the degree to which sociodemographic variables and household-level health risks explain variances in food insecurity as measured by the FIES. Using 932 complete cases, the total FIES score was modeled using sociodemographic variables and household-level health risks with low rates of missingness. A stepwise selection procedure was used to add variables to the model in the order of their contribution to the variation explained, and to remove variables rendered insignificant by the addition of other significant variables to the model.
Ethics approval
All methods for this study, including analysis of the de-identified secondary data collected by Public Domain Research and Strategy and Hands for Hunger, were reviewed and approved by the institutional review board (IRB) of the University of Delaware. The approval number is 1581094-1. Local IRB approval was not applicable as original data collection occurred through a partnership of for-profit and non-profit organizations. UD analyzed the resulting secondary data. Written consent for participation was obtained from all participants.
Results
Sample characteristics
The sample included 1000 Bahamians aged 18 years or more (Table 2). Just over half of the same sample were women (52.2%). The majority were under the age of 55 (82%). Although many participants graduated from high school (41.5%) and college (25.4%), the sample also included some participants with less than a 12th-grade education and others with graduate degrees. A large proportion of participants did not respond to questions about employment, housing, household income, household size, and household composition; therefore, those variables were not included in further analysis. As shown in Table 3, most participants reported they were not (or were not aware of) living in a household with someone with diabetes, high blood pressure, obesity, heart disease, or cancer.
Table 2: Sociodemographic characteristics of respondents (n=1000)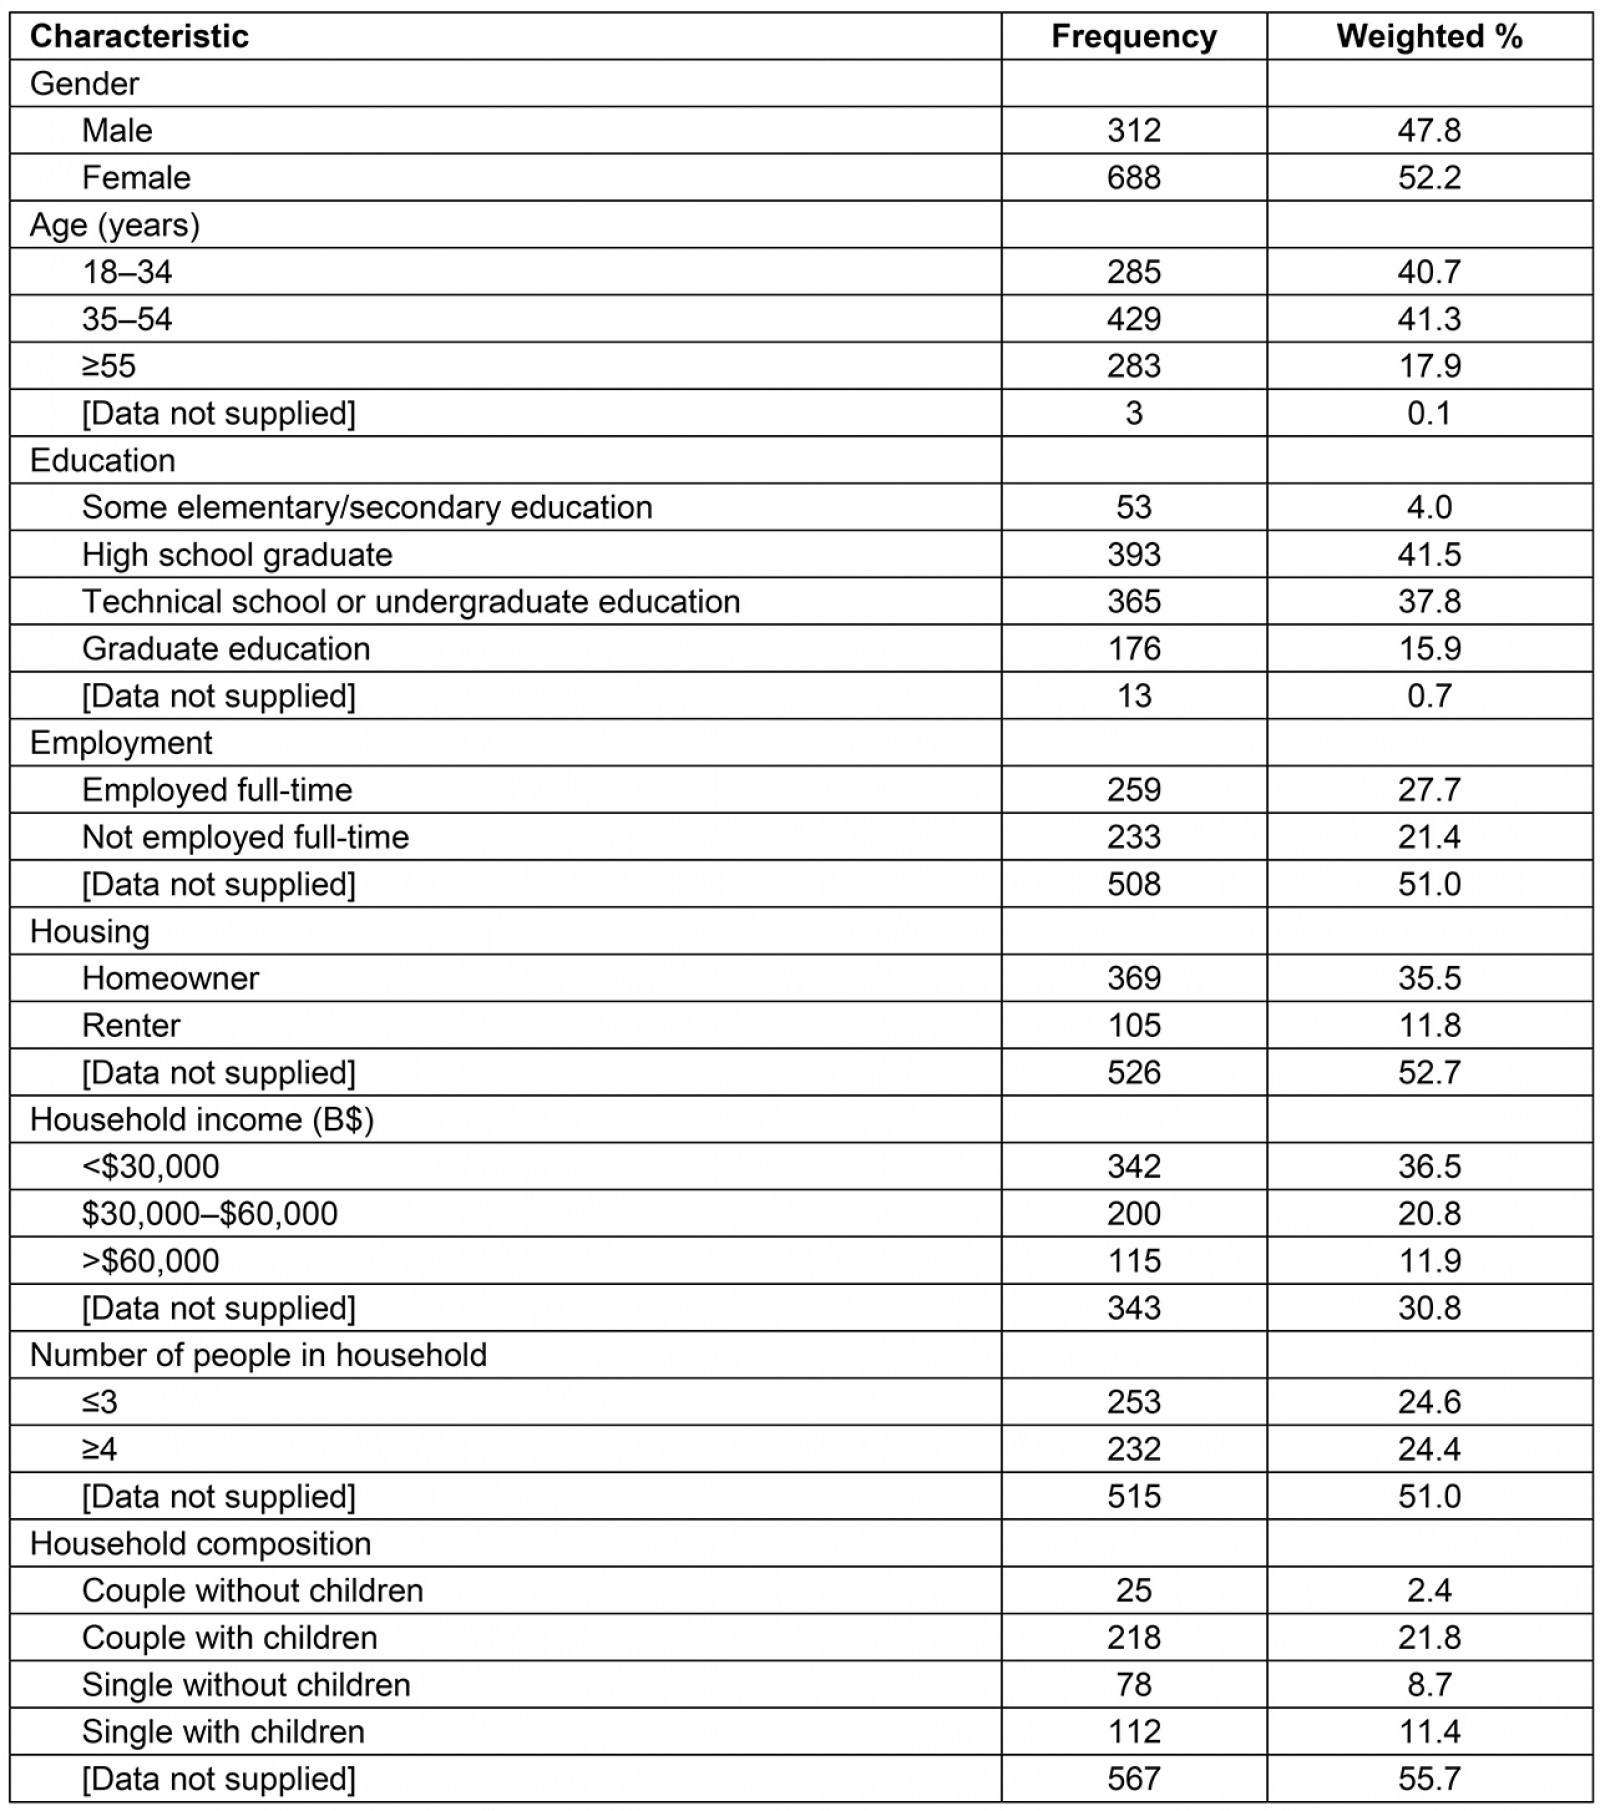
Table 3: Household-level health risks (n=1000)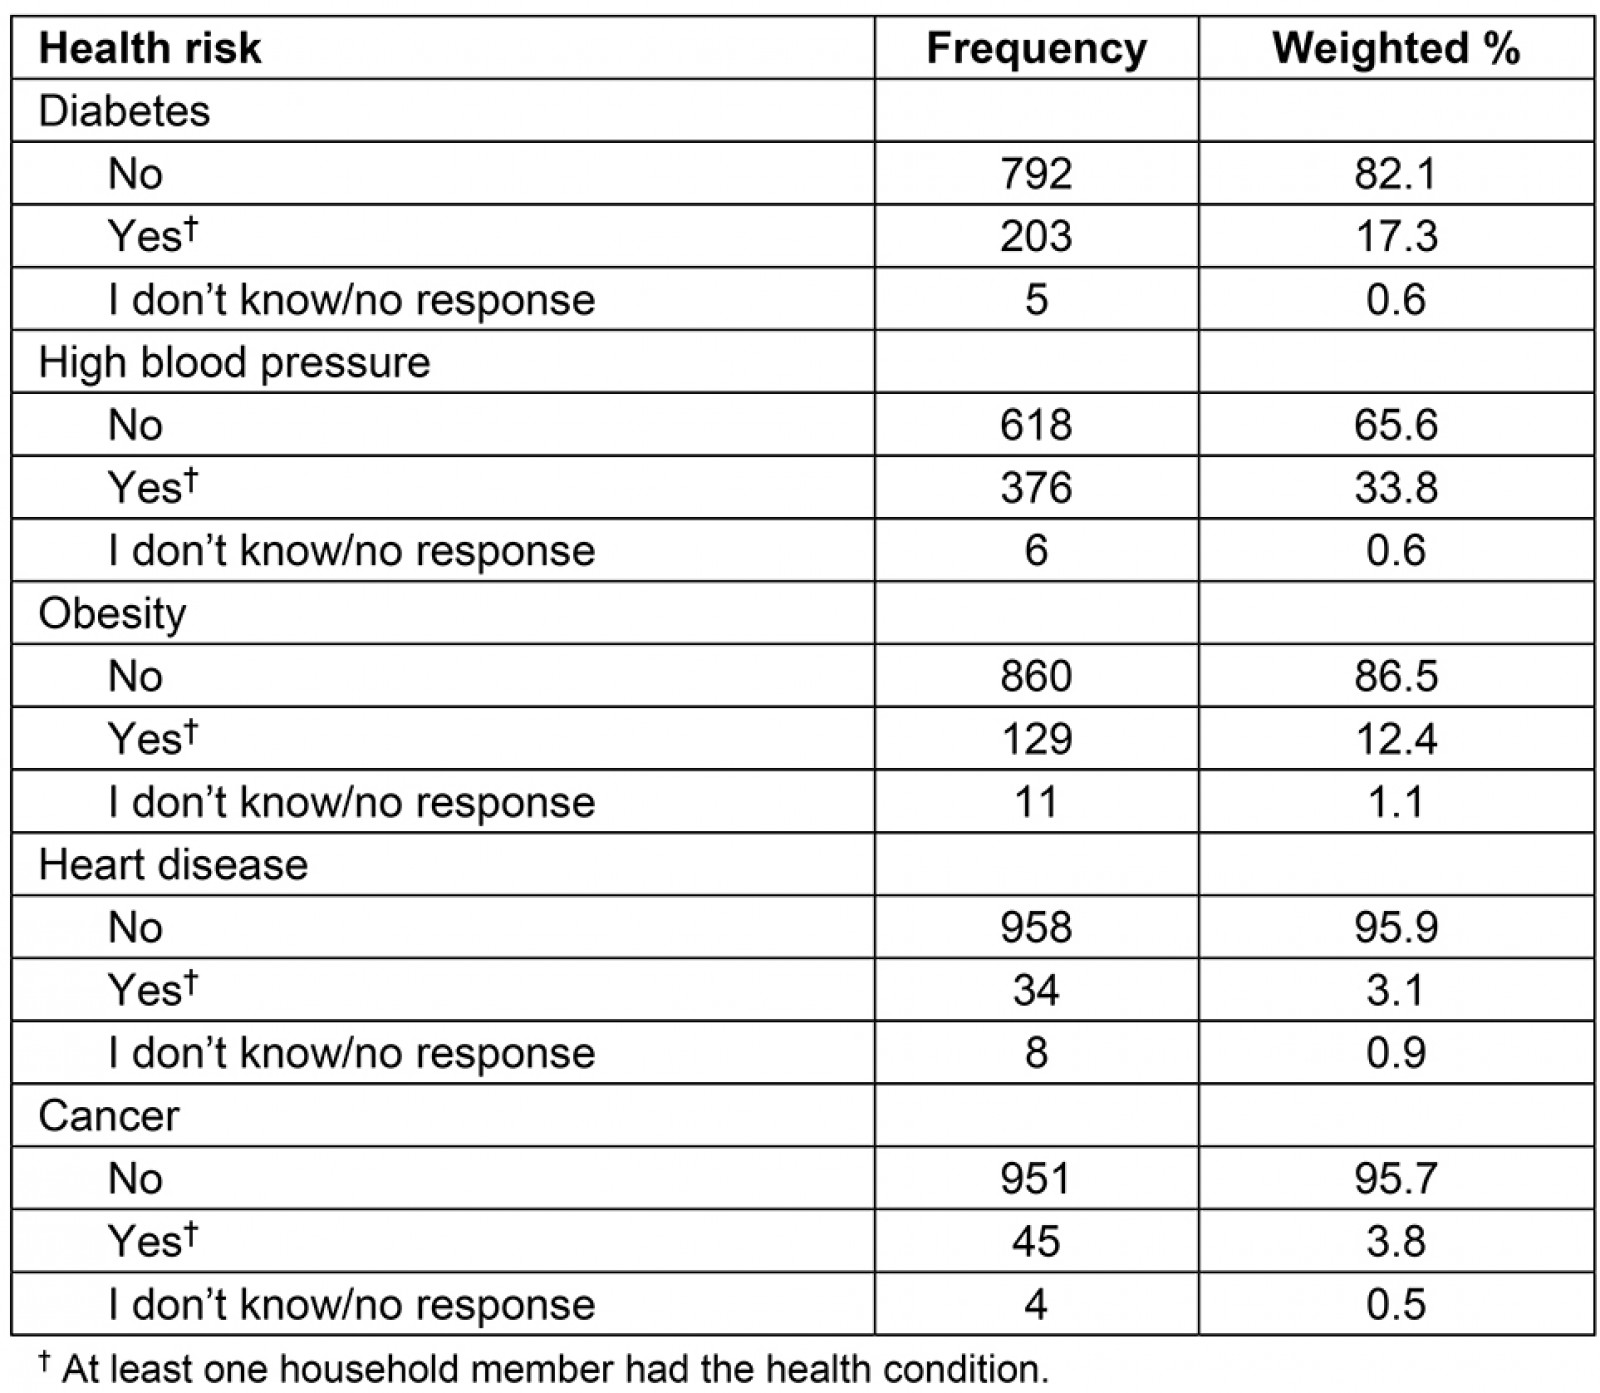
Item parameters and Food Insecurity Experience Scale validity
Preparation for the Rasch analysis included the removal of 38 participants with incomplete responses to the FIES survey, 572 participants with an extremely low FIES score, and 59 participants with an extremely high FIES score. These cases were outliers and excluded from the creation of FIES item parameters. The remaining 331 participants constituted a sufficiently large sample size to generate reliable item parameters10,16,17.
The infit statistics were close to 1 (ie within the acceptable range of 0.7–1.3) for each item, suggesting all items performed well for this sample (Table 4). The outfit statistics, none of which surpassed the acceptable maximum of 2, indicate that no items were sensitive to outliers with unusual responses. The residual correlations were low enough (<0.4) to infer that each item captures a unique aspect of food insecurity. The overall Rasch reliability (0.698) provides evidence that the scale effectively discriminates between respondents who had more or less food insecurity.
Table 4: Item parameters and fit statistics of Food Insecurity Experience Scale in The Bahamas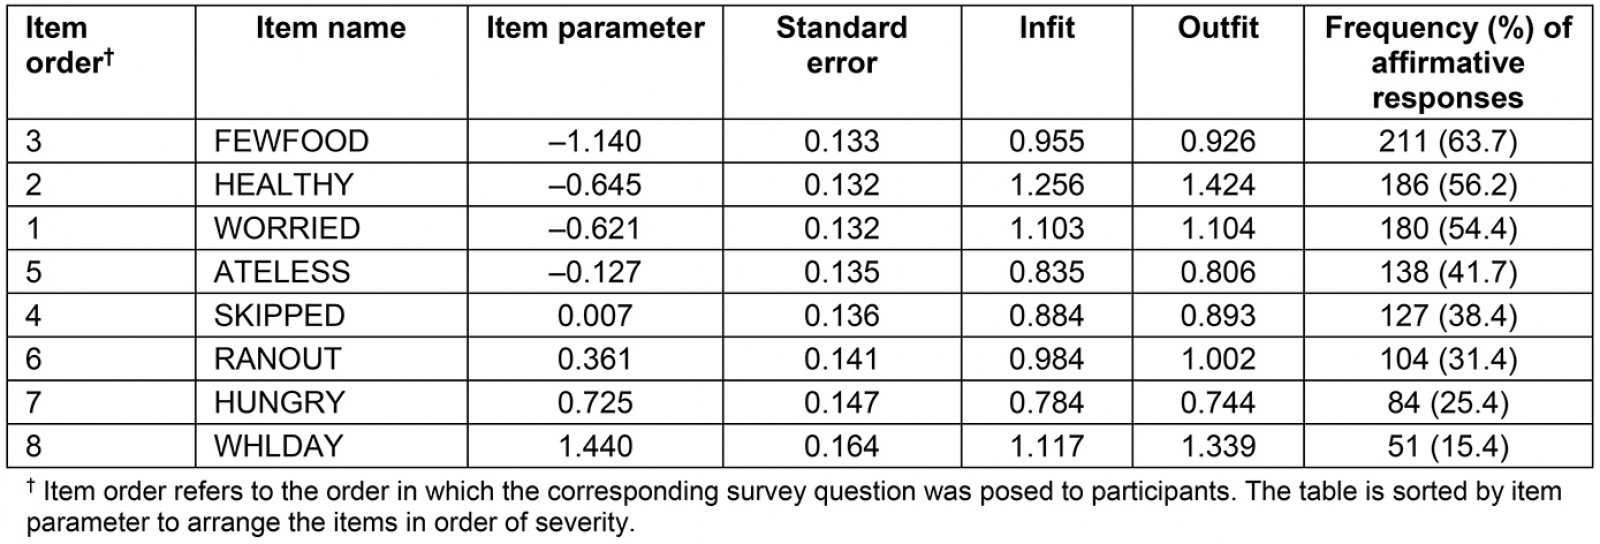
Equating and prevalence rates
The equating process was used to recalibrate the 2014–2016 FAO global standard to a common scale for comparison. The process allowed for comparison of food insecurity prevalence rates using the ATELESS and WHLDAY items (Table 1) as benchmarks for moderate and severe food insecurity respectively. Figure 1 illustrates the item parameters for The Bahamas in order from the least to greatest item difficulty in comparison to the standardized global item parameters. The location (ie item parameter) of each of the eight item names reflects how item difficulty corresponds to benchmarks for severity of food insecurity. For example, for The Bahamas, the HEALTHY and WORRIED items have very similar difficulty (in contrast to the standardized global scale).
Table 4 shows the estimated probability of being moderately or severely food insecure as well as the estimated probability of being severely food insecure, both in relationship to the total FIES score. The prevalence rate of moderate and severe food insecurity (ie the estimated proportion of the population is shown in Table 5.
Table 5: Probability of food insecurity based on Food Insecurity Experience Scale scores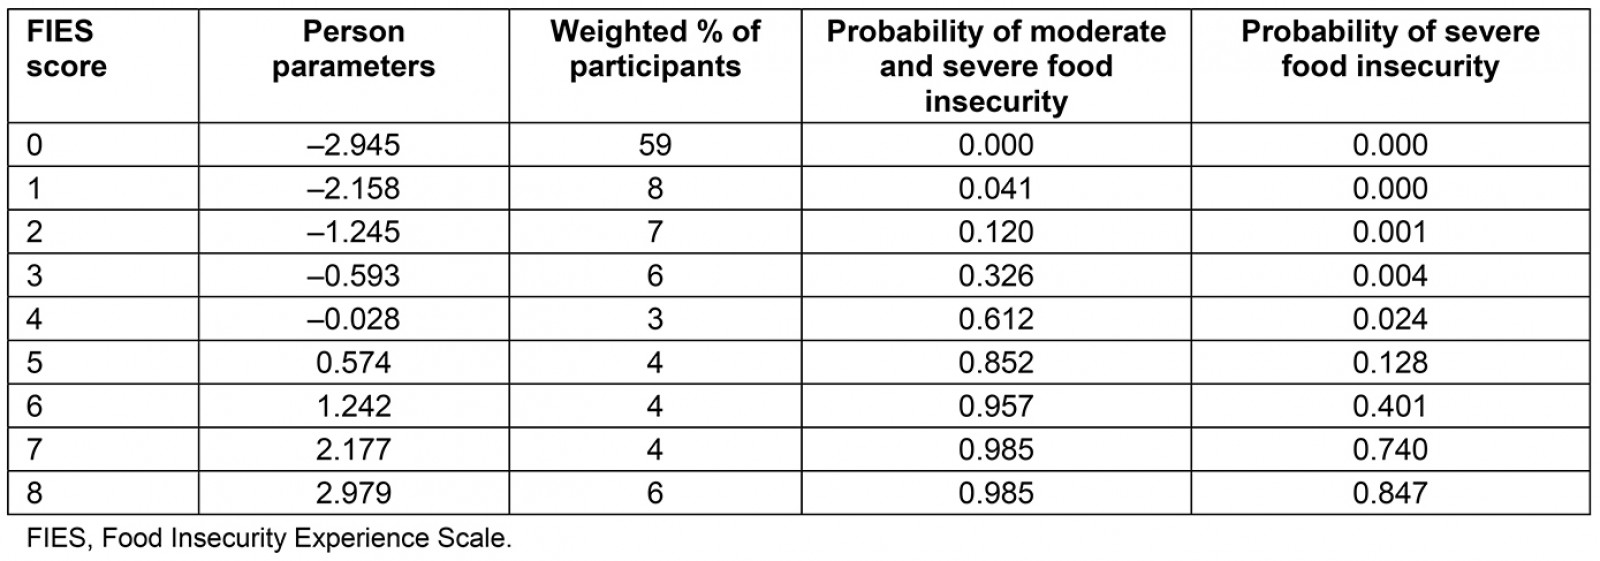
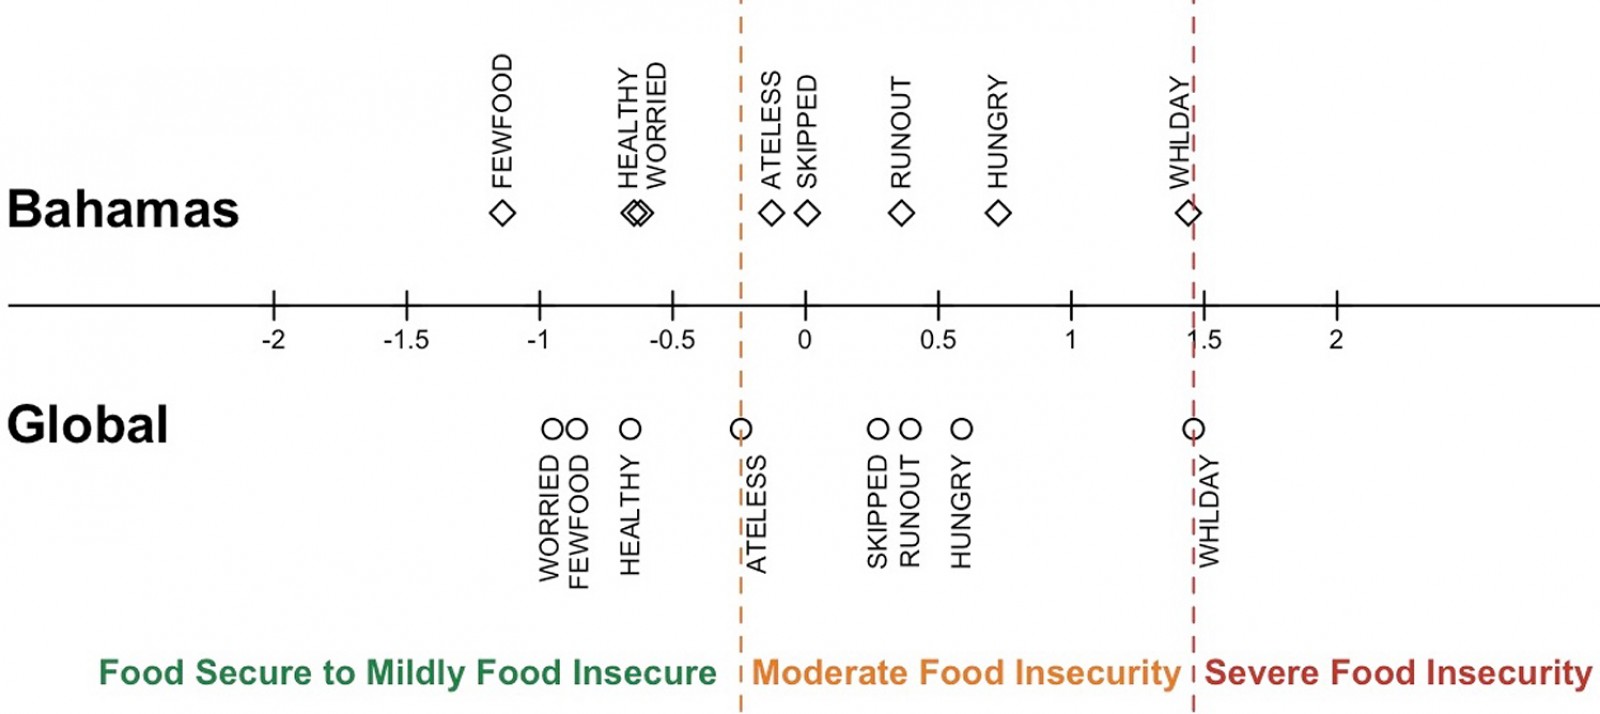 Figure 1: Food insecurity in the Bahamas compared to the Food and Agriculture Organization global standard
Regression analyses
The results, which matched a forward selection procedure, indicate which variables in the final model account for unique sources of variation. The model (R2=0.10, R2adj=0.09, F(9,22)=10.92, p<0.01) is shown in Table 6 in the order of proportion of variance accounted for. Only two variables, household-level obesity and household-level cancer, were not included in the model. There was no difference in FIES scores among Bahamians with a high school diploma and those with less than a high school education; however, those with post-high school education had significantly lower FIES scores. There was no difference in food insecurity among young adults (18–34 years) and middle-aged adults (35–54 years); however, Bahamians aged 55 years or more were more food secure. Females experienced more food insecurity than males. Finally, Bahamians living in a household with someone with diabetes, high blood pressure, or heart disease experienced more food insecurity.
Table 6: Stepwise regression model of Food Insecurity Experience Scale scores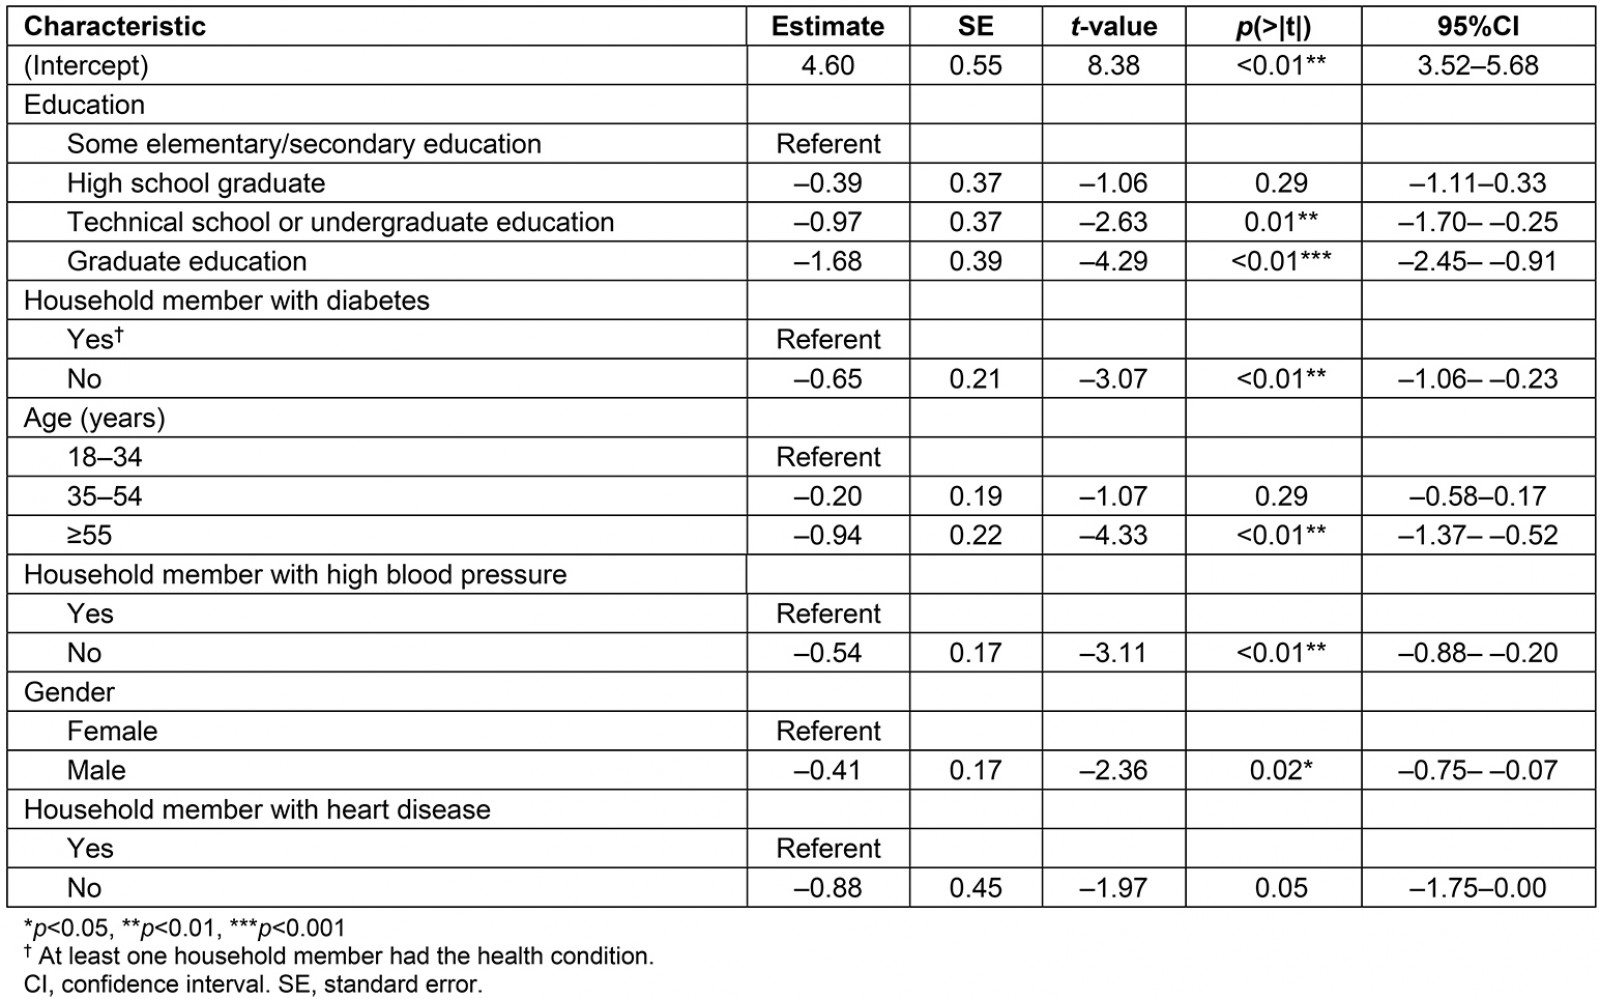
Discussion
The present study is part of a global call to address the growing challenges of food insecurity, known to distinctly impact both hunger and obesity in rural areas such as those of small island developing states (SIDS)7. Climate change has exacerbated food security challenges, and island nations, including the SIDS, are at high risk for continued impacts. As sea levels rise and the number and severity of natural disasters increase, SIDS struggle to ensure the viability of local production and to minimize reliance on imports, which are largely processed foods2,4,5.
The findings of the present study indicate that the FIES is a valid tool for use in The Bahamas and found that 21% of the population of Nassau was food insecure in 2017. More specifically, 11% were moderately food insecure and 10% were severely food insecure. Rates of moderate or severe food insecurity are relatively consistent with those reported for the rest of the Americas (22.9%); however, rates of severe food insecurity in the Bahamas (10%) are higher than those found in the literature for the Americas (6.2%) and other Caribbean nations. For example, in Saint Lucia, approximately the same percentage of the population (22.2%) experienced moderate or severe food insecurity in 2017, although a smaller proportion of the population (4.5%) experienced severe food insecurity. Rates of severe food insecurity are also lower for the Caribbean as a whole (6.2%)18 than the Bahamian rate identified in the present study. One recent study that identified rates of severe food insecurity similar to that found in the Bahamas was conducted in Sub-Saharan Africa and found that Senegal, Mauritius, and Mauritania all have similar rates of severe food insecurity to The Bahamas (around 10%); however ,rates of moderate food insecurity are higher19. In September 2019, Hurricane Dorian, one of the most intense tropical cyclones on record, made landfall on The Bahamas. While the data presented here pre-dates the storm, it is valuable as a pre-storm baseline to which future rates can be compared.
There is substantial evidence that natural disasters profoundly impact food security. In one study, the FAO found that across 140 disasters affecting at least 250 000 people, food supply losses after each disaster were equivalent to, on average, a 7% decrease of national per-capita dietary energy supply20. Disasters cause unemployment, resulting in reductions of households’ purchasing capacity and, at the same time, food availability decreases; these phenomena lead to food inflation, collectively increasing food insecurity, malnutrition risk, and hunger20. The World Food Program stresses that four out of five people suffering from hunger live in areas that are particularly susceptible to disasters20. In developing countries, the agriculture sector on average absorbs a disproportionate 22% of total damage and loss from natural disasters20.
By comparing responses to different measures of food insecurity, researchers can better compare the manner in which a community or nation experiences food security across nations and the globe. Bahamian characterization of mild food insecurity was recognized in a different pattern of responses than the global order of responses. Findings from the Rasch analysis, including a comparison of the order and spacing of the severities, illustrate some uniqueness in Bahamians’ food experience. Notably, mild food insecurity in The Bahamas is experienced in a different order than it is in other parts of the world18,21. Responses indicate it is likely that, by the time a Bahamian worries they will not have enough food to eat, they have already restricted their meals to a few kinds of foods and begun to limit their intake of vegetables and fruits (Table 4). Globally, mild food insecurity is experienced differently, as individuals generally report being worried about not having enough to eat before reporting eating fewer foods18,21. The spacing of the item parameters suggests that Bahamians who experience moderate food insecurity are more likely to restrict the variety of their food intake prior to feeling worried about food than their global counterparts.
The reason for this pattern in The Bahamas is not clear. However, it is possible that the strong religiosity of the nation and history of enduring difficult times, including experiences with natural disasters, have led citizens to characterize worry differently, or later in the process, long after food becomes scarce22. This phenomenon may also be explained in part by a lack of diverse food availability in The Bahamas due to its remote location. The presence of delayed worry suggests more qualitative research is needed to better understand the progressive experience of hunger across the globe and the cultural meanings embedded in these experiences. Further, examination of how experiential responses differ before and after a disaster may also inform an understanding of coping mechanisms.
The examination of the relationship between individual and household-level variables on food security revealed a protective effect for age (over 55 years) and for having completed some post-high school education or higher. While it is not particularly surprising that having more education is associated with less food insecurity, the finding that older persons are less likely to experience food insecurity may run counter to that of other nations. For example, in Latin America and in the USA, older individuals are often at higher risk23,24. However, based on the knowledge of this article’s Bahamian co-author, Bahamians have long-held traditions to first feed the elders in the home, which may explain the effect. Data analysis also showed that households with higher rates of diet-related disease, including diabetes, high blood pressure, and heart disease, are more likely to experience food insecurity. This finding is consistent with prior research from developed nations recognizing the association between food insecurity and diabetes and its risk factors, as well as the compounded challenge in managing a chronic disease while experiencing food insecurity25. In contrast, the present analysis did not reveal an effect for obesity nor for cancer. It is possible that the effect that would have been captured by the obesity variable was overshadowed by that of the other diet-related diseases, given their likelihood to exist as comorbidities. However, this does not account for unique variance between the variables.
This research, from the data collection, to analysis and writing, was completed as a collaborative led not by the nation’s government, but rather a partnership between a non-governmental institution, a for-profit market research firm, and two academic institutions, one in The Bahamas and one in the USA. This collaborative approach with a private Bahamian firm represents a novel, interdisciplinary, and relatively low-cost mechanism to achieve food security insight in an environment where government staff and officials are often under-resourced. This work reflects the partnership-oriented focus of Sustainable Development Goal 17, a call for collaboration between public and private institutions to work towards sustainable development, an increasingly useful humanitarian strategy – especially in remote nations26. In areas that recognize the need for data about the problem of food insecurity, but where governmental resources are strained, such approaches may work to close important gaps in capacity or related resources.
While offering novel insight into food insecurity in The Bahamas, this research is not without limitations. First, The Bahamas is an archipelago that lacks an easy mechanism to conduct data collection on all inhabited islands. Each island in the nation has unique characteristics and, likely, its own challenges including likely differences in food security and perhaps the ways that food security is experienced. Without contacting residents from each island, critical data can be missed. For this study, data were only collected in New Providence, which in and of itself is a unique island and therefore not necessarily characteristic of other islands, is home to 70% of the populace of The Bahamas. As such, the findings should not be attributed to other islands without great caution. Further, the results examining the relationship between household characteristics and food security outcomes were limited by missing data, in particular high rates of omission on questions about how employment, housing, household income, household size, and household composition influence food insecurity. It is unclear why so many individuals declined these questions, while still choosing to answer other relatively personal questions, which suggests that future research should review question wording and seek feedback prior to a second administration.
Conclusion
Prior to Hurricane Dorian and the COVID-19 pandemic, 10% of Bahamians living in Nassau experienced severe food insecurity, while another 11% experienced moderate food insecurity. Ongoing monitoring and reporting of food insecurity prevalence are critical, particularly among SIDS where natural disasters can quickly change the social milieu, specifically, the availability of food, further isolating remote regions. Additional data from other islands, including family islands, will help provide a more comprehensive understanding of the problem across the nation.
Together, academic experts, non-profit leadership and for-profit leaders must engage to make data collection in remote SIDS a priority. This collaborative approach represents a novel, interdisciplinary, and relatively low-cost mechanism to achieve answers in an environment where government staff and officials are often under-resourced.
References
You might also be interested in:
2022 - Rural–urban differences in physical activity and TV-viewing in Brazil
2019 - Social and community networks influence dietary attitudes in regional New South Wales, Australia