


Introduction
Regional inequalities in health within countries have been documented internationally1-4. Regional health inequalities are inequalities between city/metropolitan areas and non-metropolitan (outer regional, rural and remote) areas in health status or in the distribution of health resources. Monitoring regional health inequalities can produce evidence and support for policies to reduce inequality, particularly when there is evidence of substantial inequality5. Government reports and academic articles provide point-in-time evidence of rural–metropolitan health inequalities in Australia6-9, but these inequalities within metropolitan areas and outside metropolitan areas have not been examined over time to determine trends. Understanding health inequity involves examining trends in social determinants in the context of regional health inequalities3. Analysis of trends can identify where progress has been made and where more action is needed.
In addition to analysis of trends, analysing small-area data can identify differences within remoteness categories that are masked when analysing aggregated data by remoteness. A Social Health Atlas of South Australia (2006) provided analyses of small-area differences in health and social determinants of health (SDH), revealing variation in health and the distribution of SDH at a point in time within metropolitan South Australia and country South Australia10. Beard et al (2009) mapped the relative risk of small-for-gestational-age birth in New South Wales by postal area, finding that there was not a uniform trend in rural areas7. Analysis using small-area data can identify variation within both large areas and remoteness categories.
People living in rural and remote areas in Australia experience significantly worse health compared with those in metropolitan areas, including a higher burden of disease, lower median age of death and higher mortality8. Inequalities in health are shaped by SDH, which are the ‘conditions in which people are born, grow, work, live and age, and the wider set of forces and systems shaping the conditions of daily life’11. Evidence from the US indicates that SDH contribute up to 50% to population health, compared to an estimated contribution of 15–25% from health systems12, and SDH are estimated to explain a third of the health gap between Indigenous and non-Indigenous Australians13. SDH are known to contribute to area variations in health2,7. Decades of research have provided strong evidence of a social gradient in health whereby health is worse for each socioeconomic group down the gradient. Social gradients in income and education reflect the health benefits of having more economic resources (including food security, housing) and less stress14, and social conditions act throughout the life course to affect exposures that cause poor health15. In rural and remote areas, SDH can have an effect on the physical characteristics of locations, and impact on access to services7.
Explanatory frameworks that include social, economic and cultural determinants of health are increasingly used when explaining rural and remote health inequalities3,4,7,16. Social and economic disadvantages found in rural and remote areas include lack of employment opportunities and education, poorer quality housing, limited service availability and acceptability (distance from services and providers), damaging occupational conditions, social isolation, lack of diverse fresh food or healthy food in remote areas and more difficult conditions for transport7. Rural and remote areas also have multiple positive attributes, including stronger bonding social capital, health-promoting community participation, and cleaner air and access to natural spaces, and rurality can promote healthier living17,18. In addition, rural and remote communities have sometimes generated innovative health service models matched to the health needs of their communities17.
The Australian Institute of Health and Welfare (AIHW) produces reports on rural and remote health as part of the biennial Australia’s Health publication8. These reports provide analyses of national statistics by remoteness categories for indicators of health, health risk factors, and income, education and employment at a point in time (most recently available). The report provides a broad snapshot of regional health and inequality for Australia but only considers limited indicators of SDH (for income, education and employment), and does not analyse how regional health inequalities and SDH inequalities have changed over time, or variation within remoteness categories. Australian articles on regional inequalities likewise analysed geographic variation in health by remoteness category9 and the influence of socioeconomic disadvantage7, but have not analysed trends.
The Public Health Information Development Unit (PHIDU) presents data on health and SDH by quintile of socioeconomic area disadvantage for metropolitan and non-metropolitan areas, and also produces data for small areas. Authors of the present study performed their own analysis of PHIDU data to provide a more comprehensive analysis of the nature of change in inequalities over time and to categorise local government areas (LGAs) into remoteness categories. The PHIDU LGA data do not include this categorisation for data by LGA. Flavel et al (2022) recently analysed trends in the distribution of health, income, wealth and employment in Australia using PHIDU data19. Our analysis builds on that of Flavel et al by considering a wider range of SDH, examining data disaggregated by urban versus non-urban areas, and conducting analysis of data within and between remoteness categories.
This study contributes to the literature in three ways: (1) a time-series analysis identifying the trend in health inequalities and SDH within metropolitan areas and outside metropolitan areas over three decades in Australia to determine what has changed, (2) comparison of recent inequalities in metropolitan areas and non-metropolitan areas, and (3) a fine-grained analysis of the distribution of health and SDH using LGA data to understand the distribution of health and SDH within and between remoteness categories. Improved understanding of what has changed over time (or not), and diversity in health and SDH both within and between remoteness categories, can inform more effective policy and services to rural and remote areas.
Methods
Study design and setting
The study is an ecological analysis based on Australian data from the PHIDU Social Health Atlas20. The Social Health Atlas publishes many standalone health-related indicators and SDH indicators. There are two components to the study: (1) time-series, population-based analysis of trends in inequality and comparison of inequality with capital cities and the rest of states and territories as units of analysis, and (2) cross-sectional analysis of the distribution of health and SDH within and between remoteness categories, with LGAs as the unit of analysis.
Ecological studies do not identify direct causal links, but they are very useful for geographic studies and in highlighting patterns of health and associated determinants – especially where individual data are not available.
Data sources
Time-series data by quintile of socioeconomic disadvantage of area were obtained from the PHIDU Social Health Atlas for capital cities and the remaining areas of (rest of) states and territories. Time-series data enabled assessment of trends from 1986 to 2018. This timeframe was chosen because data for key indicators were available in PHIDU for this timeframe; however, data for some indicators were not available for the entire period but for a shorter timeframe instead. Time-series data were not available for LGAs, therefore PHIDU data on health and SDH by LGA were obtained for SDH from 2016 Census data (the most recently available) and for health indicators from 2014–2018 cause of death unit record files. LGA data were chosen for small-area analysis because they are publicly available and compiled by PHIDU.
Selected indicators
Figure 1 presents the indicators we analysed. The underlying data sources that PHIDU used to calculate each separate indicator for health and SDH, and timeframes for data availability for indicators, are shown in Table 1. PHIDU compiled data for indicators from unit record data, Census data and government sources. Data from three health indicators were used to generate estimates of regional health inequalities: premature mortality, avoidable mortality and infant mortality. These three indicators were chosen because data for these indicators were available over a longer timeframe than for other health-related indicators, and underlying population-based data involved large enough numbers for reliable estimates for disaggregated data by area and by socioeconomic quintile of area disadvantage.
Data on five SDH were analysed: income, housing, education, employment and digital access. In total, 13 separate SDH indicators were analysed. Four income-related indicators were studied: receipt of unemployment benefits and three family types known to live in vulnerable circumstances: single-parent families, female sole-parent pensioners and welfare-dependent families. Two housing indicators were analysed: rental stress and mortgage stress. Education indicators were full-time participation in secondary school education at age 16 years, left school at year 10 (aged 15–16 years) or below, and school leaver participation in tertiary education. Employment indicators were percentage of unemployment, labour force participation, female labour force participation and jobless families, and the digital access indicator was internet access.
While the SDH indicators analysed do not include all known indicators of SDH, our analysis does include more SDH indicators than AIHW analysis, which includes only three (income, education and employment)21. This study also goes beyond publicly available statistics reported by the AIHW by examining all five socioeconomic quintiles rather than differences between the most disadvantaged and least disadvantaged. The analysis by LGA also advances on AIHW analysis by examining variation both within and between remoteness categories rather than using a measure such as the rate ratio, which only compares very remote areas to major cities.
Table 1: Data availability timeframe and underlying data sources for selected Public Health Information Development Unit indicators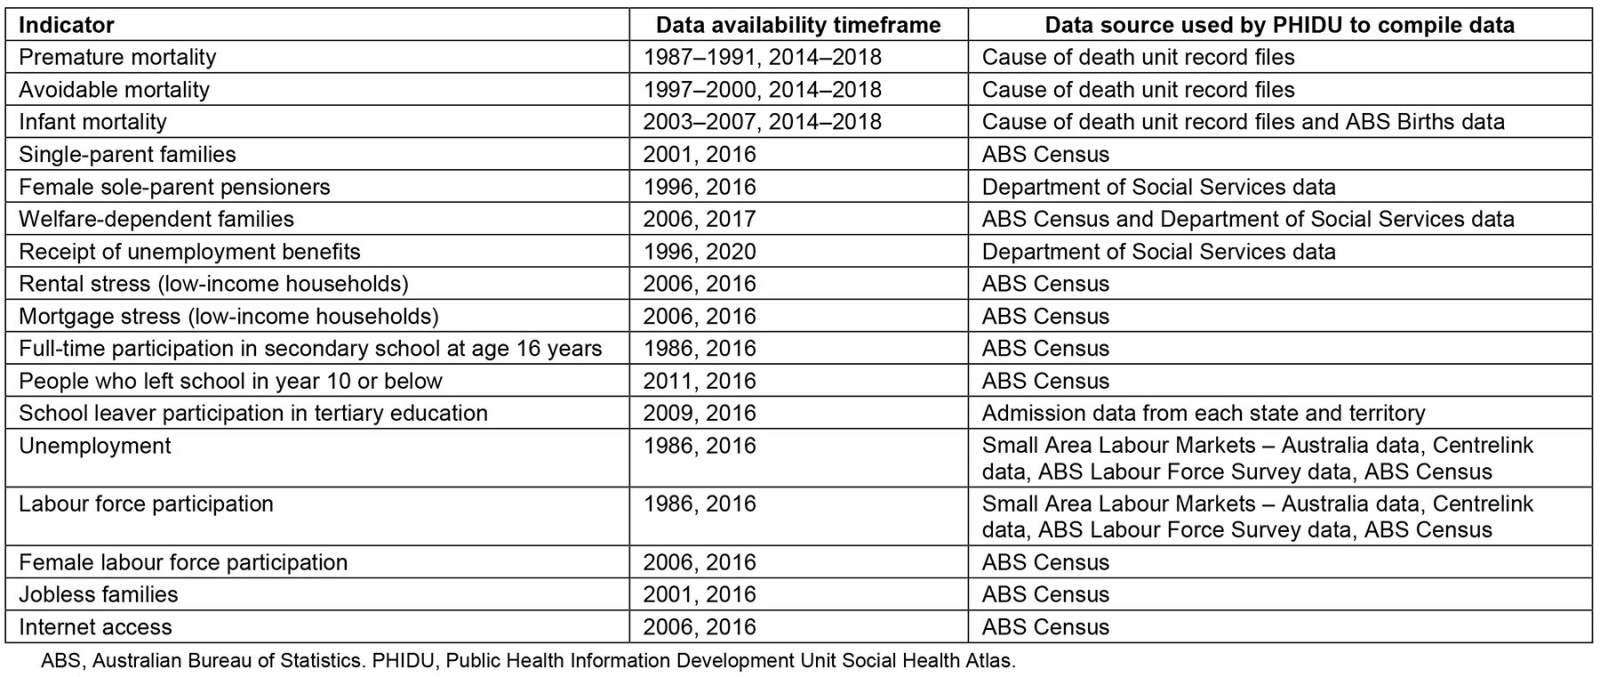
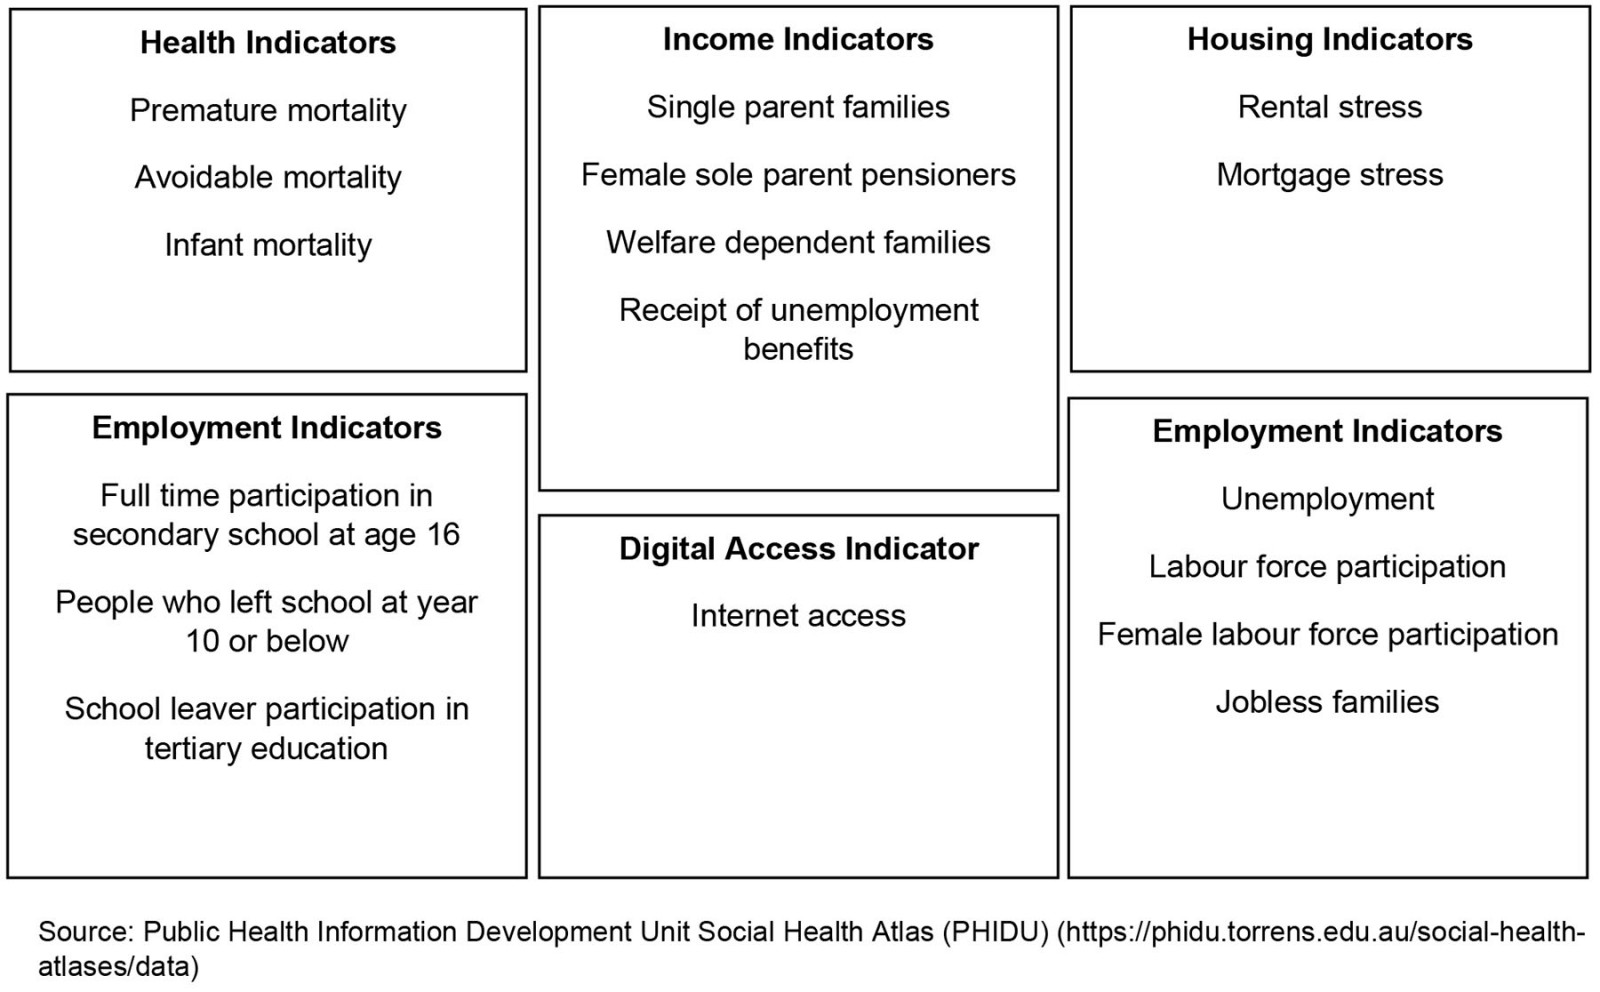 Figure 1: Indicators selected for health and social determinants of health.
Data analysis
Each of the indicators was ranked by socioeconomic status of area of residence, measured by the Index of Relative Socio-economic Disadvantage (IRSD), one of the most used publicly available Socio-economic Indexes for Areas22. IRSD scores and rankings for small-area data are publicly available from the Australian Bureau of Statistics (ABS), which enables matching of small-area data with corresponding IRSD rankings22. IRSD scores for the census years are grouped into quintiles for areas within capital cities and rest of states and territories respectively in PHIDU data. PHIDU derived quintiles of socioeconomic disadvantage by obtaining the relevant IRSD scores from the ABS, ranking Population Health Areas by IRSD score and dividing the listing of ranked Population Health Areas into five groups, with each constituting approximately 20% of the Australian population23. Socioeconomic inequality for capital cities and rest of states and territories was measured using the slope index of inequality (SII). The SII for each indicator is the linear regression coefficient obtained by linear regression of socioeconomic status (quintile) and that chosen indicator, using the population midpoint of socioeconomic status. Rate ratios are reported by PHIDU as a measure of inequality, which is a simple measure of inequality only between the most and least disadvantaged quintiles and unable to measure the gradient in health and SDH24. This study has estimated the SII using PHIDU data, which is a measure of absolute inequality that uses all five quintiles, and which is a stronger basis for comparison by geographical area and over time24.
The Social Health Atlas provides data by LGA for the chosen indicators. We obtained IRSD rankings for each LGA from the ABS and classified data by LGA into remoteness categories to enable comparison of outcomes for each indicator by socioeconomic disadvantage and remoteness category. Remoteness categories are determined by the distance and accessibility to goods and services (e.g. distance to primary healthcare services). The Australian Statistical Geography Standard (ASGS) 2016 Remoteness Areas Structure comprises five remoteness categories: (1) major cities, (2) inner regional, (3) outer regional, (4) remote and (5) very remote25. Other approaches to categorise remoteness across Australia have been developed; however, the ASGS framework is commonly used and corresponds with aggregated data by remoteness categories also available in the PHIDU Social Health Atlas.
Data on LGAs were extracted from the Social Health Atlas and categorised into remoteness using ASGS 2016 correspondences. The ASGS 2016 classification was selected because this corresponded with most data points available. Correspondences between LGAs and remoteness categories are not perfectly matched because some LGAs are assigned multiple remoteness categories (eg the LGA for Balranald in New South Wales is classified as both outer regional and remote). We followed the methods outlined by Sutarsa et al (2021)26 to calculate new remoteness category codes by using the ABS correspondence table between LGA 2016 and Remoteness Areas 201627.
LGA data corresponding to SDH indicators were extracted from the Social Health Atlas into Excel, including each LGA’s IRSD ranking (obtained from the ABS) and remoteness category. Scatterplots were generated for each indicator for five data series corresponding with remoteness categories, and we calculated correlations between IRSD ranking and outcomes for each indicator. Data by capital cities and rest of states and territories were also extracted into Excel. Stata v14.2 (StataCorp; https://www.stata.com) was used to calculate SIIs for capital cities and rest of states and territories. Data used are population data, therefore uncertainty estimates were not needed. Differences in underlying rates and percentages were also assessed in analysing status of health and SDH by areas within Australia.
Ethics approval
This study involved secondary analysis of publicly available data sources, therefore ethics approval was not required.
Results
Changes in inequalities in health and social determinants of health over time
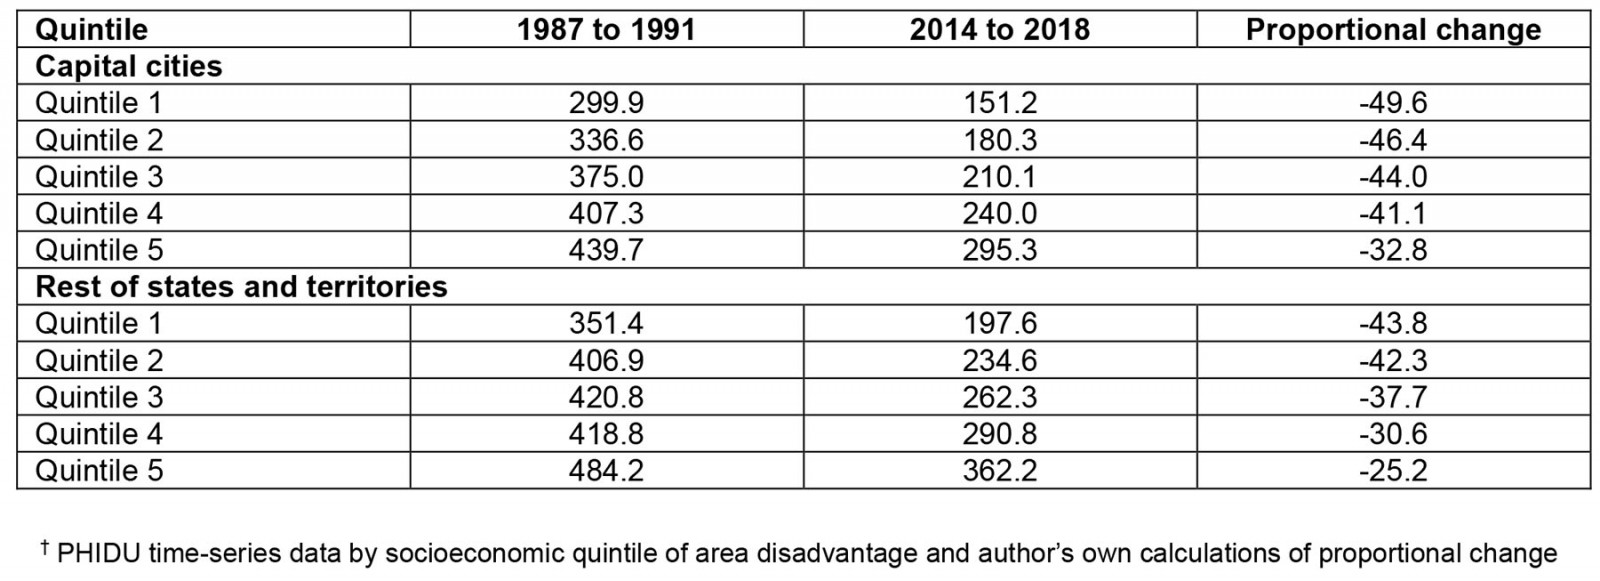
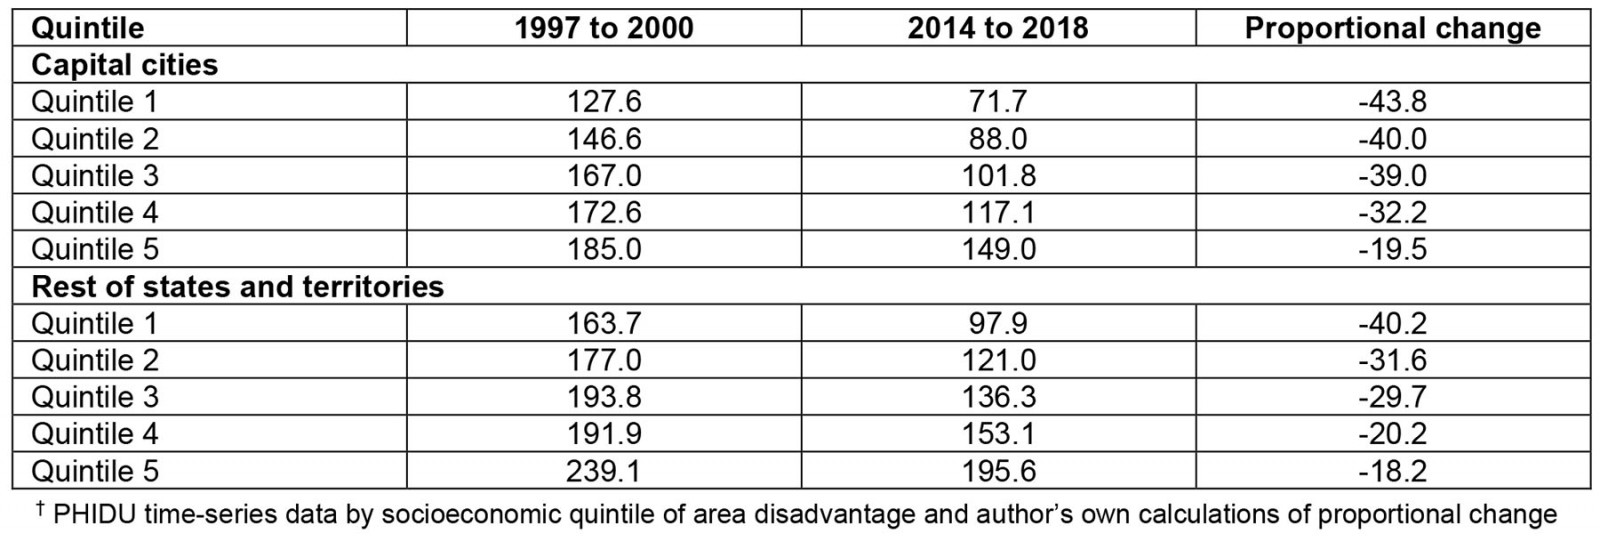
SIIs for capital cities and rest of states and territories are presented in Table 2. Higher absolute values for SIIs represent higher socioeconomic inequality. The absolute SII for avoidable mortality increased in capital cities between 1997–2000 and 2014–2018 (from –14.08 to –18.37) and increased in rest of states and territories (from –16.57 to –22.76). The rise in inequality for avoidable mortality was larger for rest of state/territories compared with capital cities. There was a large increase in the absolute SII for premature mortality for rest of states and territories between 1987–1991 and 2014–2018 (from –27.75 to –38.55), but the absolute SII in infant mortality decreased from –0.66 in 2003–2007 to –0.58 in 2014–2018. Our analysis of change in mortality by quintile of area disadvantage found that mortality decreased for all quintiles for all three health measures but there was a much higher proportional decrease in premature mortality and avoidable mortality in the areas within the least disadvantaged quintiles in rest of states and territories and in capital cities (Supplementary tables 1,2).
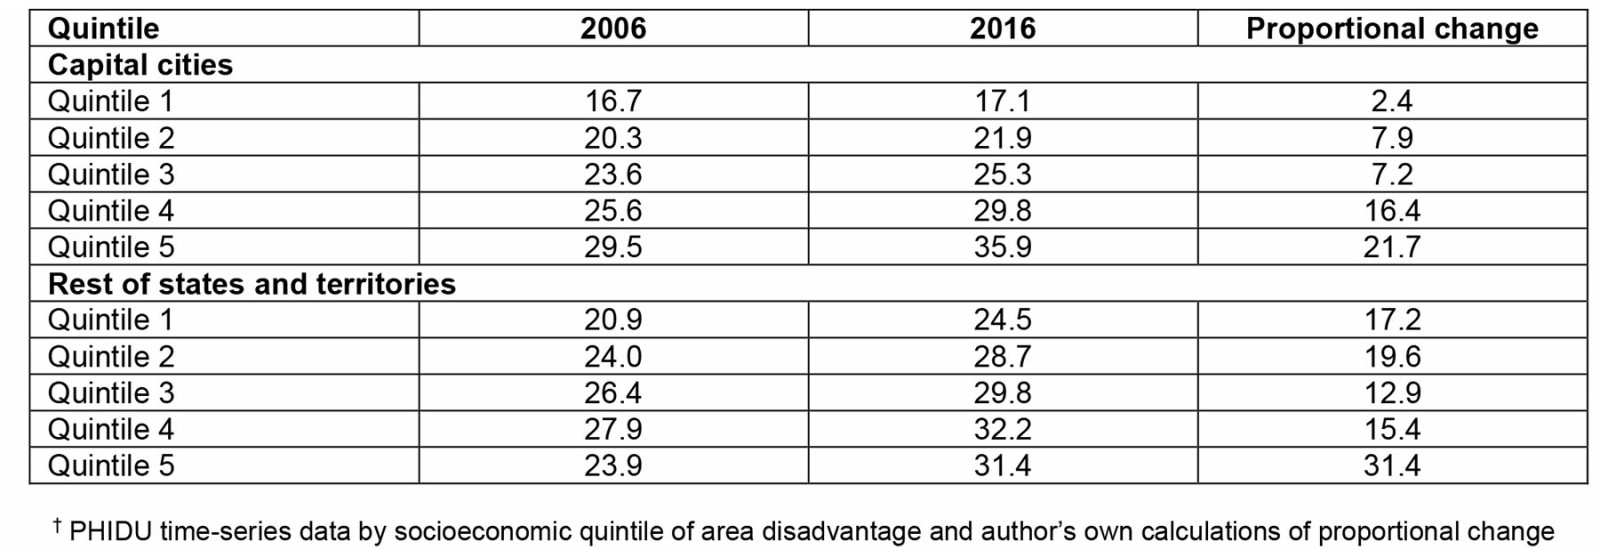
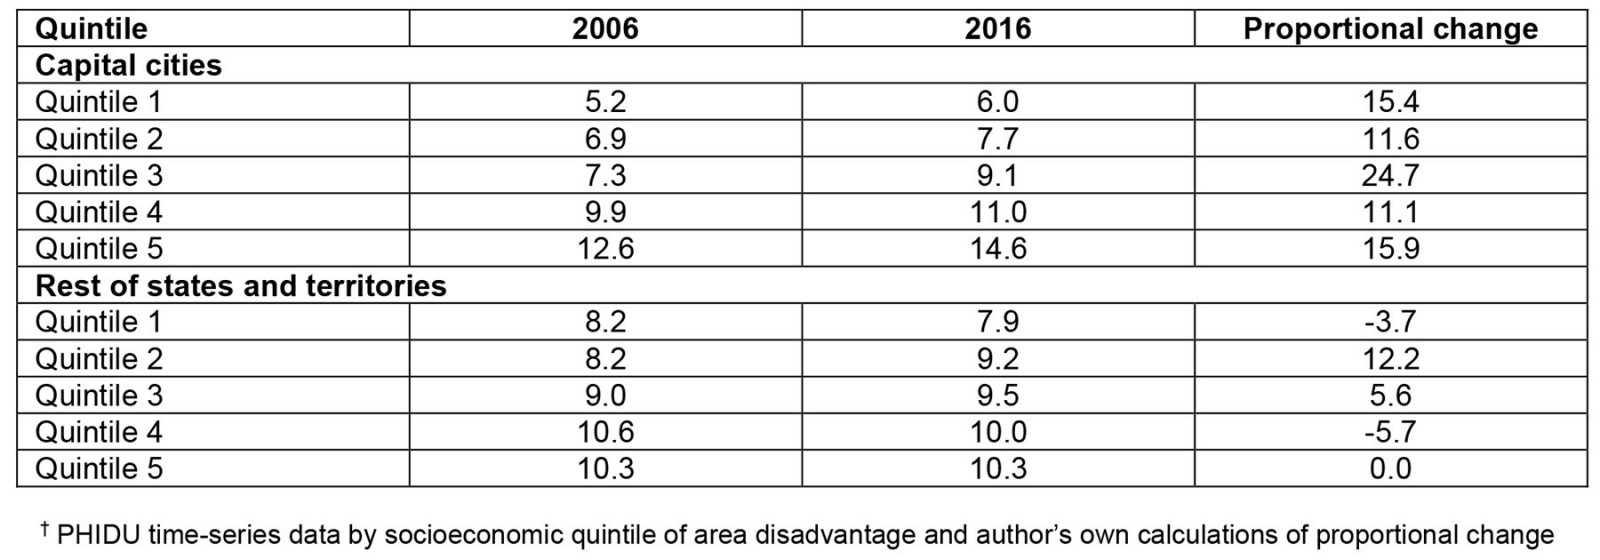
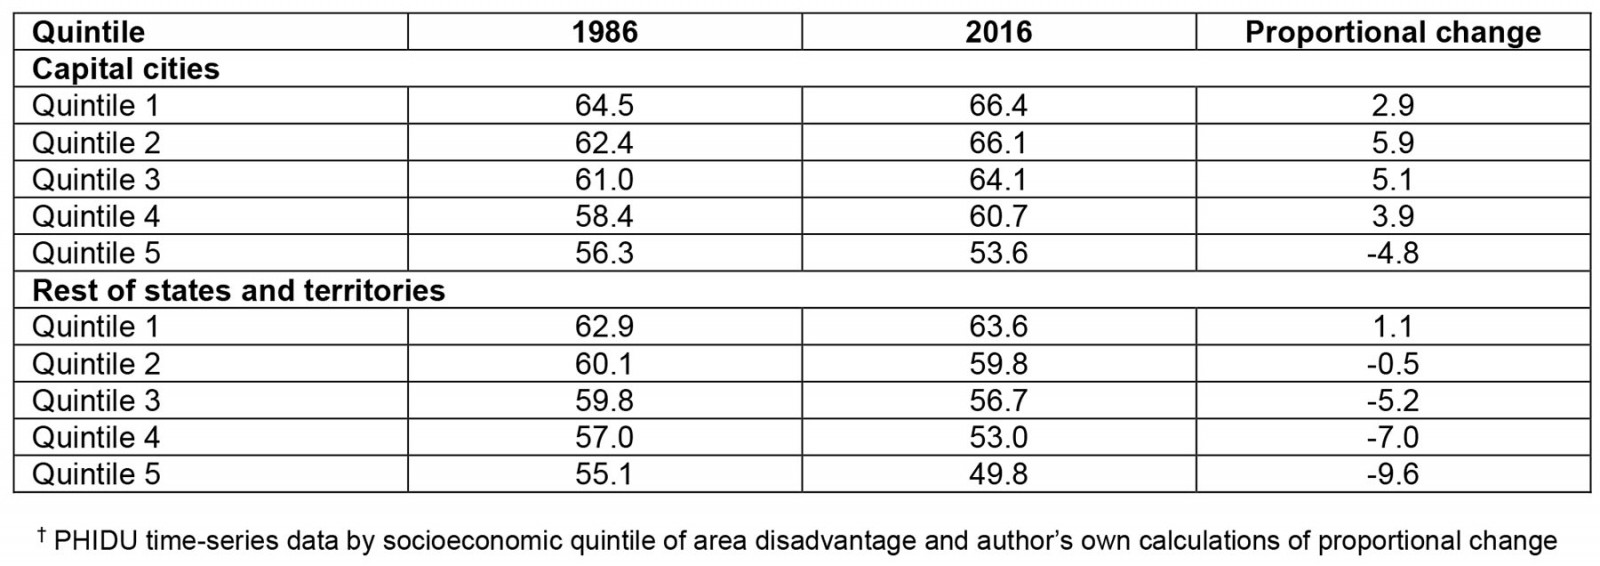
The increase in absolute SII in rest of states and territories represents a steepening of the gradient for premature and avoidable mortality, and a steepening of the gradient for almost all income-related indicators, for rental stress and for labour force participation. Our analysis of PHIDU housing indicator data found that rental stress increased for all quintiles between 2006 and 2016 but by more for the areas within more disadvantaged quintiles in capital cities and rest of states and territories (Supplementary table 3). Mortgage stress increased for all quintiles in capital cities between 2006 and 2016 but changed less in rest of state/territories and even decreased a little in two quintiles (Supplementary table 4). Labour force participation decreased in 2016 compared to 1986 outside of capital cities for all but the quintile representing the least disadvantaged areas and by more for more disadvantaged quintiles, increasing inequality (Supplementary table 5). Trends in income-related indicators were mixed for rest of states and territories: increases in single-parent families, the percentage of people receiving an unemployment benefit, and for welfare-dependent families in the most disadvantaged quintiles but decreases in female sole-parent pensioners20.
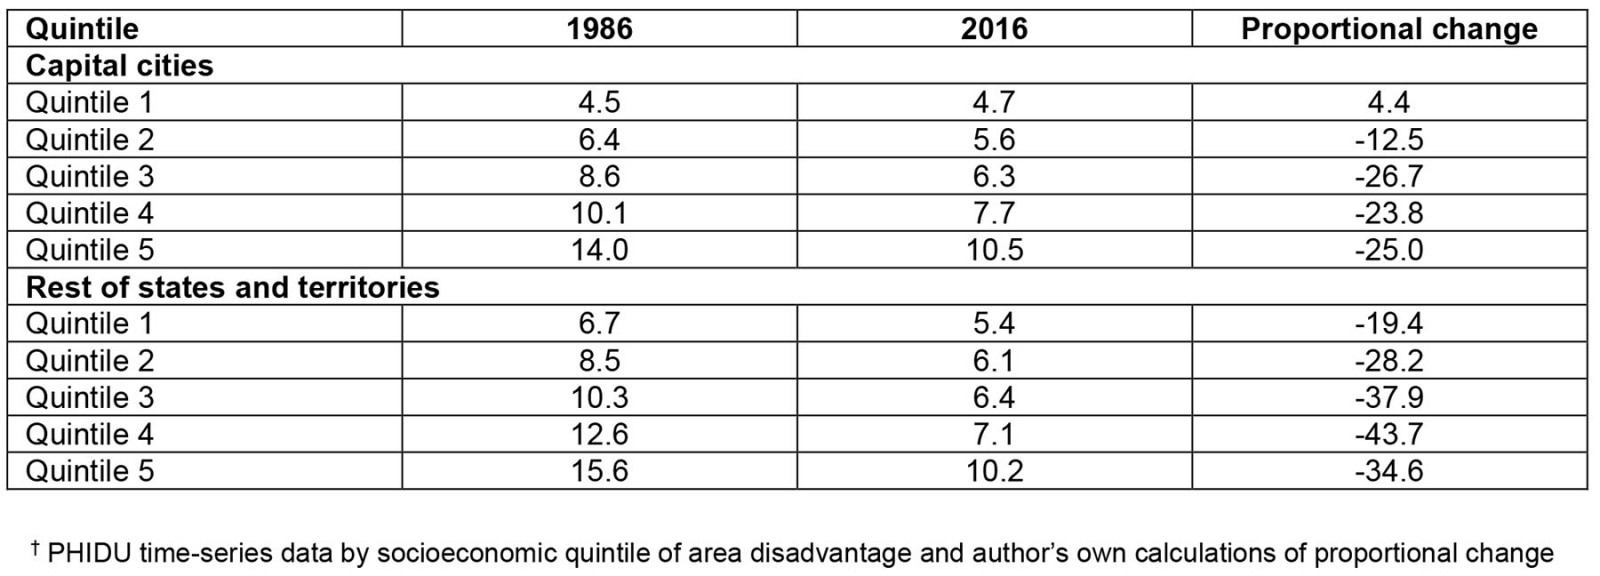
The absolute SII for unemployment decreased between 1986 and 2016 in capital cities (from –2.27 to –1.37) and rest of states and territories (from –2.19 to –1.06) (Table 2). Analysis of PHIDU unemployment data found the percentage unemployed decreased between 1986 and 2016 in all quintiles of area disadvantage in rest of states and territories and decreased in all but the areas within the least disadvantaged quintile in capital cities. There were larger proportional decreases in unemployment for areas within more disadvantaged quintiles in capital cities and rest of states and territories (Supplementary table 6).
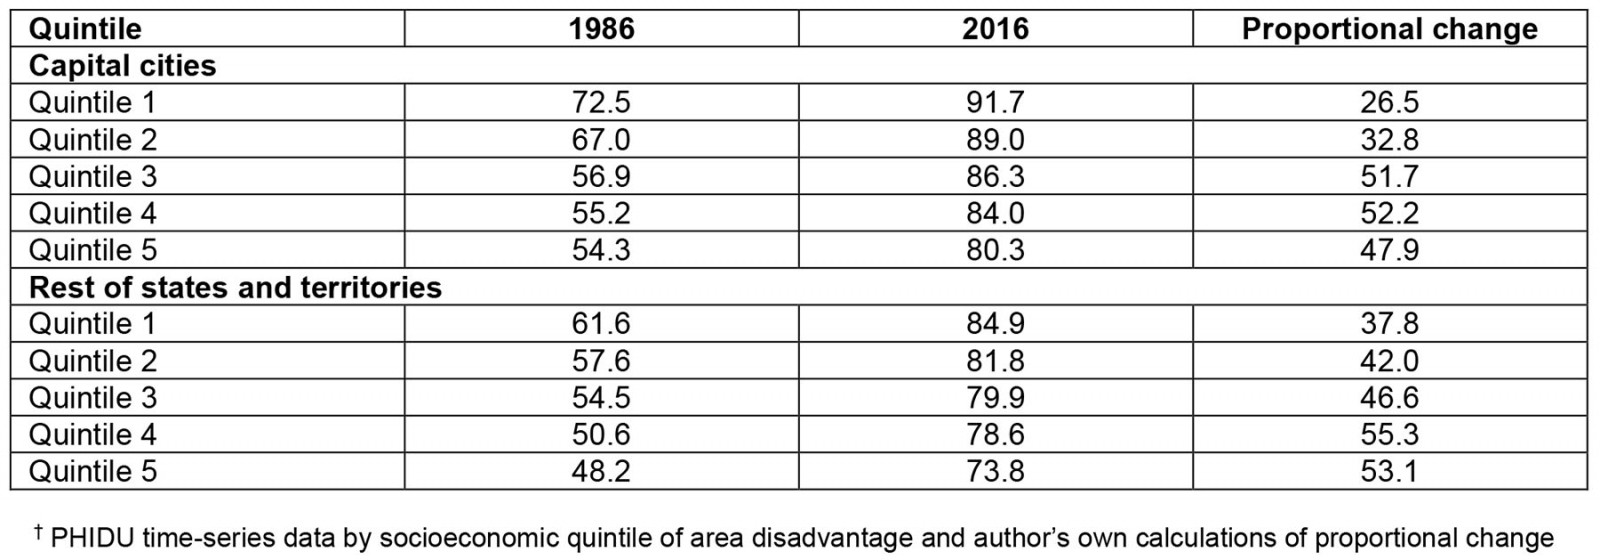
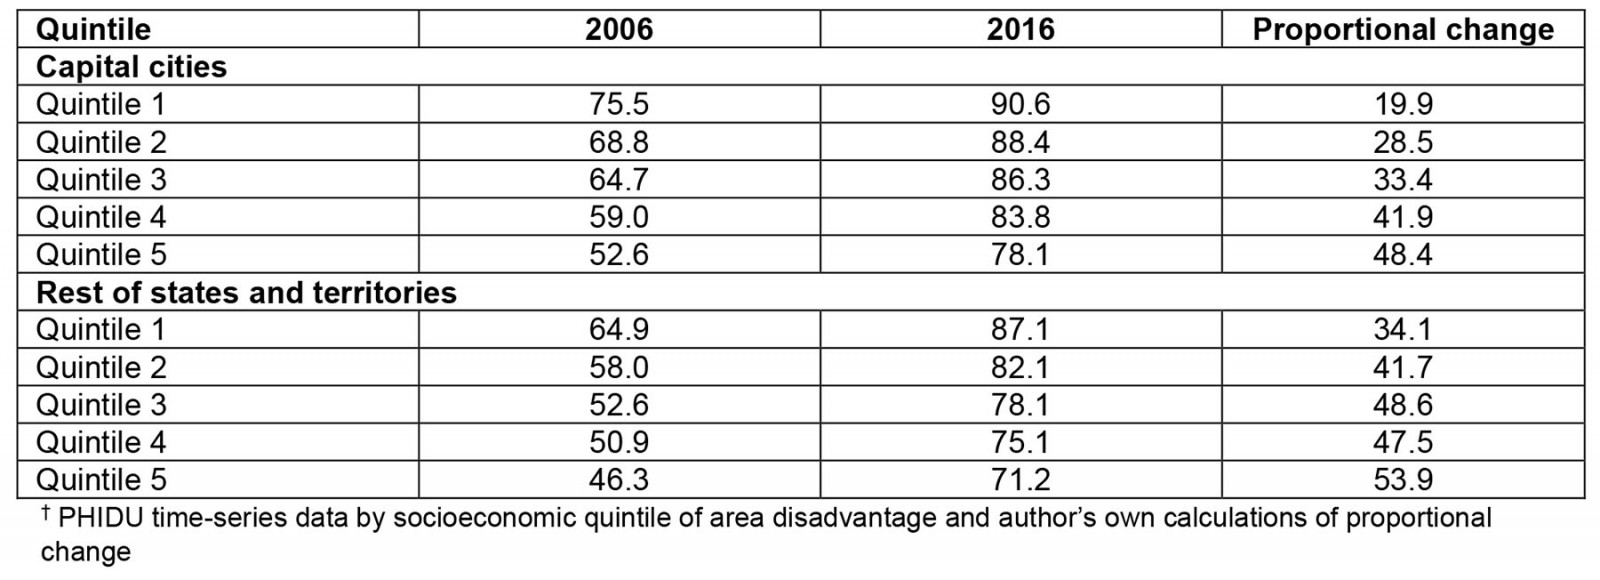
The SII for full-time participation in secondary school at age 16 years decreased in capital cities (from 4.82 to 2.78) and in rest of states and territories between 1986 and 2016 from 3.38 to 2.54. The SII for internet access also decreased between 2006 and 2016 in both capital cities (from 5.56 to 2.97) and in rest of states and territories (from 4.44 to 3.88). The SII for school leaver participation in tertiary education increased from 1.38 in 2009 to 2.82 in 2016 in rest of states and territories. Over this period full-time participation in secondary school at age 16 years and internet access increased, and there was a larger proportional increase in secondary education at age 16 years and internet access for the areas within the most disadvantaged quintiles (Supplementary tables 7,8). This resulted in the gap narrowing between least and most disadvantaged quintiles and a reduction in the social gradient.
Table 2: Capital cities and rest of states and territories slope index of inequality by health and social determinant of health indicators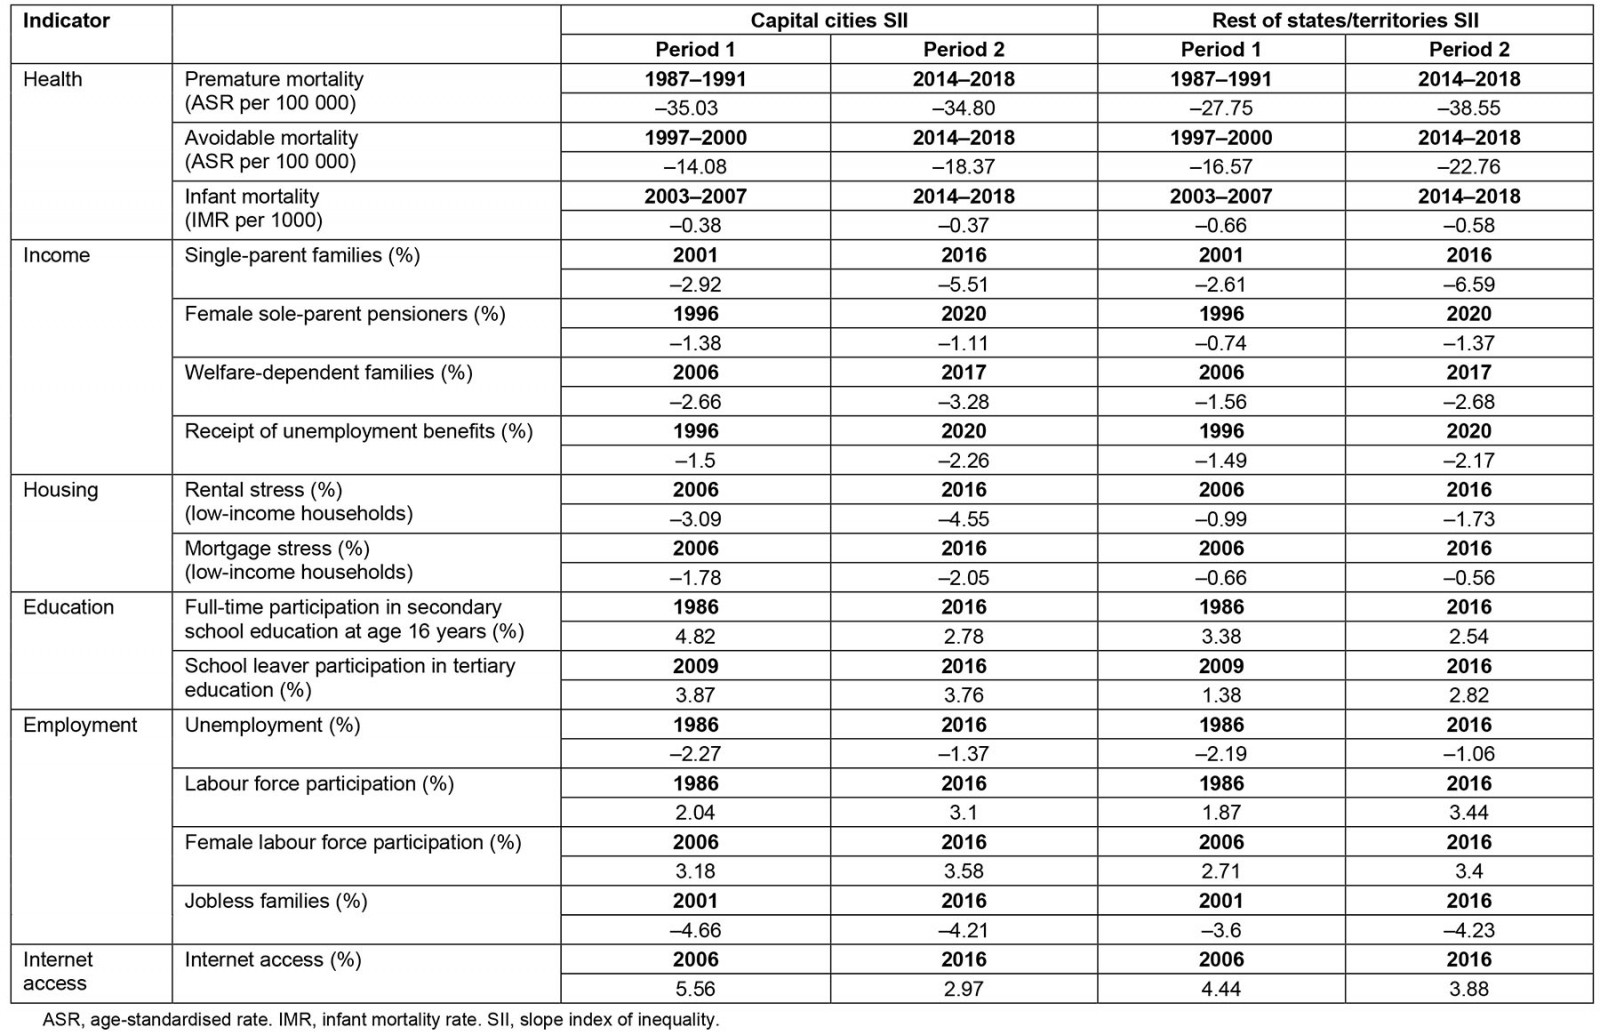
Comparison of recent inequalities in capital cities and rest of states and territories
The absolute SII for rest of states and territories is higher for all three health indicators compared with capital cities, representing higher inequality within rest of states and territories. For SDH, the absolute SII for capital cities is higher for rental stress and mortgage stress for low income households compared with rest of states and territories, and the SII in capital cities is higher for welfare-dependent families with children, slightly higher for receipt of unemployment benefits and full-time participation in secondary school at age 16 years, and higher for school leaver participation in tertiary education in comparison with rest of states and territories. The SII for internet access and for labour force participation in 2016 was higher in rest of states and territories compared to capital cities.
Geographic variation in health and social determinants of health within and between remoteness categories
LGA analysis included 538 LGAs, and 133 of these were categorised as in major cities, 132 were inner regional, 143 outer regional, 60 remote and 70 very remote. The highest numbers of LGAs are in the states of Western Australia (137) and New South Wales (129), followed by Victoria (79) and Queensland (78). Figure 2 illustrates how rates of premature and avoidable mortality differed in 2014–2018 by IRSD ranking and remoteness category for LGAs in Australia. Premature mortality and avoidable mortality for LGAs were highly correlated with the IRSD ranking, and this was also the case with key SDH indicators (Box 1).
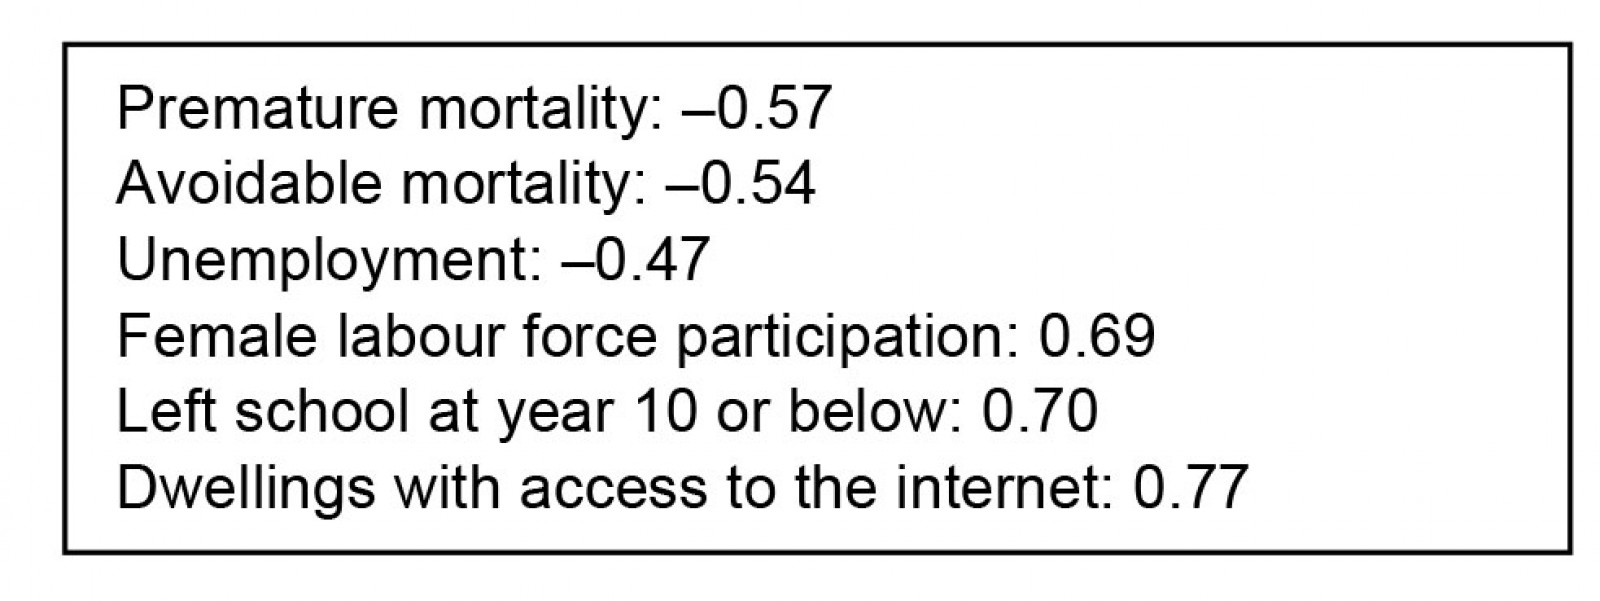 Box 1: Correlation between indicators and Index of Relative Socio-economic Disadvantage rank
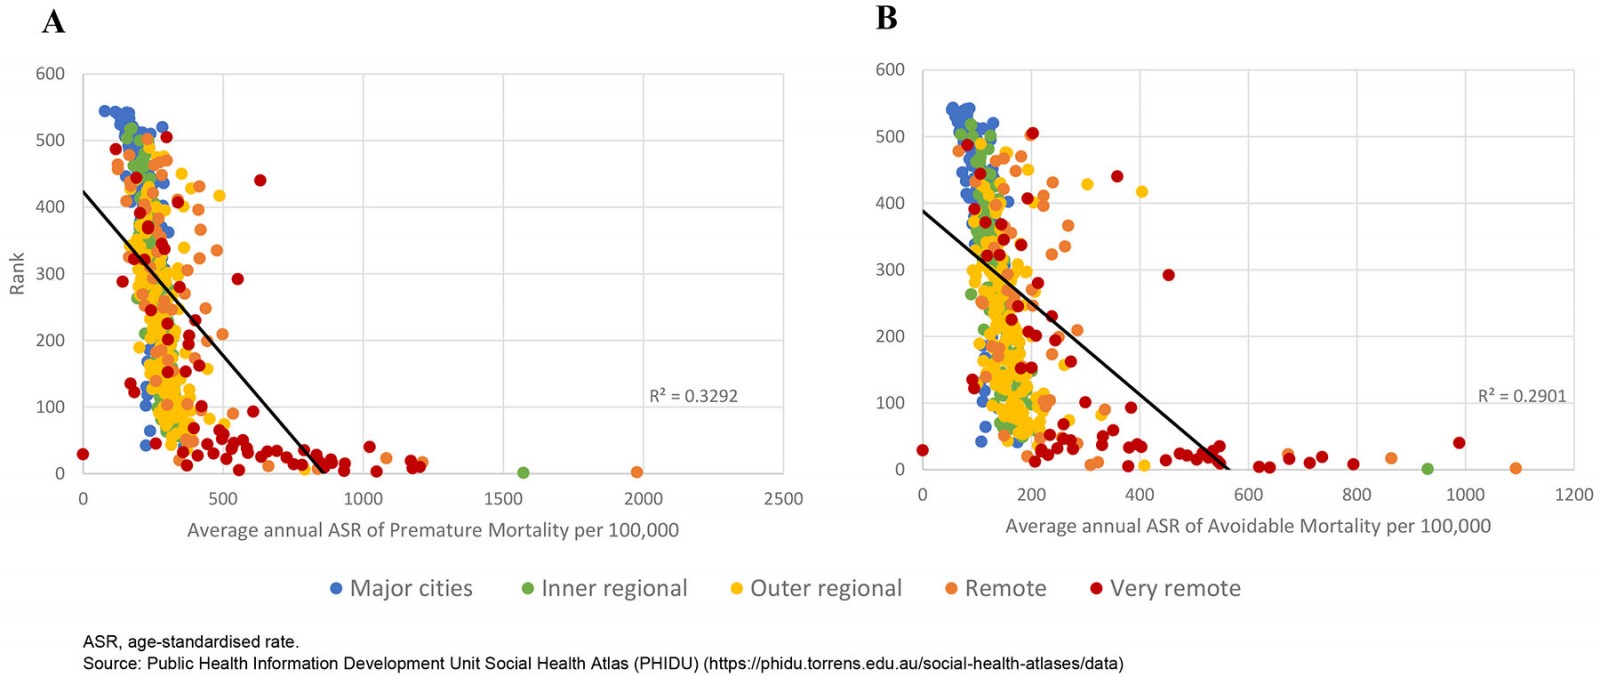 Figure 2: Average annual age-standardised rates of (A) premature and (B) avoidable mortality per 100 000 by Australian Bureau of Statistics Index of Relative Socio-economic Disadvantage ranking and local government area remoteness category, Australia, 2014–2018.
Less disadvantaged LGAs had higher IRSD rankings and generally had lower rates of premature and avoidable mortality. LGAs in major cities were among the least disadvantaged. Many remote and very remote LGAs were more disadvantaged and had higher rates of mortality but there was heterogeneity among outer regional, remote and very remote LGAs. The variation around the trend line suggests that some remote LGAs had better avoidable and premature mortality rates despite being classed as more disadvantaged according to IRSD ranking, and there were remote and very remote LGAs that were ranked as less disadvantaged than many major city LGAs and had lower mortality rates.
The heterogeneity in Figure 2 was also evident in the distribution of SDH in outer regional, remote and very remote LGAs. While remote and very remote LGAs had higher unemployment rates in 2016 on average compared with major city and inner regional LGAs, unemployment rates for many outer regional, remote and very remote LGAs were similar to those in major cities, even for some remote and very remote LGAs that had IRSD rankings that reflect much higher relative socioeconomic disadvantage (Fig3).
Analysis of participation in secondary school by LGA in 2016 indicates that inequities by socioeconomic disadvantage are substantial within and between remoteness categories (Fig4) despite the decrease in SII. Inner regional and major city LGAs had much lower rates of people leaving school at year 10 or below compared with more remote areas. Inner and outer regional LGAs and some remote and very remote LGAs had similar access to the internet in dwellings, whereas there was greater heterogeneity for internet access across remote and very remote LGAs, which was correlated with socioeconomic disadvantage.
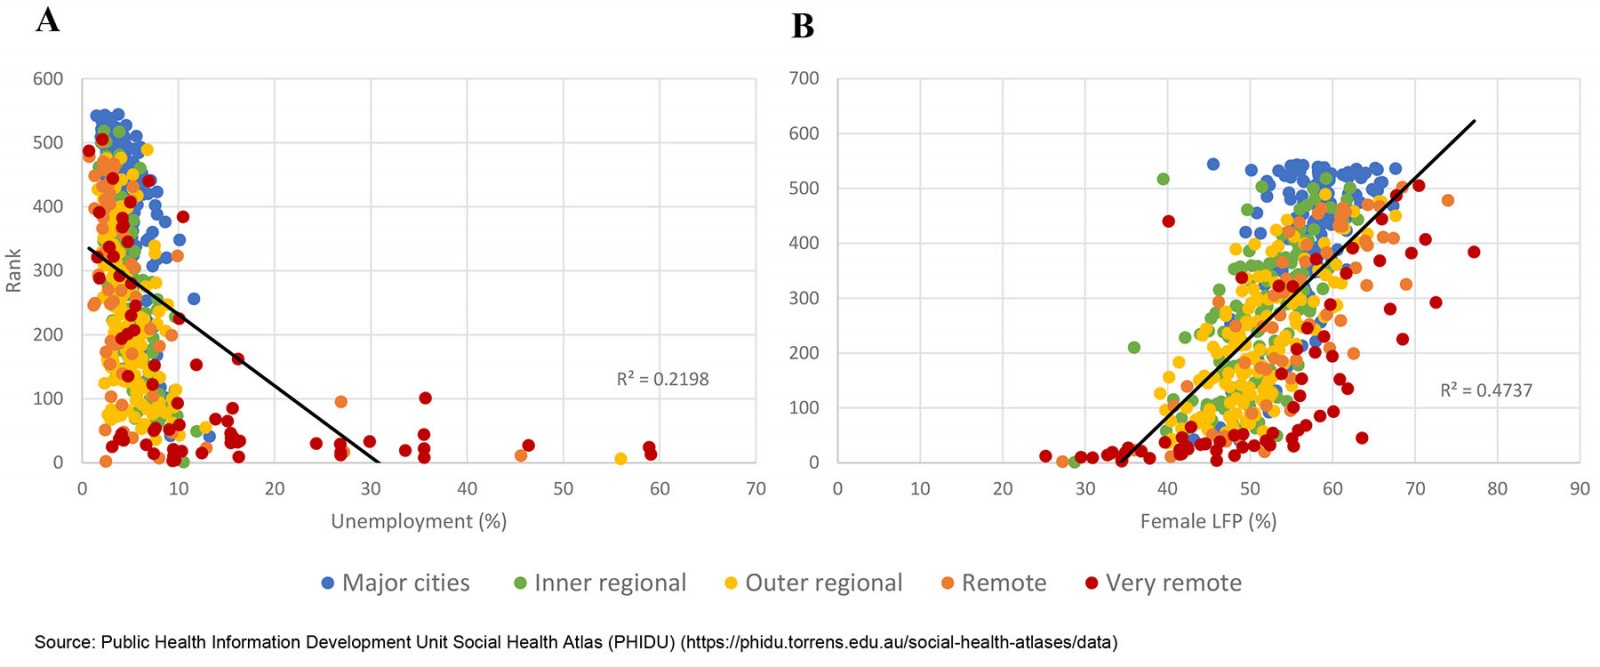 Figure 3: (A) Percentage of unemployment (%) and (B) female labour force participation (%) by Australian Bureau of Statistics Index of Relative Socio-economic Disadvantage ranking and local government area remoteness category, Australia, 2016.
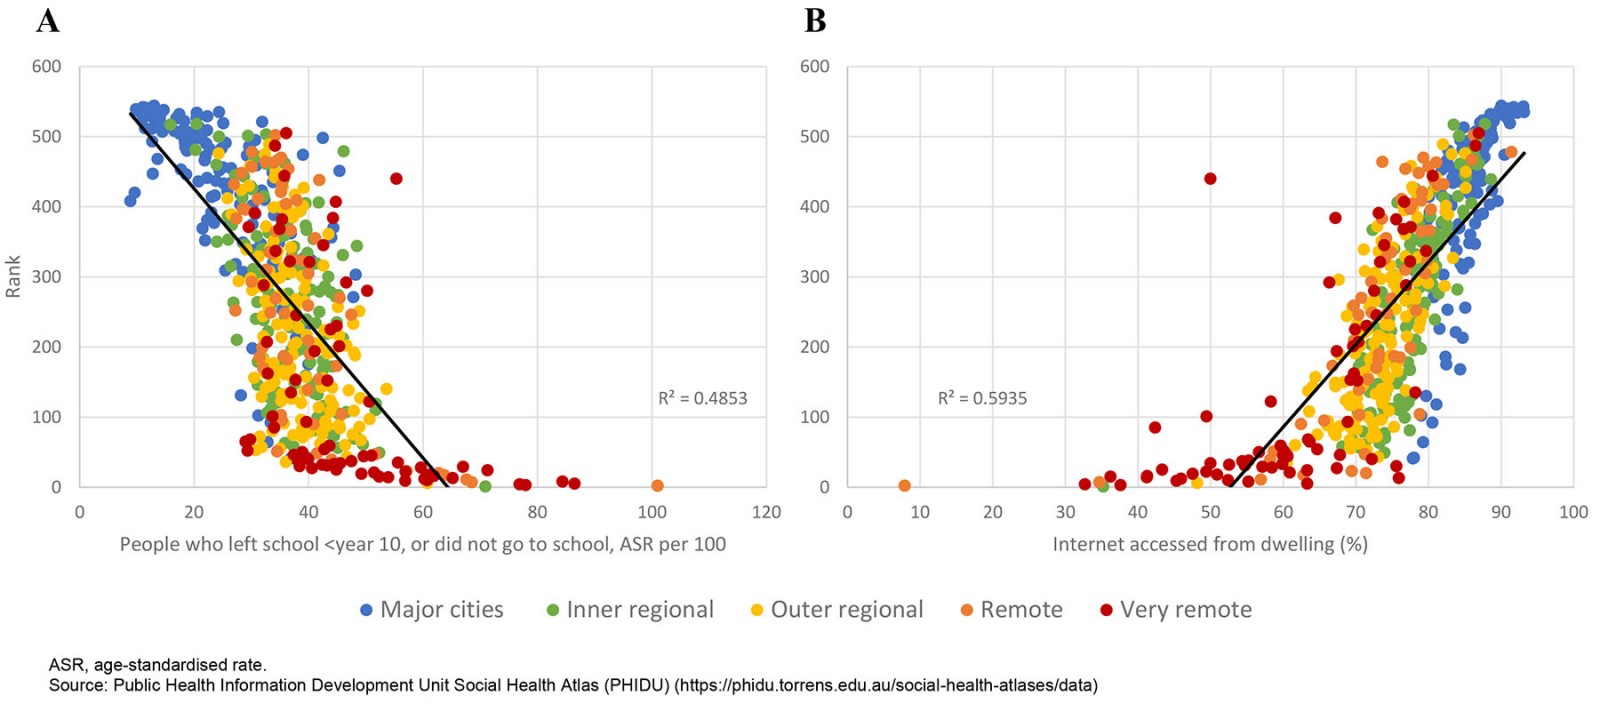 Figure 4: (A) people who left school at year 10 or below (age-standardised rate per 100) and (B) internet accessed from dwelling (%) by Australian Bureau of Statistics Index of Relative Socio-economic Disadvantage ranking and local government area remoteness category, Australia, 2016.
Discussion
Our analysis shows that, despite reductions in mortality, inequality in area disadvantage for rates of premature and avoidable mortality has increased outside of capital cities. This rising health inequality has corresponded with mixed trends in SDH: increases in rental stress, decreases in labour force participation, an increase in single-parent families, an increase in the percentage of people receiving an unemployment benefit, and an increase in welfare-dependent families in areas within the most disadvantaged quintile. There have been decreases in female sole-parent pensioners and unemployment, rising shares of full-time participation in secondary education, and large increases in the share of dwellings with access to the internet. The increase in the percentage of people receiving an unemployment benefit and decrease in sole-parent pensioners can be largely attributed to the 2006 and 2013 changes to benefits received by single parents with children aged 8 years or older, which moved them onto unemployment benefits. The decrease in labour force participation coinciding with a decrease in unemployment suggests that the percentage not in the labour force increased outside of capital cities over the period analysed.
The rise in health inequality has corresponded with an increase in inequality for income-related indicators, rental stress and labour force participation outside of capital cities in Australia in recent decades. Inequality also increased in capital cities for many of these indicators and was higher in capital cities compared to rest of states and territories for rental stress, mortgage stress, welfare-dependent families and school leaver participation in tertiary education. There was higher inequality in rest of states and territories in 2016 compared with capital cities for premature and avoidable mortality, for labour force participation, and for internet access. Our analysis uses five quintiles and has found that the social gradient has steepened for premature and avoidable mortality and key SDH. There were higher proportional gains in health and SDH for the 20% of the population living in the least disadvantaged areas, and this has led to the increase in inequality.
Participation in secondary school at age 16 years and for internet access in rest of states and territories and in capital cities became more equal; however, socioeconomic inequality was still evident in 2016 within and between remoteness categories in analysis by LGA. While the high correlations between IRSD ranking and the health and SDH indicators for LGAs are not surprising, the heterogeneity in the distribution of SDH and premature and avoidable mortality in outer regional, remote and very remote LGAs is notable. Rural and remote areas have a higher burden of disease and higher mortality on average compared with major cities, but this is not the case for all rural and remote LGAs. The variation within these remoteness categories indicates the value of disaggregating data on rural and remote communities because they may differ in ways that are important to informing service provision and policy.
Rural and remote areas have developed innovative primary healthcare services over the period examined in our analysis28. Further investment in Aboriginal and Community Controlled Health Organisations, many of which are located in rural and remote areas, has enabled delivery of more culturally informed, holistic health services including activities addressing SDH29. These strengths in rural and remote areas are likely to have contributed to the reduction in premature and avoidable mortality and infant mortality, but there is continued under-resourcing in rural and remote areas, estimated as a shortfall of $4 billion for non-metropolitan health services30. The Productivity Commission noted in a 2017 report that there have been large government investments in regional programs designed to improve prosperity and reduce disadvantage31. The report stated that ‘Past assistance to industries and regions has often been costly, ineffective, counter-productive, wasteful, poorly targeted and inequitable’31, which may partly explain the mixed trends in SDH. However, the Productivity Commission focused narrowly on economic measures and did not consider how government programs may have impacted health and wellbeing outcomes positively through action on SDH32.
There are aspects of remoteness on the Australian continent that make it harder to be healthier. Many of the most disadvantaged remote and very remote LGAs are located in the Northern Territory, Queensland and Western Australia, jurisdictions with the largest numbers of remote and very remote LGAs. Remote and very remote LGAs have less stocks of fresh food and vegetables, harsh climate and isolating distances7. The regional health inequalities in Australia may also be partly explained by differences in access to health services. In rural and remote areas, the distance from services is a barrier to accessing health care and quality health-related services7. Analysis from Australia, New Zealand and Taiwan found that regional inequalities are partly explained by the worse health and social status experienced by Indigenous populations, accentuated by the impacts of colonisation1,4,7. Aboriginal and Torres Strait Islander Peoples have persistently lower life expectancy compared to non-Indigenous Australians33, and 61% of Indigenous Australians are in the lowest income quintile in remote areas compared to 25% in major cities34.
Our findings of a trend of increasing inequality in health and SDH underscore the ways in which health inequalities are strongly correlated with the SDH examined in this study. Inequalities in social and economic factors have been found to be responsible for inequalities in health35,36. Income inequality has been associated with inequality in a range of population health outcomes37,38. Housing affordability also has adverse impacts on health39 and is closely related to employment status and income40, especially in the absence of sufficient supply of social housing in Australia. Education has been identified as a driver of opportunity, but inequity in education also reproduces inequality across generations41. Increasing inequality in income, rental stress and labour force participation in rest of states and territories will exacerbate health inequalities. The social gradient in health and the steepening of this gradient for premature and avoidable mortality as found in this article likely reflects the differential impact of SDH on health13. Our findings confirm increasing inequality in health and key SDH in Australia reported by Flavel et al (2022)19. Our study extends this work by providing evidence for a wider range of SDH, which explain how regional inequalities have changed over time, comparisons of inequality in urban and non-urban areas, and evidence on variation in health and SDH within remoteness categories.
Improving rural and remote health is about more than provision of services; services are only part of the picture. Digital technologies in rural and remote areas in Australia have the potential both to overcome barriers to education and employment, and provide technology-supported health services. The COVID-19 pandemic highlighted this need and showed that technology could be used to provide more accessible services in rural and remote areas. Internet access is also vital to gaining equal access to basic social determinants of health such as education and employment.
Study strengths and limitations
This study used population data and IRSD rankings that enable estimates of inequality in health and a wide range of SDH indicators. These were tracked over three decades, allowing examination of changes in the social and health gradient, and permitted comparisons between capital cities and rest of states and territories. PHIDU data allow the public to view interactive inequality graphs over time; however, this study went beyond reproducing graphs and involved additional analysis of PHIDU data to determine the proportional change by quintile of area disadvantage to better understand the nature of change in health and SDH inequalities over time. While the SDH indicators analysed included more indicators and more SDH than AIHW analysis, PHIDU did not include data on all known SDH. We acknowledge that areas within rest of states and territories are not homogeneous and include regional and remote areas. Remoteness categories are also not homogeneous (as found in our LGA analysis), and analysis of aggregate data by remoteness category do not allow for estimates of inequality within rural and remote areas whereas PHIDU time-series data for rest of states and territories allowed estimation of trends in socioeconomic inequality using five quintiles of area disadvantage. Population data by LGA allowed for examination of differences both within and between remoteness categories. Analyses using area-based data have been found to underestimate income, education and health inequality42, therefore estimates of inequality in this article may be conservative. There were data quality issues for some indicators by LGA due to small numbers for some LGAs. Reporting of data by LGA has been confined to indicators with the best quality data. Data are aggregated at the level of geographical areas, therefore we cannot account for reciprocal relationships or make inferences about individuals.
An ecological study design was chosen because in Australia there are no individual data including all variables of interest, linked data are not available for the period of interest, there is limited comparability of data on individuals over time, individual data are not available by LGA in Australia, and population data are needed to examine the full distribution of SDH.
Conclusion
Our study has provided a trend analysis of inequalities in health and the distribution of key SDH and identified where inequalities are increasing, and what has changed over the past three decades. Rural and remote areas not only have a higher average burden of disease; they also have a steeper health and social gradient, which is worsening for premature and avoidable mortality and for some key SDH. The heterogeneity in the distribution of health and SDH in outer regional, remote and very remote LGAs may be key to understanding how policies to improve rural and remote health can assist regions more effectively. National, state and territory and local government policies and service planning need to take account of this heterogeneity and determine how particular LGAs differ from others. Such differentiation calls for policies and planning that take account of context and ensure that universal services are adapted to the particular place where they are being implemented.
Funding
This work was supported by a Flinders Foundation Health Seed Grant, and the National Health and Medical Research Council grant number GNT 2009323 funded Flavel and Baum’s time.
Conflicts of interest
The authors declare no conflicts of interest.
References
Supplementary material is available on the live site https://www.rrh.org.au/journal/article/7726/#supplementary
You might also be interested in:
2007 - Skill shortages in health: innovative solutions using vocational education and training