


Introduction
Coronavirus disease 2019 (COVID-19) was declared a pandemic by the World Health Organization in March 20201. As of August 2022, more than 580 million COVID-19 cases and 6.4 million deaths were reported worldwide2, with approximately 92 million cases, 5.1 million hospitalizations, and more than1 million deaths reported in the US3.
Severe COVID-19 is defined as hospitalization, admission to the intensive care unit (ICU), intubation, mechanical ventilation, or death resulting from COVID-194. Community-level factors, such as urban–rural status and pre-existing economic conditions, may increase risk for severe COVID-195. Rural populations may have higher risk for severe outcomes than urban populations as prevalence of comorbidities associated with severe COVID-19 (eg obesity, diabetes, and heart disease) is higher among small rural communities (median prevalence 48%) than among large urban communities (median prevalence 39%)6, and a higher prevalence of individuals with comorbidities associated with severe COVID-19 may contribute to worse COVID-19 outcomes at the community level7. In addition, rural communities may face structural issues, such as limited access to adequate healthcare resources, including testing and healthcare facilities, further increasing their risk of severe COVID-196,8. However, COVID-19 is more transmissable in densely populated areas and crowded living areas, which may lead to higher incidence of severe COVID-19 hospitalizations (eg higher temperatures and lower white blood cell count) and higher mortality rate from COVID-19 infection in urban areas9,10. Given the importance of community-level factors such as urban–rural status and adequate healthcare resources, it is crucial to examine multiple community-level exposures to inform locality-based responses to future public health emergencies.
To our knowledge, four ecologic studies have examined urban–rural differences in severe COVID-19 during 2020 in the US11-14. One study using USAFacts data compared county-level (n=3141 counties) mortality rates from January to June 2020 and found COVID-19 mortality rates were 70.3% lower in rural than in urban counties11. A second study using Johns Hopkins University data as of October 2020 (n=3104 counties), found that COVID-19 mortality rates were lower for rural than urban counties (50.78 and 65.43 per 100 000, respectively)12. A third study used USAFacts data to compare daily COVID-19 mortality rates between urban and rural counties (n=3143) from March to October 202013. It found that COVID-19 mortality rates were lower in rural than urban counties until August 2020, but after August, rural counties experienced higher mortality rates13. In contrast, a fourth study of county-level COVID-19 mortality used New York Times data from January 2020 to December 2020 and found the case fatality ratio for rural counties was 18% (95% confidence interval (CI): 1.07–1.31) higher than urban counties14. Despite these potential differences between urban and rural counties, the impact of other community-level factors on severe COVID-19 should be evaluated.
Pre-existing conditions, such as access to health care, are important determinants of COVID-19 outcomes, and these factors generate significant public health effects15. Ecologic data suggest health professional shortage areas (HPSAs) had higher COVID-19 mortality rates than non-HPSA areas16. Furthermore, individuals residing in rural communities report worse access to health care than those residing in urban communities17. Due to limited healthcare access and an increased prevalence of comorbidities in rural communities, those residing in rural counties with poor access to health care may have greater risk for poor health outcomes than residents of other areas8,18. However, there is limited evidence regarding joint exposure to both rurality and limited healthcare access on risk of severe COVID-19. The sole relevant study examined joint urban–rural/medically underserved area (MUA; an area with too few primary care providers, high infant mortality, high poverty rates, and/or a high elderly population19) exposure and COVID-19 testing rates, with urban/non-MUA areas having the highest testing rates20. Additional research on joint urban–rural and healthcare access exposures is needed to better understand community-level determinants of severe COVID-1921.
The purpose of this study is two-fold. First, there is sparse evidence regarding urban–rural differences in severe COVID-19 in the US11-14. Furthermore, to our knowledge, there are no data regarding joint exposure to urban–rural/MUA and risks for severe COVID-19. Second, this is the first hierarchical analysis of urban–rural differences in severe COVID-19, and this analysis allows for individuals to be nested within counties to account for both county- and individual-level factors rather than just county-level factors in ecologic analyses.
Methods
Data sources
COVID-19 case data were drawn from the Centers for Disease Control and Prevention’s (CDC) publicly available COVID-19 Case surveillance public use data with geography22. The CDC requests data from public health departments for lab-confirmed or probable cases of COVID-19, and data are routinely submitted to the CDC from public health departments via standardized case reports: demographic data, COVID-19 hospitalization and death, and state and county Federal Information Processing Standards (FIPS) codes. Data were current as of 1 October 2021.
Inclusion criteria included COVID-19-positive individual from Minnesota or Montana, diagnosis in calendar year 2020, and cases with a valid county FIPS code. Exclusion criteria included residents with missing state or county data, those not residing in Minnesota or Montana, and diagnosis before or after 2020. Data from Minnesota and Montana were included in the sample due to urban–rural variability of these states, and case data were similar between CDC data and state COVID-19 websites23,24. For Minnesota, 395 779 cases were reported to the CDC (92% of the 428 048 on the Minnesota website), and rates were similar between the CDC dataset (hospitalization rate: 5.49%, death rate: 0.97%) and the state website (hospitalization rate: 5.19%, death rate: 1.38%)23. For Montana, 57 507 cases were reported to the CDC (71% of the 81 404 cases on the Montana website), and rates were similar between the CDC dataset (hospitalization rate: 4.35%, death rate: 0.78%) and the state website (hospitalization rate: 4.78%, death rate: 1.65%)24.
The sample was drawn from 487 504 COVID-19 cases from Minnesota and Montana. The CDC suppresses FIPS codes for areas with low populations, and 34 218 (7% of total) COVID-19 cases were excluded for lack of FIPS. The final analytic sample included 453 286 (93% of total) COVID-19 cases.
County-level data were drawn from 2015–2019 American Community Survey (ACS) 5-year estimates25. County-level variables included racial concentration (percent of White residents), health insurance concentration (percent of residents with health insurance coverage), and poverty concentration (percent of residents whose income in the last 12 months was below the federal poverty level)26,27. County-level variables were included in analysis based on availability and completeness in the ACS dataset. Covariates were based on prior studies12,28-33.
County-level urban–rural status was drawn from the 2013 National Center for Health Statistics (NCHS) Urban–Rural Classification Scheme for Counties. Counties are classified as large central metro, large fringe metro, medium metro, small metro, micropolitan, or non-core based on population size and principal city population location34.
County-level MUA status was drawn from Health Resources and Services Administration’s MUA classification dataset19. MUAs represent a lack of access to health care and are designated according to an index of four criteria: ratio of primary care providers to residents, infant mortality rate, poverty rate, and elderly population19,35.
The CDC, ACS, NCHS, and MUA datasets were merged using county FIPS codes, with individuals nested within counties. The final merged dataset included 453 286 COVID-19 cases in 57 counties in Minnesota and Montana.
Variables
Outcome – severe COVID-19: If a case reported yes on hospitalization or death, they were identified as severe (dichotomized yes/no). If the case reported no, unknown, missing, or not available (NA) for both hospitalization and death, they were identified as non-severe. Unknown, missing, and NA were considered non-severe cases because these were reported cases, but no hospitalization or death was reported. If these cases were excluded, the severe COVID-19 rate for the data would be much higher than reported on state websites.
Predictor – rural county residence: Counties classified as micropolitan or non-core were rural, and counties of other classifications were urban (dichotomized urban/rural)13.
Predictor – underserved status: MUA was the county-level measure of access to health care (dichotomized MUA/non-MUA).
Predictor – joint exposure: Using the rural (urban/rural) and MUA (MUA/non-MUA) variables, a four-category joint urban–rural/MUA variable was created: urban/non-MUA, urban/MUA, rural/non-MUA, and rural/MUA.
Covariates: Individual-level covariates included age group (0–17, 18–49, 50–64, and ³65 years), race/ethnicity (White, non-Hispanic, Black, non-Hispanic, American Indian/Alaska Native, non-Hispanic, Asian/Native Hawaiian/Other Pacific Islander, non-Hispanic, Hispanic, and Other/Unidentified, non-Hispanic), and sex (male, female, and missing). County-level covariates included poverty concentration, health insurance concentration, and racial concentration. Covariates were based on prior studies12,28-33.
Statistical analysis
Descriptive statistics were obtained overall, by severe COVID-19 status, and by type of severe COVID-19 (hospitalization or death). Counts and percentages of severe case type were examined by urban–rural status, MUA status, age group, state, sex, and race/ethnicity. Medians and interquartile ranges (which included the second and third quartiles, or the middle half of the data range) of county-level covariates were examined overall and by case status.
Hierarchical logistic regression models, with individuals nested within counties, estimated odds ratios (OR) and 95%CI for the associations between rural status, MUA status, joint rural/MUA status, and severe COVID-19. Hierarchical models were selected because variables were available at both the individual level (severe COVID-19 and some covariates) and county level (rural and MUA status and some covariates). This type of model allows us to account for these available individual-level characteristics that ecologic models cannot.
In model 1, we estimated the association between rural status and severe outcomes, excluding MUA status from the model. In model 2, we estimated the association between MUA status and severe outcomes, excluding rural status. In model 3, we included both rural and MUA statuses to estimate the independent association between rural status, MUA status, and severe outcomes. We also fitted rural*MUA interaction terms to determine if there were potentially unique effects for a joint urban–rural/MUA variable. If the p-value for interaction (p-interaction) was <0.20, this was considered a statistically significant interaction. Last, we fitted models estimating the association between joint urban–rural/MUA status and severe outcomes. Rural/non-MUA was the reference, as we hypothesized that this was the lowest risk category based on models 1–3. Hierarchical logistic regression models were run overall and stratified by age for the total sample and by state. Models were adjusted for individual- and county-level covariates.
The analysis was stratified by age as older adults may face an increased risk of severe COVID-19 compared to younger age groups36. In addition, underlying health conditions that are associated with more severe COVID-19 are common conditions among older adults37. Stratifying by age allowed us to partially account for underlying health conditions in this analysis. Due to small sample size among the 0–17 years group, this age group was excluded in the state-specific age-stratified analysis.
The risk for severe COVID-19 among rural counties may have increased after August 202013. We conducted a period-stratified sensitivity analysis (prior to August 2020; August–December 2020) using the overall fully adjusted model 4 to determine if results differed before and after August 2020.
Due to the limited data, there are likely to be unmeasured confounders that may have affected results. E-values are used to estimate the minimum strength of association that an unmeasured confounder would need to have with both the exposure and the outcome, adjusted for measured covariates, to potentially explain away the observed association between the exposure and outcome38,39. We calculated E-values based on the strongest observed adjusted odds ratio (aOR) in fully adjusted model 4.
To determine if excluded cases from Minnesota and Montana differed from analyzed cases, we compared rates of severe outcomes overall, by state, and by age group.
Descriptive statistics and regression analyses were conducted using SAS OnDemand for Academics v3.8 (SAS Institute; www.sas.com). E-values were calculated using evalue-calculator.com38,39.
Ethics approval
This study was considered exempt by the University of North Dakota Institutional Review Board (protocol number IRB0004484).
Results
This analysis included 453 286 COVID-19 cases in Minnesota and Montana in 2020. Of those, 26 518 (5.85%) had severe COVID-19. The prevalence of severe outcomes in Minnesota and Montana was 6.01% and 4.75%, respectively. Prevalence of severe COVID-19 among rural/non-MUA, rural/MUA, urban/non-MUA, and urban/MUA were 4.52%, 5.53%, 6.23%, and 5.86%, respectively. Distribution of severe outcomes by demographic and county-level factors can be found in Table 1.
Hierarchical regression results are in Table 2. In model 1 (urban–rural status, excluding MUA status), the odds of severe COVID-19 among those living in a rural county were 13% (aOR: 0.87, 95%CI: 0.83–0.91) lower than those living in an urban county. In model 2 (MUA status, excluding urban–rural status), the odds of severe COVID-19 among those living in a MUA county were 24% (aOR: 1.24, 95%CI: 1.18–1.30) higher than those living in a non-MUA county. In model 3 (urban–rural status and MUA status), the odds of severe outcomes among those living in a rural county were 9% (aOR: 0.91, 95%CI: 0.87–0.95) lower than those living in an urban county, and the odds of severe outcomes among those living in a MUA county were 20% (aOR: 1.20, 95%CI: 1.13–1.26) higher than those living in a non-MUA county.
In model 4 (joint urban–rural/MUA exposure) overall, odds of severe COVID-19 were highest for those in urban/MUA counties (aOR: 1.36, 95%CI: 1.27–1.44), and urban/MUA was the only statistically significant observation (p-interaction<0.01).
In the age-stratified analysis, among those aged 65 years or more, the odds of severe COVID-19 among those living in an urban/non-MUA and urban/MUA county were 18% (95%CI: 1.10–1.27) and 44% (95%CI: 1.32–1.57) higher than the odds among those living in a rural/non-MUA county, respectively. A similar pattern of risk was observed for the 18–49 and 50–64 year age groups. Among those aged 0–17 years, aOR suggests a decreased risk of severe COVID-19 among those living in urban areas, yet CI values were wide and p-interaction was >0.20. Of note, the rural*MUA p-interaction was only statistically significant for those aged 50–64, with the highest risk being among those living in an urban/MUA county (aOR: 1.81, 95%CI: 1.58–2.07). Living in a rural/MUA county was associated with higher odds of severe outcomes only among the ≥65 year age group (aOR: 1.15, 95%CI: 1.02–1.31). p-values for interaction are included in Table 3.
In the state-stratified analysis, results varied between the two states (Table 4). In Minnesota, aOR indicated a small increase in risk among those living in urban/non-MUA counties (aOR: 1.05, 95%CI: 0.99–1.11; p-interaction 0.72). However, in Montana, compared to those in a rural/non-MUA county those living in a rural/MUA county had the highest odds of severe COVID-19 (aOR: 2.68, 95%CI: 1.99–3.61), and increased odds of severe outcomes were also observed in urban/MUA and urban/non-MUA among most age groups (p-interaction<0.01).
For comparison of excluded versus analyzed cases, only Minnesota cases were examined because Montana cases from counties with low case counts had both county FIPS and state FIPS suppressed. Overall, severe case rates were 5.90% among excluded cases and 5.85% among analyzed cases. For Minnesota, the severe case rate was 5.90% among excluded cases and 6.01% among analyzed cases (Supplementary table 1).
In the period-stratified sensitivity analysis (Supplementary table 2), odds of severe outcomes among those living in rural/MUA counties were higher prior to August 2020 (aOR: 1.16, 95%CI: 0.78–1.72) than in August to December 2020 (aOR: 1.09, 95%CI: 0.99–1.20), although confidence intervals were wide.
E-values for unmeasured confounders based on the urban/MUA joint exposure in model 4 (aOR: 1.36, 95%CI: 1.27–1.44) were estimated. For the overall model, the estimated E-valueOR was 2.06 (lower control limit E-value: 1.86). Age-specific E-valuesOR were higher than 2.06 (Supplementary table 3).
Table 1: Descriptive statistics of severe COVID-19, Minnesota and Montana, 2020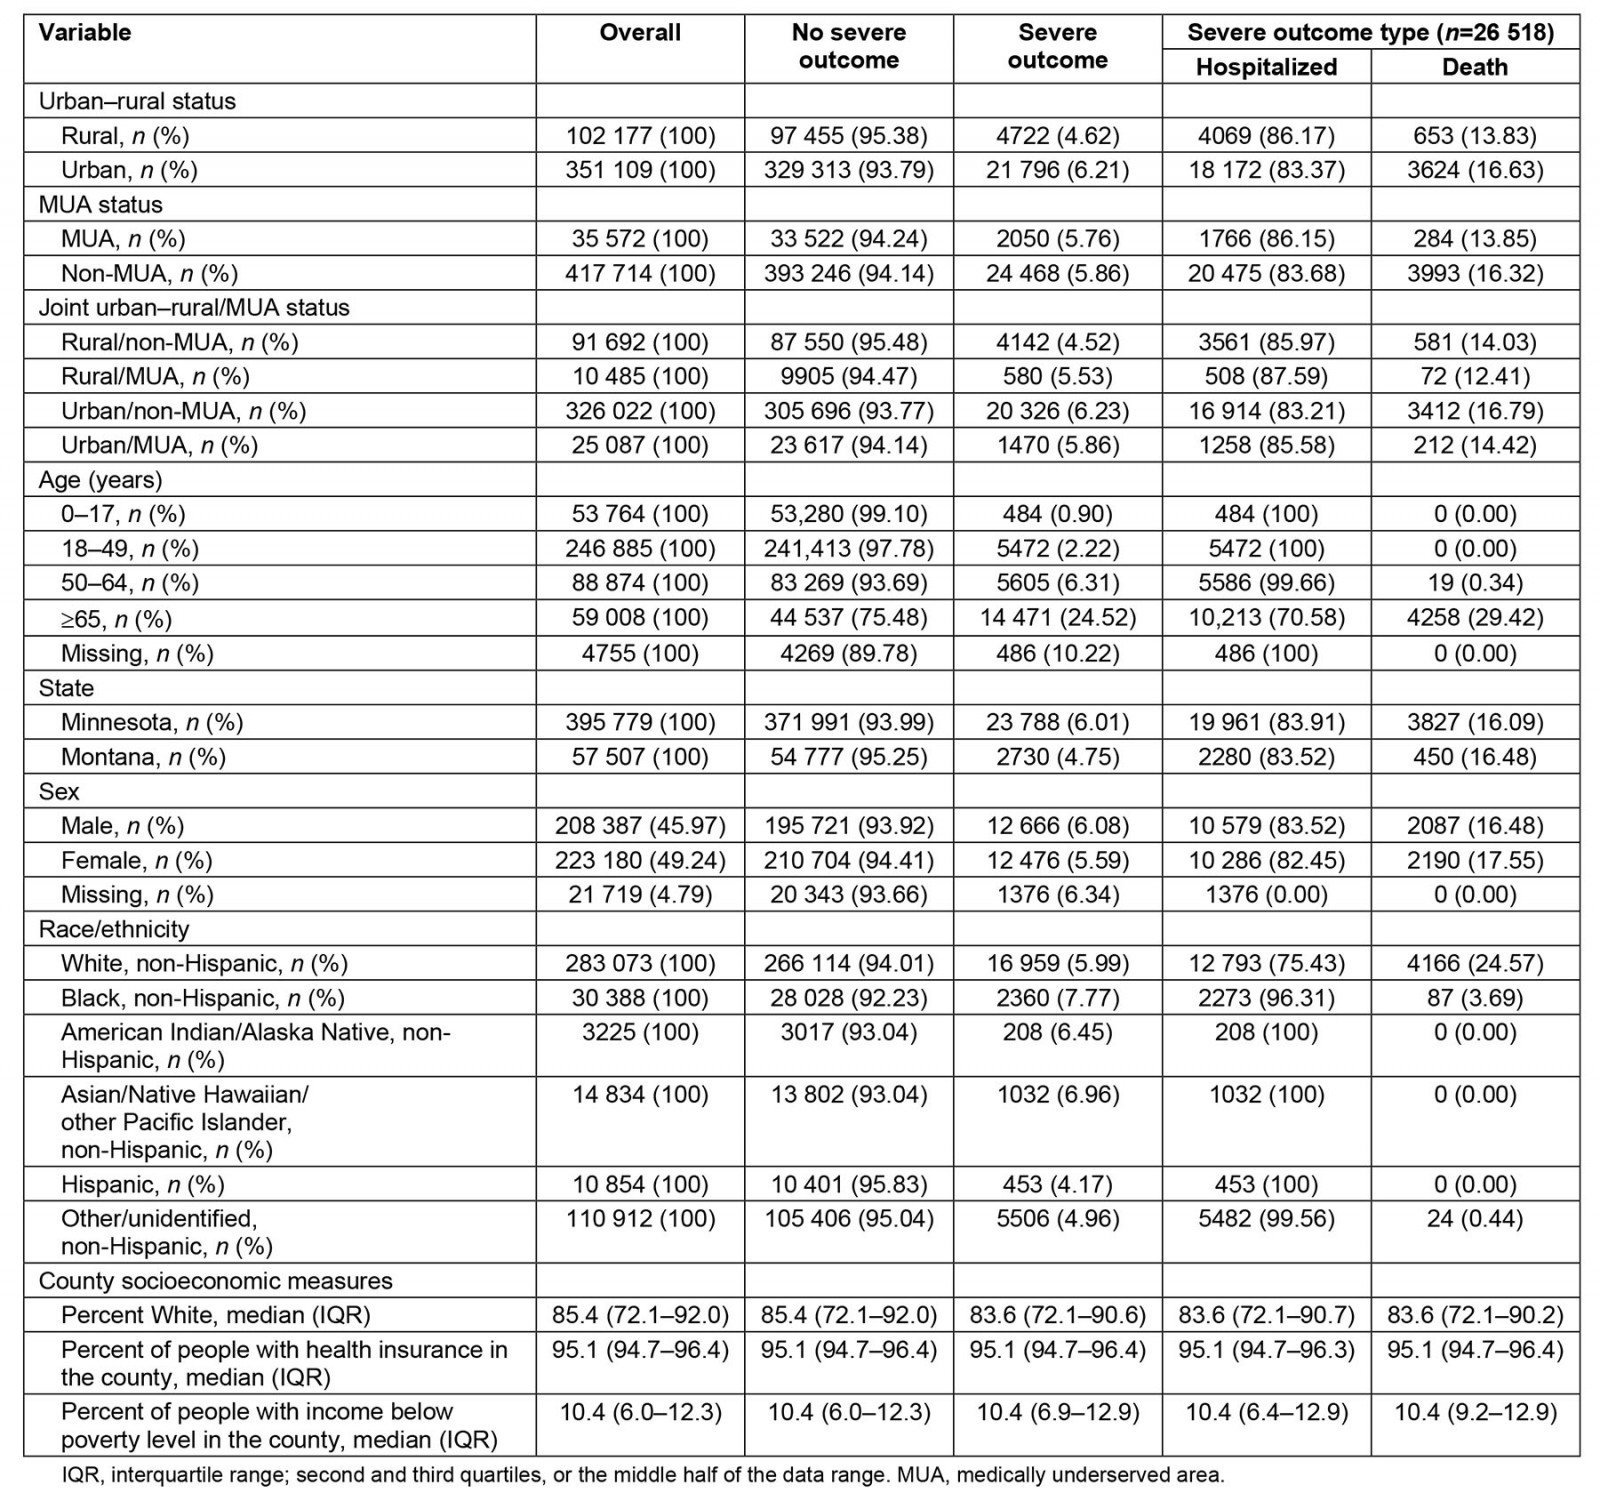
Table 2: Adjusted odds ratio of rural county and MUA county and severe COVID-19, stratified by age group, Minnesota and Montana, 2020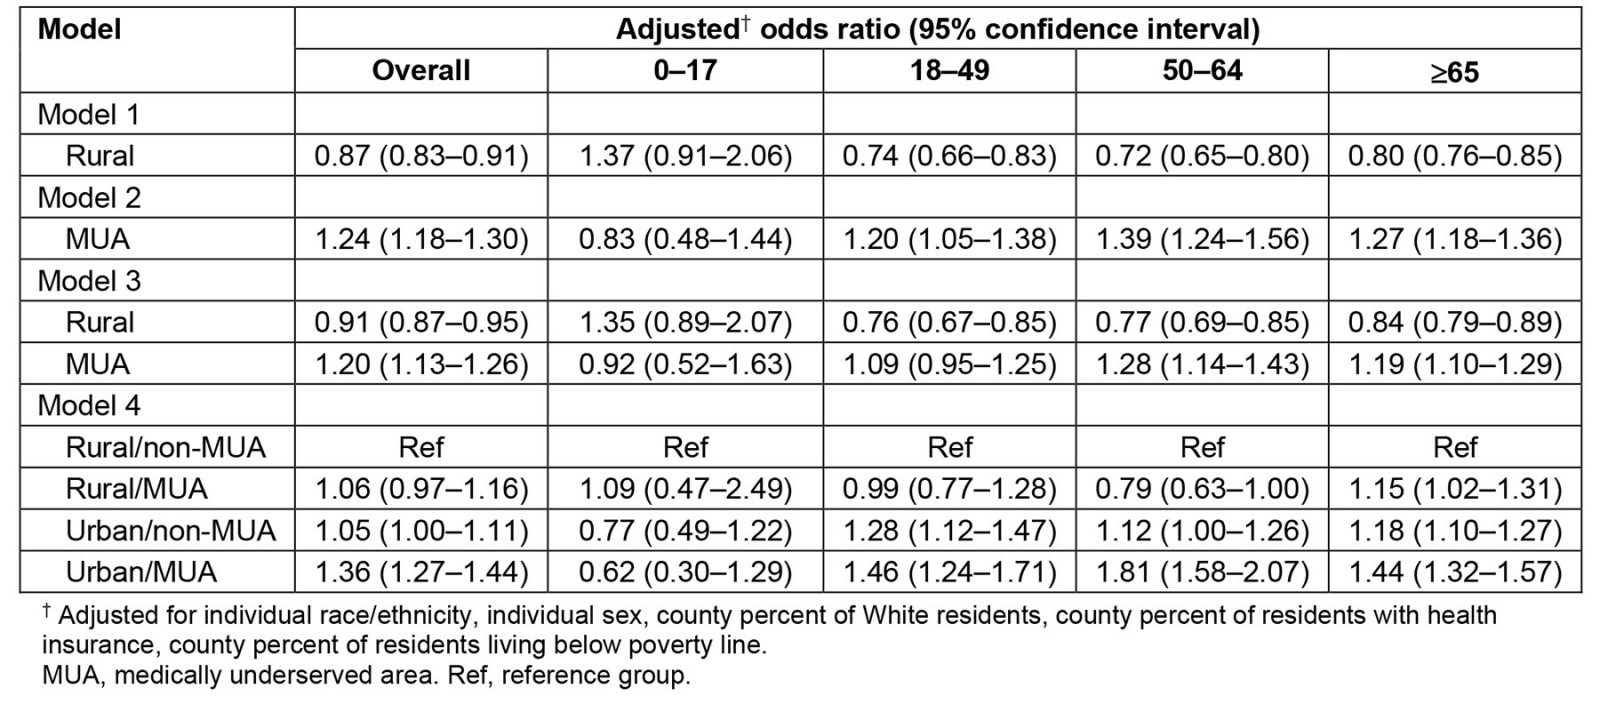
Table 3: Interaction term analysis for model 3, overall and stratified by age and state, Minnesota and Montana, 2020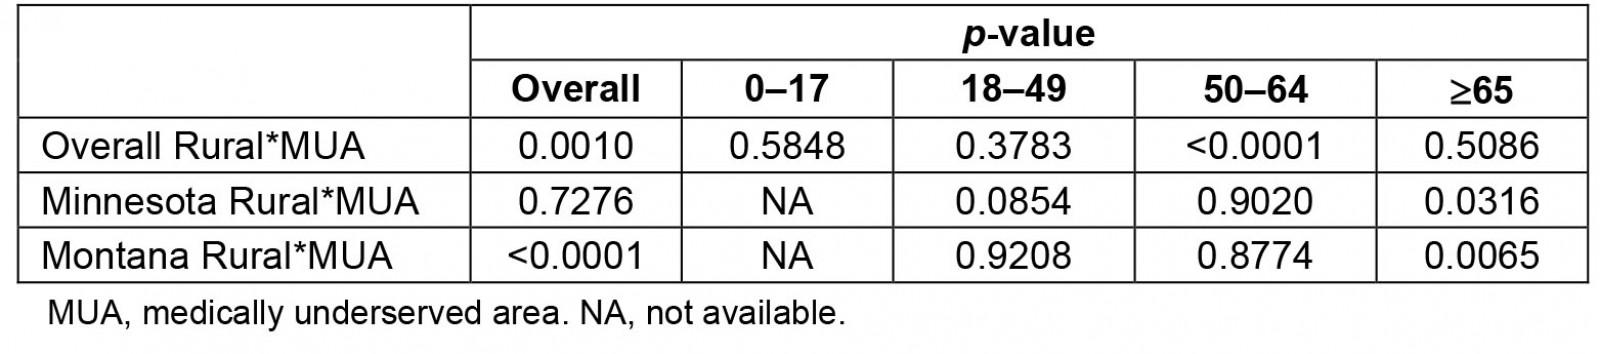
Table 4: Adjusted odds ratio of rural county and MUA county and severe COVID-19, stratified by age group and state, Minnesota and Montana, 2020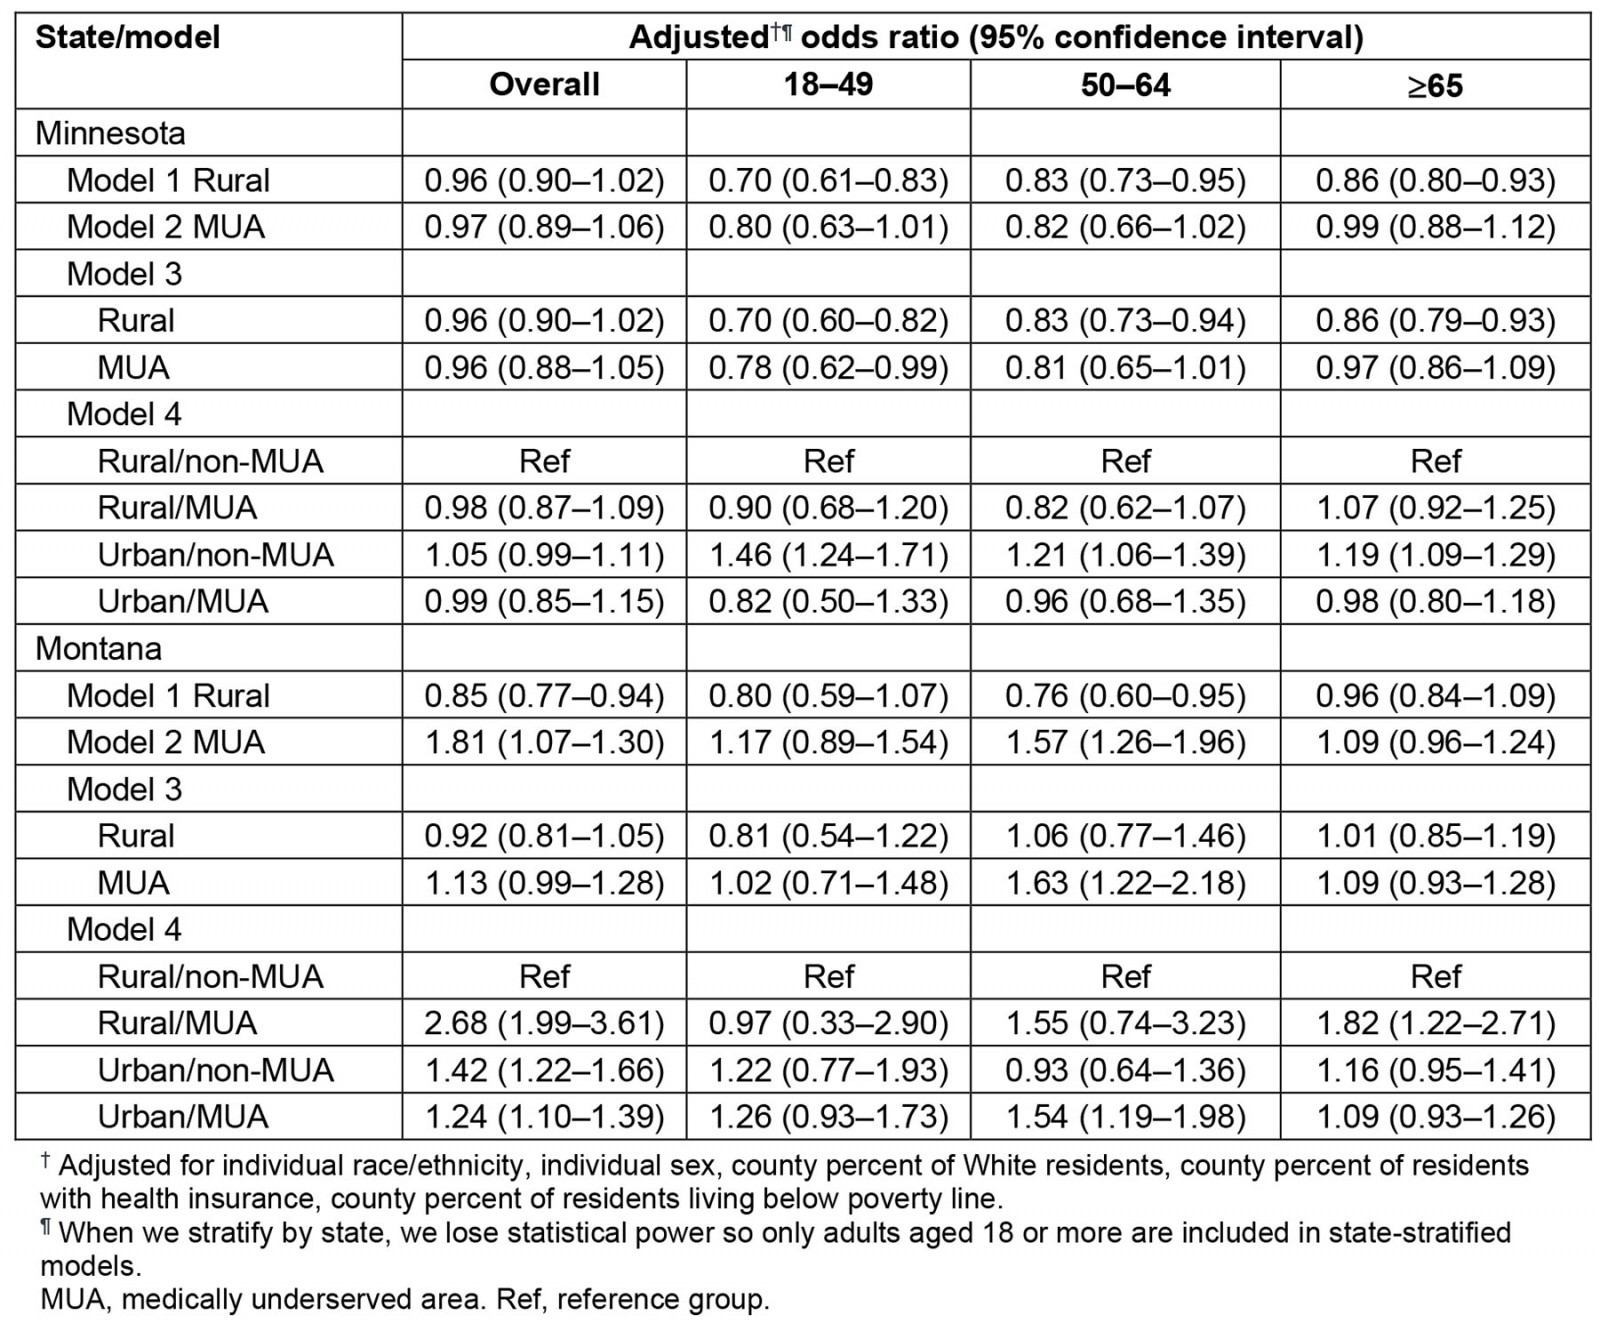
Discussion
In this study of the association between joint exposure to rural/MUA counties, results suggest lower odds of severe outcomes among rural than urban counties, higher odds among MUA than non-MUA counties, and higher odds among urban/MUA than rural/non-MUA. The association between joint exposure to rural/MUA and severe COVID-19 may vary between Minnesota and Montana.
Early in the pandemic, the observed lower risk among rural areas may have been due to lower population density and natural social distancing in rural counties5. Lower population density may have led to a slower spread of COVID-199 and has been linked to lower county-level COVID-19 mortality rates40. Similar trends were observed in the 1918–1919 influenza pandemic, with higher rates of mortality among urban populations, and timing of pandemic onset varying by population size41. More recent data suggest a similar urban–rural difference in infectious respiratory disease outbreaks. For instance, in China, from 2010 to 2018, influenza outbreaks were more intense in urban than in rural areas42.
Our observation of lower odds of severe COVID-19 among those living in rural counties aligns with two ecologic studies that examined COVID-19 mortality rates early in the pandemic11,12. One study using USAFacts data from January to June 2020 found a lower mortality rate in rural counties than in urban counties11. A second study using Johns Hopkins University data as of October 2020 found lower mortality rates in rural counties than in urban counties, independent of a range of social determinants of health12. The results from these two studies indicate a lower rate of severe COVID-19 in rural counties early in the pandemic. Data from early in the pandemic suggest those living in rural areas had better COVID-19-related outcomes than those living in rural areas in India, Ireland, Scotland, and South Africa43-46. Thus, the urban–rural difference early in the pandemic was not US-specific.
However, a third US-based ecologic study found that mortality rates shifted between urban and rural counties in 202013. This study compared COVID-19 county mortality rates over time by examining USAFacts data between March and October 2020 and found that the mortality rates were lower in rural counties from March to August 2020, with mortality rates higher in rural counties than urban counties after August 202013. Additionally, a fourth US-based ecologic study of COVID-19 county-level mortality used New York Times data from January to December 2020 and found rural county residence was associated with a higher case fatality ratio than urban counties14.
Varying time periods of analysis may partially explain different results between prior studies. Early in the pandemic (February–August 2020), COVID-19 case rates and severe outcomes rates were higher in urban than in rural counties, yet this flipped in the following months. Two studies that included a similar time period of analysis (February–October 2020) highlight this effect of time12,13. One study did not stratify by time and observed an overall protective effect of rural residence12. A second study examined three 11-week time periods and observed a protective effect of rural residence prior to August 2020 and an increased risk associated with rural residence after August 202013. Thus, observations of a protective effect of rural residence were likely driven by data early in the pandemic11,12, while the one study reporting a uniform increase in risk associated with rural residence was likely driven by data later in the pandemic14. Our period-stratified sensitivity analysis reflects the change, as urban areas had two-fold higher risk of poor outcomes prior to August 2020, and increased risk among urban areas was largely mitigated after August 2020 (Supplementary table 2). A study from South Africa also observed a shift in COVID-19 attack rates between urban and rural communities as the pandemic persisted. Specifically, the COVID-19 attack rate was higher in urban areas from March to November 2020, but higher in rural areas after November 202046.
August 2020 being a turning point in risk for COVID-19 among rural communities aligns with data regarding urban versus rural perceptions on COVID-19 prevention efforts, as well as a ‘super spreader’ event that affected rural communities across the US. Data collected in August 2020 from a largely rural state showed that individuals in rural communities were less concerned about COVID-19, less likely to social distance, and more likely to follow regular daily routines than those in urban areas; thus, in August 2020, rural communities were susceptible to local COVID-19 outbreaks47. Also in August 2020, the Sturgis Motorcycle Rally was held in South Dakota with approximately 500 000 attendees with little adherence to COVID-19 prevention measures48. As a result, COVID-19 cases in South Dakota increased by 35% in the month following the rally. Nationally, counties with a high proportion of residents attending the rally had COVID-19 outbreaks in the weeks following the rally. Rural communities in both Minnesota and Montana had relatively high numbers of attendees at the rally48. The confluence of rural communities not adhering to COVID-19 prevention practices and a ‘super spreader’ event with nationwide impacts likely contributed to the increased risk of severe COVID-19 outcomes among rural communities after August 2020.
Varying definitions of ‘rural’ may contribute to inconsistent observations among prior studies. Three prior studies and the current analysis identified rural areas by methods based on the federal Office of Management and Budget’s definition (OMB, Rural–Urban Commuting Area codes, National Center for Health Statistics urban–rural classification)11-13,49. The OMB definition identifies counties as metropolitan (50 000 or more population), micropolitan (10 000–49 999 population), or neither, and counties not classified as metropolitan are classified as rural49. The fourth prior study identified rural areas based on the US Census Bureau definition14, which identifies urbanized areas (50 000 or more population) and urban clusters (2500–49 999 population). However, ‘rural’ is not defined by the Census Bureau, as all areas outside of urbanized areas and urban clusters are considered rural. A comparison of these two methods by the Federal Office of Rural Health Policy found that the OMB definition likely includes rural areas as parts of urban counties, while the Census Bureau definition likely classifies suburban areas as rural49. Thus, the OMB definition may undercount rural populations, while the Census Bureau may overcount rural populations. These different definitions of ‘rural’ may lead to meaningful differences in conclusions of the effect of rural residence49. Taking the effect of time and varying definitions of ‘rural’ into account, accumulating evidence using ecologic and hierarchical data from USAFacts11,13, Johns Hopkins12, and CDC, we found that rural county residence was protective against severe COVID-19 early in the pandemic.
This analysis also suggests individuals residing in MUA counties had higher odds of severe COVID-19 than individuals residing in non-MUA counties. Regardless of urban–rural status, limited access to healthcare resources may put individuals at risk for severe COVID-19. Our results using MUA as a measure of healthcare access align with an ecologic study, using data from March–May 2020, that found HPSAs had significantly higher rates of COVID-19 mortality16. MUAs are communities with persistent socioeconomic disadvantages8, and populations within underserved areas have a higher prevalence of obesity, hypertension, and diabetes, which increases risk of severe COVID-1950. Our observations support the hypothesis that lack of healthcare access contributed to disparities during the COVID-19 pandemic51, yet further study is warranted regarding MUA status and COVID-19 outcomes.
We also examined the effect of joint urban–rural/MUA exposure on severe COVID-19. Compared to those living in rural/non-MUA counties, those living in urban/MUA counties had the highest odds of severe outcomes overall and among adult age groups. Adults living in urban/MUA areas had 44–81% higher odds of severe outcomes, based on age group, and those living in rural/MUA counties had a small increase in odds. Thus, MUA status may be a more important predictor of severe COVID-19 among urban counties than in rural counties due to easier spread of infection in areas with high population density. MUAs, with higher poverty, limited access to care, high uninsured rates, and a higher prevalence of comorbidities, may exacerbate the risk of severe COVID-19 in densely populated urban counties5.
The ≥65 year age group was the only age group with higher odds of severe COVID-19 among those living in rural/MUA counties compared to rural/non-MUA, highlighting important differences between these two categories of rural counties in the older adult population. Older adults often have more comorbidities than other age groups37, and those living in rural or MUA counties have higher rates of comorbidities; therefore, older adults living in rural/MUA counties may have a higher risk of severe COVID-195,18. However, rural*MUA p-interaction for those 65 years or more differed overall (p-interaction=0.50) and by state (Minnesota p-interaction=0.03; Montana p-interaction<0.01), suggesting the state of residence may confound the rural*MUA interaction.
Associations between joint urban–rural/MUA status and severe outcomes among children were inverse compared to adult age groups. In the child age group, those living in rural/MUA had the highest odds and urban/MUA had the lowest odds. However, in adult age groups, compared to rural/MUA counties, those living in rural/MUA counties had the lowest odds and urban/MUA counties had the highest odds for severe outcomes. Although CI values were wide, results suggest that children had a different experience during the first year of the pandemic than adults. There is evidence that fewer children get severely sick and generally have milder symptoms, especially early in the pandemic52,53. Rurality and healthcare access may have a greater impact on adults because their infections are generally more severe. Research is warranted to better understand these exposures among children.
In the state-stratified analysis, results varied between Minnesota and Montana. In Minnesota, compared to living in a rural/non-MUA county, living in a rural/MUA or urban/MUA county had small lower odds of severe outcomes, while those living in urban/non-MUA counties had higher odds. In Montana, living in a rural/MUA, urban/non-MUA, or urban/MUA county was associated with higher odds. Differences between states could be attributed to varying state-level COVID-19 mitigation policies54. Minnesota’s stay-at-home order lasted from 27 March to 4 May 2020, but limits for businesses, indoor events, gatherings, bars, and restaurants were in place until 28 May 202155. Montana’s stay-at-home order lasted from 26 March to 24 April 2020, and mainly affected retail and restaurants55. Minnesota’s policies may have resulted in a more even distribution of risk for severe COVID-19 across all counties, whereas Montana’s less restrictive policies may have contributed to varied risk across age groups and urban–rural/MUA status.
The CDC data used in this analysis have limited information on individual-level medical and demographic risk factors. We estimated E-values to determine the effect of unmeasured confounders. Based on the fully adjusted model 4 results, we calculated E-values for the highest observed aOR (urban/MUA) overall and by age group. The estimated E-valueOR for the overall model was 2.06, suggesting that an aOR of at least 2.06 between unmeasured confounders and both urban–rural/MUA status and severe COVID-19 must be found for the unmeasured confounders to completely explain away the observed association. Obesity, an unmeasured confounder of high prevalence in the US6, is associated with a low-to-moderate increased risk of COVID-19 hospitalization and death, with adjusted rate ratios among obese adults compared to healthy adults ranging from 1.07 to 1.3356. In addition, there is a moderate association between obesity and living in a rural area, with an aOR of 1.19 (95%CI: 1.06–1.34)57. Given that these associations between obesity and severe outcomes and urban–rural status are lower than the observed E-valueOR of 2.06, we are confident that our results are robust, and similar associations would be found if obesity was included in analysis (Supplementary table 3).
Other unmeasured chronic conditions may also affect this association. A systematic review found high odds of severe COVID-19 among those with cardiovascular disease (OR: 3.86, 95%CI: 2.70–5.52), hypertension (OR: 2.56, 95%CI: 2.12–3.11), and diabetes (OR: 2.54, 95%CI: 1.89–3.41)58. However, there is evidence that individual factors may only have a moderate association with community-level indicators59. For example, a study found only moderately higher odds of diabetes among rural residents (aOR: 1.19, 95%CI: 1.01–1.20)60. Given the association between comorbidities and severe COVID-19 is greater than the observed E-valueOR (2.06), and the association between rural residence and obesity is less than the observed E-valueOR, our findings may overstate the true relationship between urban–rural/MUA status and severe COVID-19. However, our observations still suggest a meaningful association (Supplementary table 3).
Strengths and limitations
This study has several notable strengths. First, we used hierarchical logistic regression models that adjusted for both individual- and county-level covariates, which is not possible in ecologic analyses. Second, a joint urban–rural/MUA exposure variable allows us to better understand the different scales of interaction between rurality and MUA status. No literature to date has examined associations between joint urban–rural/MUA exposure and severe COVID-19. Third, more than 453 000 COVID-19 cases from Minnesota and Montana were included in the analysis, which represents approximately 90% of the total cases reported in the two states in 202023,24. This large sample size and coverage of the states provided more generalizable results.
These results should be considered in the context of limitations. First, analysis was limited to cases in Minnesota and Montana counties in 2020, which limits the generalizability of the findings. However, 92% of Minnesota cases and 71% of Montana cases were represented in the data. Second, because of varying reporting procedures between states, many observations had missing values. Outcome variables were included regardless of missing status by reclassifying data to include unknown, missing, and NA outcome variables as no severe outcome, yet hospitalization and mortality rates were consistent between state COVID-19 reporting websites and the CDC data with our parameterization of the outcome variable. Third, cases with missing FIPS codes were excluded. For Minnesota, cases from counties with low case counts had county FIPS codes suppressed. For Montana, cases from counties with low case counts had both county FIPS and state FIPS suppressed. Thus, we were only able to examine excluded cases from Minnesota. Comparing excluded cases to the analytic sample from Minnesota suggests distribution of demographic factors were similar between these two groups, minimizing concerns about bias (Supplementary table 1). In addition, given that Montana counties with low case counts were suppressed and were likely rural counties, the reported risk of severe COVID-19 is biased towards the null. If all counties were included, we would likely see it is underreporting before August 2020 and overreporting after August. Finally, due to missing values and lack of reporting in the CDC data, we were unable to include data on other factors associated with severe COVID-19, including ICU admission, intubation, and mechanical ventilation, as an outcome variable in our analysis.
Conclusion
These results suggest that severe cases of COVID-19 were more pronounced in urban/MUA counties in the early stages of the COVID-19 pandemic, suggesting the virus proliferated in urban/MUA counties early before moving into rural and non-MUA counties3. The results highlight the need for locality-based public health recommendations that account for underserved areas, as opposed to state- or national-level blanket approaches. Results can also help plan for a potential next pandemic by identifying community characteristics of counties that are most in need of resources and education. Further research should continue to understand the impact of COVID-19 on rural and MUA counties throughout and after the pandemic.
Funding
Funding was obtained from the National Institute of General Medical Sciences of the National Institutes of Health (grant number P20GM139759).
Funding sources had no role in the study design; in the collection, analysis and interpretation of data; in the writing of the report; and in the decision to submit the article for publication.
Conflicts of interest
The authors have no competing interests to report.
References
You might also be interested in:
2020 - Patient and provider perspectives on eHealth interventions in Canada and Australia: a scoping review