


Introduction
The oral and maxillofacial (OMF) complex encompasses all hard and soft tissues of the face and jaws1,2. Also known as the oro-facial complex, it can be anatomically defined into the following components. ‘Oral’ refers to the structures linked to the oral cavity including the lips, dentition, gingiva, buccal mucosa, labial mucosa, tongue, floor of mouth, tonsils, pillar of fauces, hard and soft palate1,2. ‘Maxillo’ refers to the jaws and surrounding structures such as the maxillary and mandibular bones, dentoalveolus and temporomandibular joint1,2. ‘Facial’ refers to the facial soft tissue, peri-orbital region, nasal cavity, paranasal sinuses, facial muscles, masticatory muscles and the remaining facial skeleton1,2. OMF injuries have a great impact on social and health outcomes. They can severely impact an individual’s self-esteem, in addition to diminishing functional capabilities such as senses of vision, hearing, smell, taste, and voluntary digestive processes such as mastication and deglutition3.
OMF injuries are a broad category, and the patterns of injury can be diverse and concomitant. Generally, the injury is initially defined as a soft tissue and/or hard tissue injury3-6. Soft tissue injuries include abrasions, contusions, lacerations and avulsions3-6. Facial fractures are often categorised by the region of the facial skeleton that has fractured. The most common sites of facial fractures in order of occurrence are the orbital walls, zygoma, mandible and nasal bones7. Additionally, fractures can be regionally designated based on the anatomical subunit of the facial skeleton affected by the injury, as listed in Table 18.
These fractures may be isolated to one bone or involve the complex of multiple bones along a single or multiple anatomic subunits. A fracture involving all subunits is known as a panfacial fracture3-7.
The aetiology of OMF injuries can also be quite diverse. In Australia, four primary mechanisms of trauma account for approximately 95% of injuries: assault, falls, sports-related incidents, and motor-vehicle accidents (MVA) respectively7,9. Males have a predilection of injury three times that of females10. These mechanisms of injury can be influenced by social and geographic factors6,10. For example, while assault-related cases are the leading cause of OMF injuries in Australia, countries in South America, the Middle East and Africa tend to have a higher prevalence of injuries due to MVAs, potentially due to less stringent traffic laws11,12. OMF injury from assault also shares correlation with alcohol consumption. This is evident in Islamic countries (where alcohol consumption is prohibited) that report lower assault-related facial trauma13, compared to countries such as Australia, where public alcohol consumption is more socially accepted and rates of assault injuries are higher11,12.
Patterns of OMF injuries can be significantly influenced by geographical location. In rural areas, factors such as prevalence of high-risk occupations contribute to a higher incidence and severity of any form of trauma compared to metropolitan regions. Additionally, compared with people living in metropolitan areas, people who reside in rural areas have fewer education and employment opportunities, greater socioeconomic disadvantage, less healthcare access and are more likely to engage in substance use14,15. Social and geographic factors can enhance disparities even within towns and cities14, especially in Queensland, an Australian state that has an extensive land area, comparable in size to some small countries14,15. Evidence demonstrates the association of these social determinants with a higher likelihood of experiencing physical injuries, as well as the ability to access appropriate management for such injuries14. Due to the influence of social determinants on the occurrence of injury, it is insufficient to generalise occurrences and aetiologies without considering social and geographical factors.
Although the epidemiology of OMF injuries in Australia has been documented, there remains a significant gap in understanding how rurality influences these injuries16. Most studies overlook the rural context, focusing instead on urban populations or specific hospitals, potentially leading to a misrepresentation of data7,17-31. Conversely, studies that have investigated geographical prevalence as the primary outcome focus very little on aetiological mechanisms of injury32. Particularly in the state of Queensland, there is a relative scarcity of literature on this topic, especially a body of evidence that offers a comprehensive perspective with a large, multi-regional sample population16. This study addresses this gap by examining the prevalence and causes of OMF injuries specifically within rural Queensland, aiming to provide insights that are critical for improving rural health outcomes. Consequently, this study not only addresses this critical gap in the literature but also provides novel insights into the epidemiology of OMF injuries across Queensland, with a particular focus on rural areas. By using a comprehensive, broad dataset spanning several years, the research offers a unique perspective that can significantly inform public health initiatives, resource allocation and policy development aimed at reducing the incidence and impact of these injuries, particularly in underserved rural areas.
Table 1: Types of dento-alveolar injuries and facial factures
| Dento-alveolar injuries | Facial fractures |
|---|---|
|
Crown fractures (complicated or uncomplicated) Root fractures Alveolar fractures Concussions (tooth pain with no displacement or mobility) Luxations (tooth displacement) Subluxations (tooth mobility with no displacement) Dental avulsions |
Frontal unit fractures:
|
Methods
A retrospective audit was conducted using hospital data obtained from the Queensland Injury Surveillance Unit (QISU)33 for the period of 1 January 2015 to 31 December 2021. QISU is a state injury register with a surveillance system directly linked to a hospital’s emergency department triaging software33. Injury data is collected at the point of triage, and every record is validated and coded in accordance with the National Data Standards for Injury Surveillance34, a recognised framework designed to support public health surveillance of injuries.
The parameters recorded by the QISU and analysed in this project were:
- patient demographics: age and gender
- mechanism of injury: collision with person, collision with object, fall, animal-related, transport-related, other external cause
- intent of injury: accident, maltreatment and/or sexual assault, unspecified assault, other intent
- nature of injury, in accordance with the International Statistical Classification of Diseases and Related Health Problems 10th Revision (ICD-10-AM)35: superficial injury, open wound, facial fracture, dislocation, crushing injury of the face, burn or corrosion, unspecified injury
- location of injury, in accordance with Australian Statistical Geographic Standard – Remoteness Area (ASGS-RA)36.
The ICD-10-AM, utilised by the QISU, acts as a universal classification system employed for recording diagnoses of various health conditions, including facial trauma35. The ICD-10-AM assigns principal diagnoses to all episodes of hospital admissions. These principal diagnoses essentially represent the primary reason for a patient’s hospital admission. In practice, each admission corresponds to a specific ICD code that is stored within the QISU’s electronic database.
The main relevant codes analysed for OMF injuries were:
- S00: superficial injury of the head (except S00.4)
- S01: open wound of the head (only S01.0 and S01.3)
- S02: fracture of skull and facial bones
- S03: dislocation, sprain and strain of joints and ligaments of head
- S07: crushing injury of head (only S07.0, S07.8, S07.9).
Codes were excluded if the injury did not fit under the anatomical definition of the OMF complex (eg S00.4 was excluded as it was an injury of the ear). Due to the variety and concomitant nature of trauma, codes that were inclusive of injuries to the OMF complex were also accounted for. This mainly included injuries involving multiple or unspecified body regions. A data custodian at the QISU included these codes in the dataset only if the recorded triage notes specified an injury to the OMF region.
- S09: other and unspecified injuries of the head
- T00–T07: injuries involving multiple body regions
- T14: injury of unspecified body region
- T20: burn and corrosion of head and neck
- T26: burn and corrosion confined to eye and adnexa (only T26.0, T26.4, T26.5)
- T28: burn and corrosion of internal organs (only T28.0 and T28.5)
- T29–T32: burn and corrosion of multiple and unspecified body regions.
Incidence rates were calculated as the average annual incidence per 100,000 population, accounting for the 7-year study period. Instead of using a single-year population denominator, an annualised population was calculated:
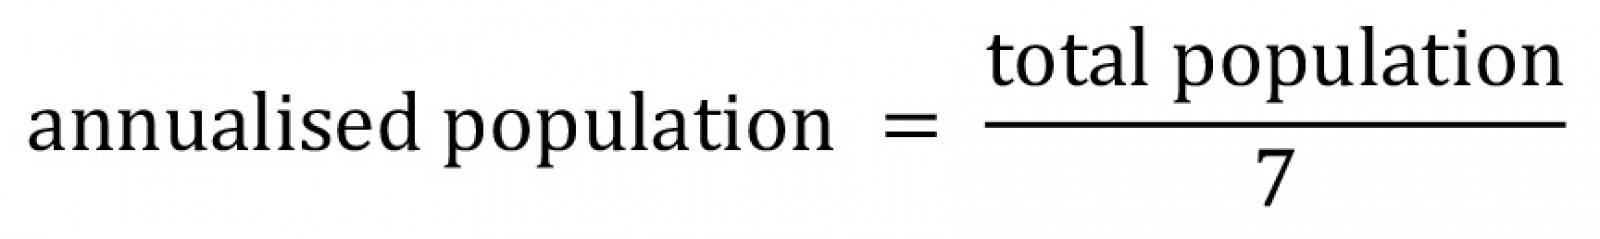
The annualised incidence rate was then computed for each region as follows:

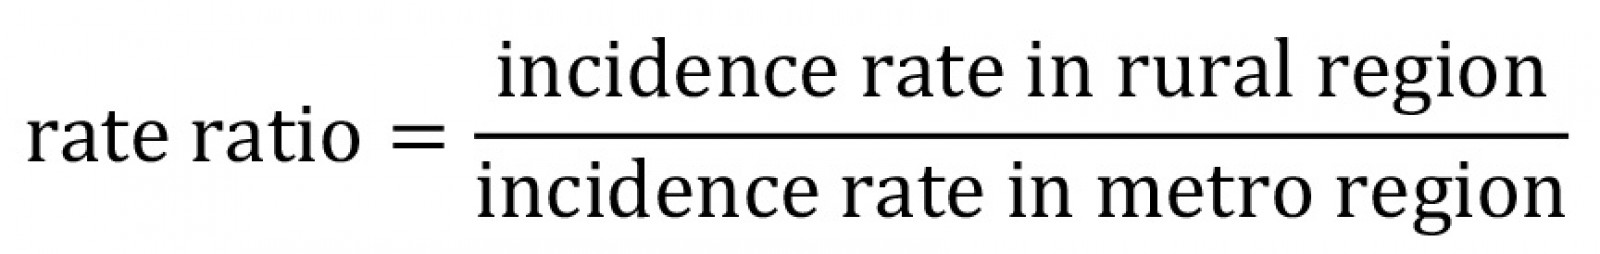
Rate ratios and 95% confidence intervals (CI) were used to compare rural incidence rates against the metropolitan population as a reference.
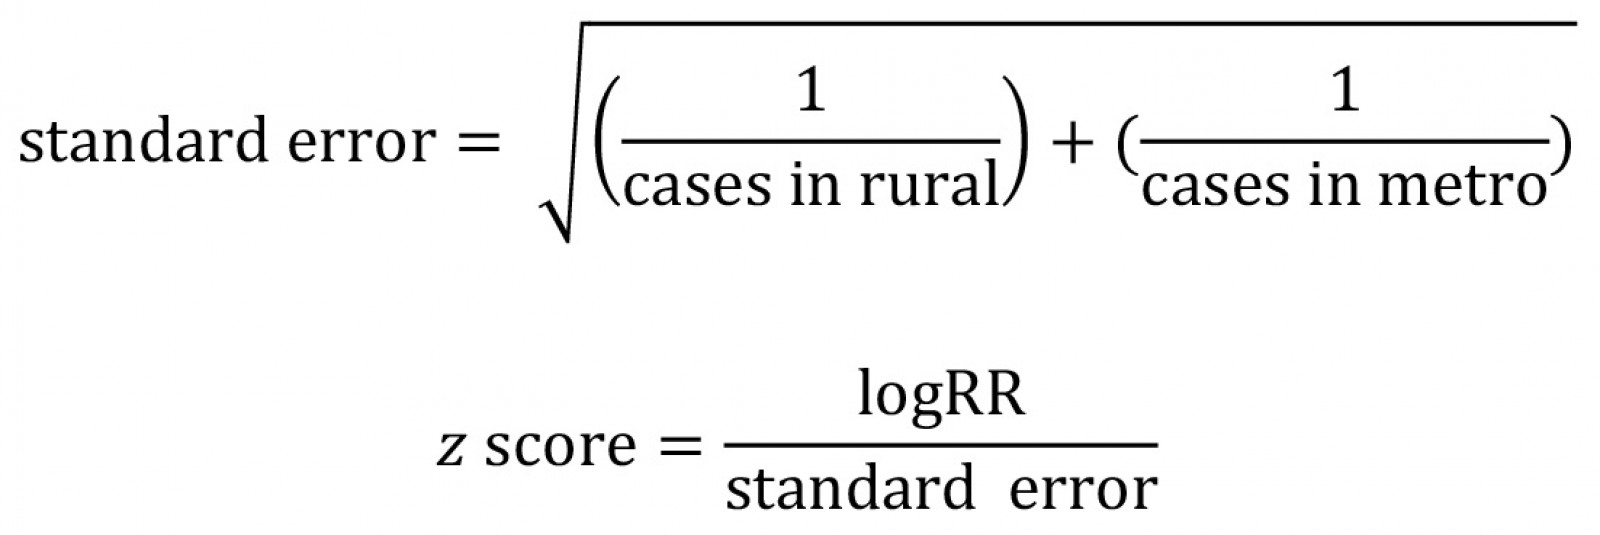
Standard errors for log-transformed rate ratios were calculated using Poisson assumptions for uncertainty, and statistical significance was determined using two-tailed z-tests.
All statistical analyses were performed using Python v3.11.5 (Python Software Foundation; https://www.python.org). A p-value of less than 0.05 was considered statistically significant. Rate ratios with 95%CIs were also used to compare gender-specific and age-specific incidence rates across all geographical regions. Additionally, male-to-female incidence rate ratios were calculated within each region to assess gender differences.
To assess changes in OMF injury prevalence over time, a linear regression analysis was performed separately for all geographical regions. The dependent variable was the annual number of injury cases (2015–2021), while the independent variable was year (as a continuous variable).
For each region, an ordinary least squares regression model was fitted, and the slope coefficient (β) was extracted to determine the rate of increase in injury cases per year. Statistical significance was assessed using p-values (α=0.05), with R² values reported to evaluate model fit.
Descriptive statistics were used to summarise the distribution of mechanism of injury and intent of injury across all areas. To determine whether these distributions differed significantly between geographic regions, χ2 tests for independence were conducted.
For comparisons between individual regions, odds ratios (ORs) with 95%CIs were calculated to quantify the likelihood of specific injury mechanisms and intents occurring in one region compared to another.
Ethics approval
Ethics approval for this study was granted by the Royal Brisbane and Women’s Hospital Human Ethics and Research Committee (HREC/2022/QRBW/84725), which included waiver of consent due to the retrospective nature of the study.
Results
The dataset recorded 9247 people who incurred an OMF injury between January 2015 and December 2021. Of these, 152 people were excluded from analysis as they had an unspecified gender or location of injury, resulting in 9095 OMF injuries included in this analysis. Major cities recorded the highest number of injuries with 3801 cases. This was followed by outer regional, inner regional, very remote and remote, respectively. Table 2 and Appendix I summarise OMF injury occurrences across ASGS-RA categories. When accounting for their respective geographical annualised populations, over the 7-year study period, the annualised incidence rate of OMF injuries per 100,000 (Fig1) escalated as the rurality proceeded from major cities (114), inner regional (199), outer regional (245), remote (994), to very remote (1334) areas. Regarding risk of OMF injury, compared to major cities, incidence rate ratio:
- Inner regional areas had a 1.8 times higher risk (95%CI: 1.5–2.1, p<0.05).
- Outer regional areas had a 2.2 times higher risk (95%CI: 1.9–2.5, p<0.05).
- Remote areas had an 8.7 times higher risk (95%CI: 6.8–11.1, p<0.05).
- Very remote areas had an 11.7 times higher risk (95%CI: 9.7–14.1, p<0.05).
These findings indicate a strong, statistically significant relationship between increasing rurality and higher facial trauma incidence rates. The effect size was most pronounced in remote and very remote regions, where the incidence rates were 8–11 times higher than in major cities.
Table 2: Total number of injuries (Queensland Injury Surveillance Unit data, 2015–2021) across ASGS-RA classifications
| Australian Statistical Geographic Standard – Remoteness Area class | n (%) |
|---|---|
| Major Cities | 3801 (41.8) |
| Outer Regional Queensland | 2449 (26.9) |
| Inner Regional Queensland | 1372 (15.1) |
| Very Remote Queensland | 951 (10.5) |
| Remote Queensland | 522 (5.7) |
| Total | 9095 (100) |
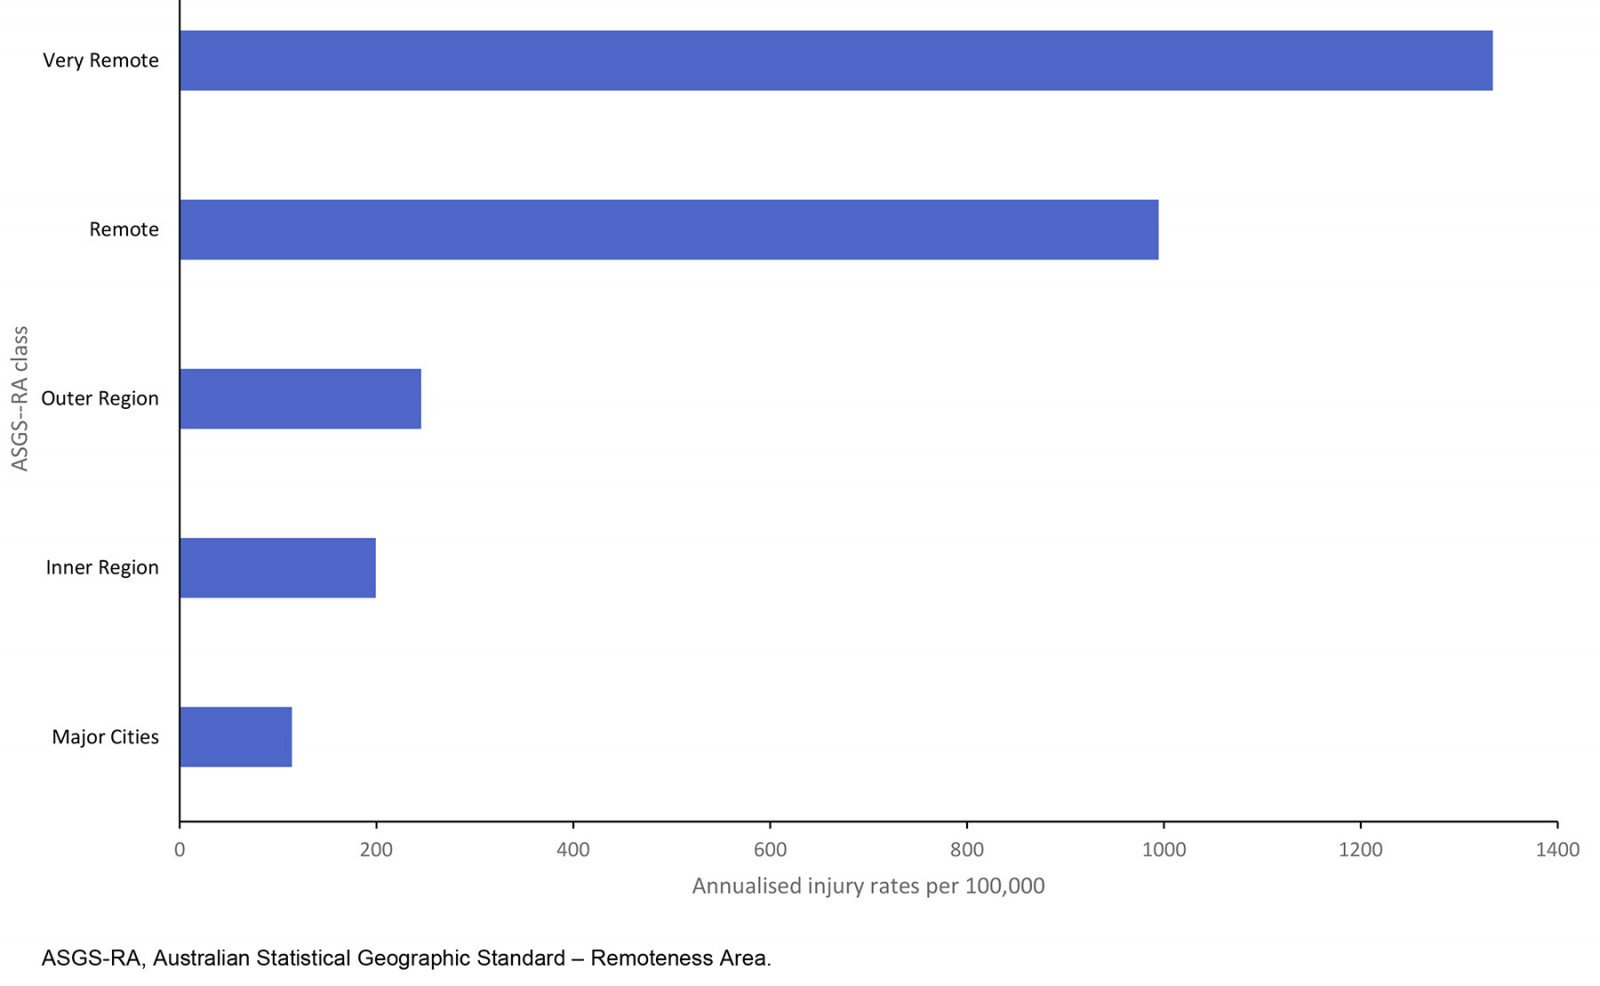 Figure 1: Geographical distribution of oral and maxillofacial injuries per 100,000 (Queensland Injury Surveillance Unit data, 2015–2021).
To simplify subsequent data visualisation and better compare the disparity between metropolitan and rural areas, the five separate ASGS-RA categories were combined to three categories: ‘metropolitan (metro) group’ (major cities), ‘regional group’ (inner and outer regional) and ‘remote group’ (remote and very remote). Accounting for this modification, the regional group had the highest overall prevalence of OMF injuries, totalling 3821 cases, slightly surpassing the metro group's 3801 cases across the 7-year study period (Fig2). The remote group recorded 1474 cases during this time. Moreover, the prevalence of injuries showed notable increases across all groups with respect to time, and the most pronounced rise occurring in the regional group (102.1%), followed by the remote group (78.8%), and the metro group (32.7%) from 2015 to 2021.
A linear regression analysis was conducted to compare the rate of increase in OMF injuries over time across metro, regional and remote areas (Table 3). The analysis revealed statistically significant increasing trends in all three regions (p<0.05).
Table 3: Linear regression comparing yearly rise in oral and maxillofacial injuries (Queensland Injury Surveillance Unit data, 2015–2021)
| Region | Slope (additional cases per year) | R2 (goodness of fit) | p-value |
|---|---|---|---|
| Metropolitan | 22.9 | 0.73 | 0.015 |
| Regional | 74.4 | 0.79 | 0.007 |
| Remote | 24.4 | 0.93 | 0.0005 |
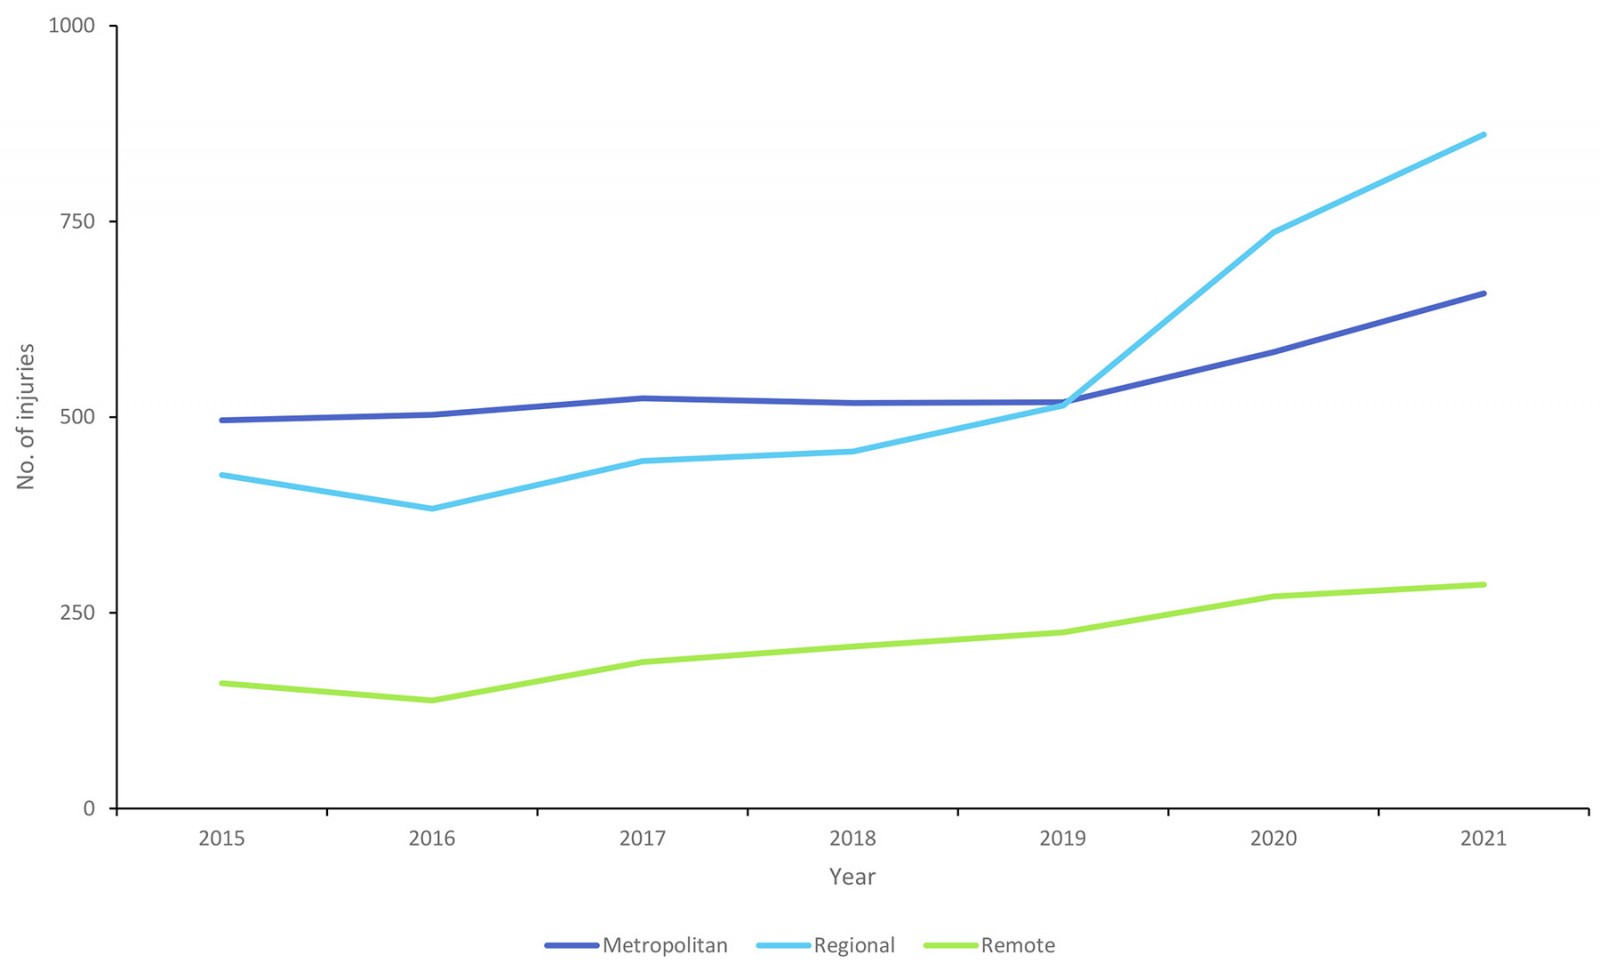 Figure 2: Oral and maxillofacial injuries by year (Queensland Injury Surveillance Unit data, 2015–2021).
While metro and remote areas showed significant increases in injuries over time (+22.9 and +24.4 cases per year, respectively), the rate of increase was substantially greater in regional areas (+74.4). The highest statistical significance was observed in remote areas (p=0.0005, R²=0.93), suggesting a consistent and accelerating trend in injury cases in remote populations.
Across all three geographic categories, males accounted for the majority of OMF injuries. Gender distribution was analysed using χ2 tests within each region. In the metro group, out of 3801 total cases, 2609 (68.6%) were male and 1192 (31.4%) were female (χ²(1)=272.9, p<0.001) (Fig3). The regional group recorded 3821 total injuries, of which 2531 (66.2%) were male and 1290 (33.8%) were female (χ²(1)=206.3, p<0.001). Similarly, in the remote group, from a total of 1473 cases, males again predominated with 1047 (71.1%) cases compared to 426 (28.9%) females (χ²(1)=136.1, p<0.001). Males had approximately twice the incidence of injury as females across all regions, with the male-to-female ratio being 2.3:1 in metro areas, 2.0:1 in regional areas and 2.3:1 in remote areas.
Over the 7-year study period, the annualised incidence rate of facial trauma was higher among males than among females across all regions (Table 4). The incidence rate increased significantly with rurality, with the highest rates observed in remote areas. The gender gap remained relatively stable across different levels of rurality. However, rurality itself was a strong predictor of increased trauma risk for both males and females, with remote areas exhibiting over 10 times the incidence rate observed in metropolitan regions.
Table 4: Annualised incidence rates (per 100,000 population) and rate ratios for oral and maxillofacial injuries in all geographic regions with respect to gender (Queensland Injury Surveillance Unit data, 2015–2021)
| Gender | Metropolitan | Regional | Remote | ||||||||
|---|---|---|---|---|---|---|---|---|---|---|---|
| Annualised IR | RR | 95%CI | Annualised IR | RR | 95%CI | p-value | Annualised IR | RR | 95%CI | p-value | |
| Male | 22.9 | 1.0 | (reference) | 43.0 | 1.9 | 1.6–2.2 | <0.001 | 232.8 | 10.2 | 8.4–12.3 | <0.001 |
| Female | 10.0 | 1.0 | (reference) | 21.8 | 2.2 | 1.8–2.7 | <0.001 | 102.1 | 10.2 | 7.6–13.7 | <0.001 |
CI, confidence interval. IR, incidence rate. RR, rate ratio.
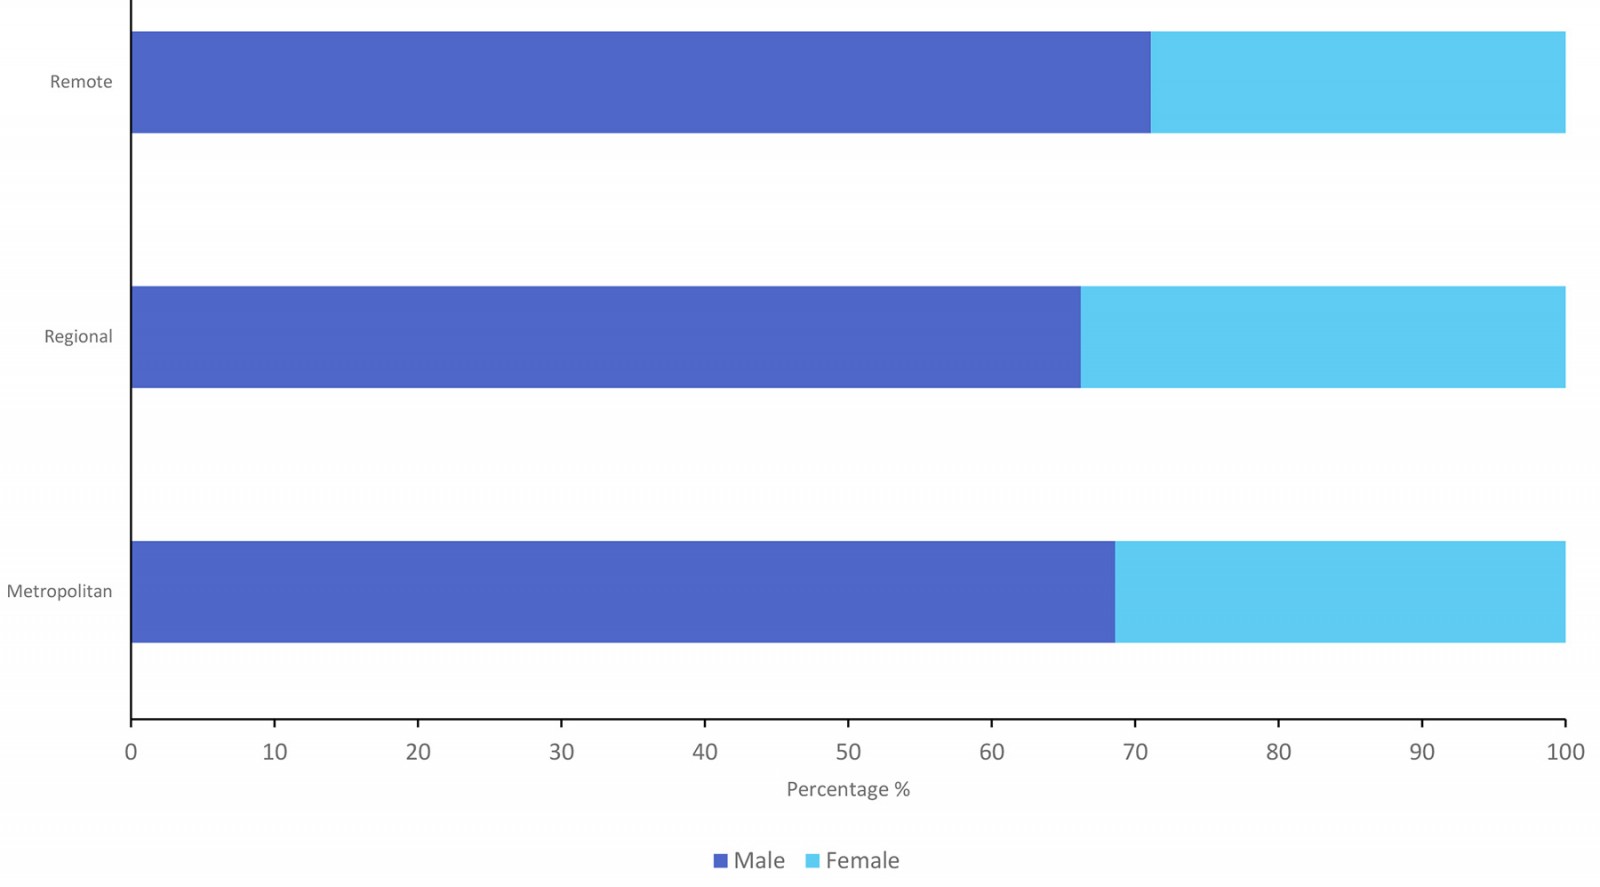 Figure 3: Gender distribution of oral and maxillofacial injuries in remote, regional and metropolitan populations (Queensland Injury Surveillance Unit data, 2015–2021).
The age distribution demonstrated distinctive patterns across the three categories (Fig4). The mean age varied notably, with younger age groups experiencing high rates of injury across all regions. In the metro group, the most prevalent age group was 0–4 years (14.7%), followed by 20–24 years (12.4%). In contrast, the regional group displayed a notably higher proportion of injuries in young adults: the highest prevalence was in the 20–24-year age group (12.5%), closely followed by 15–19 years (11.8%). Similarly, the remote group displayed injuries in those aged 20–24 years (15.9%) and 15–19 years(15.1%), representing the highest concentration among all other ages. The mean age of OMF injury cases varied across geographic regions, with younger individuals being more affected overall. The metro group had a mean age of 26.2 years (interquartile range (IQR)=25), while regional (30.7 years, IQR=25) and remote (29.5 years, IQR=20) populations had slightly higher mean ages.
Over the 7-year study period, the annualised incidence rate of facial trauma varied across age groups and was significantly influenced by rurality (Table 5). These findings indicate that facial trauma incidence is strongly associated with younger age groups (15–44 years) and rurality, with remote regions experiencing disproportionately higher rates across all age groups. The greatest disparities were observed in young adults (20–24 years), where incidence rates were over 18 times higher in remote areas compared to metropolitan regions (p<0.05).
Table 5: Annualised incidence rates (per 100,000 population) and rate ratios in all geographic regions with respect to age (Queensland Injury Surveillance Unit data, 2015–2021)
| Age group (years) | Metropolitan | Regional | Remote | ||||||||
|---|---|---|---|---|---|---|---|---|---|---|---|
| Annualised IR | RR | 95%CI | Annualised IR | RR | 95%CI | p-value | Annualised IR | RR | 95%CI | p-value | |
| 0–4 | 41.2 | 1.0 | (reference) | 45.5 | 1.1 | 0.8–1.6 | 0.61 | 97.6 | 2.4 | 1.2–4.8 | <0.05 |
| 5–9 | 25.4 | 1.0 | (reference) | 32.5 | 1.3 | 0.8–2.0 | 0.25 | 104.1 | 4.1 | 2.1–8.2 | <0.05 |
| 10–14 | 24.9 | 1.0 | (reference) | 37.8 | 1.5 | 1.0–2.3 | <0.05 | 135.1 | 5.4 | 2.9–10.3 | <0.05 |
| 15–19 | 26.8 | 1.0 | (reference) | 63.2 | 2.4 | 1.6–3.4 | <0.05 | 459.9 | 17.2 | 11.1–26.6 | <0.05 |
| 20–24 | 30.0 | 1.0 | (reference) | 75.2 | 2.5 | 1.8–3.5 | <0.05 | 542.2 | 18.0 | 12.3–26.4 | <0.05 |
| 25–29 | 20.2 | 1.0 | (reference) | 61.6 | 3.1 | 2.1–4.5 | <0.05 | 321.8 | 16.0 | 10.1–25.2 | <0.05 |
| 30–34 | 15.2 | 1.0 | reference) | 49.3 | 3.2 | 2.1–5.0 | <0.05 | 253.0 | 16.6 | 9.9–28.0 | <0.05 |
| 35–39 | 12.0 | 1.0 | (reference) | 35.4 | 3.0 | 1.8–4.8 | <0.05 | 211.9 | 17.7 | 9.8–32.1 | <0.05 |
| 40–44 | 8.5 | 1.0 | (reference) | 30.2 | 3.5 | 2.0–6.3 | <0.05 | 178.2 | 20.9 | 10.2–42.5 | <0.05 |
| 45–49 | 9.7 | 1.0 | (reference) | 23.2 | 2.4 | 1.3–4.2 | <0.05 | 153.1 | 15.7 | 7.7–31.9 | <0.05 |
| 50–54 | 7.5 | 1.0 | (reference) | 19.3 | 2.6 | 1.4–5.0 | <0.05 | 118.7 | 15.9 | 7.2–35.3 | <0.05 |
| 55–59 | 5.4 | 1.0 | (reference) | 12.6 | 2.3 | 1.0–5.1 | <0.05 | 54.2 | 10.0 | 3.3–-30.0 | <0.05 |
| 60–64 | 6.1 | 1.0 | (reference) | 14.2 | 2.3 | 1.1–5.0 | <0.05 | 44.0 | 7.2 | 2.1–24.3 | <0.05 |
| 65–69 | 4.8 | 1.0 | (reference) | 9.0 | 1.9 | 0.7–4.8 | 0.21 | 47.1 | 9.7 | 2.5–38.1 | <0.05 |
| 70–74 | 5.6 | 1.0 | (reference) | 13.9 | 2.5 | 1.0–6.1 | <0.05 | 44.9 | 8.1 | 1.8–36.5 | <0.05 |
| 75–79 | 7.0 | 1.0 | (reference) | 15.6 | 2.2 | 0.9–5.9 | 0.10 | 45.4 | 6.5 | 1.1–39.4 | <0.05 |
| 80–84 | 9.9 | 1.0 | (reference) | 26.5 | 2.7 | 1.0–7.1 | <0.05 | 23.0 | 2.3 | 0.1–51.1 | 0.59 |
| ≥85 | 18.6 | 1.0 | (reference) | 38.2 | 2.1 | 0.9–4.5 | 0.08 | 92.4 | 5.0 | 0.8–30.7 | 0.09 |
CI, confidence interval. IR, incidence rate. RR, rate ratio.
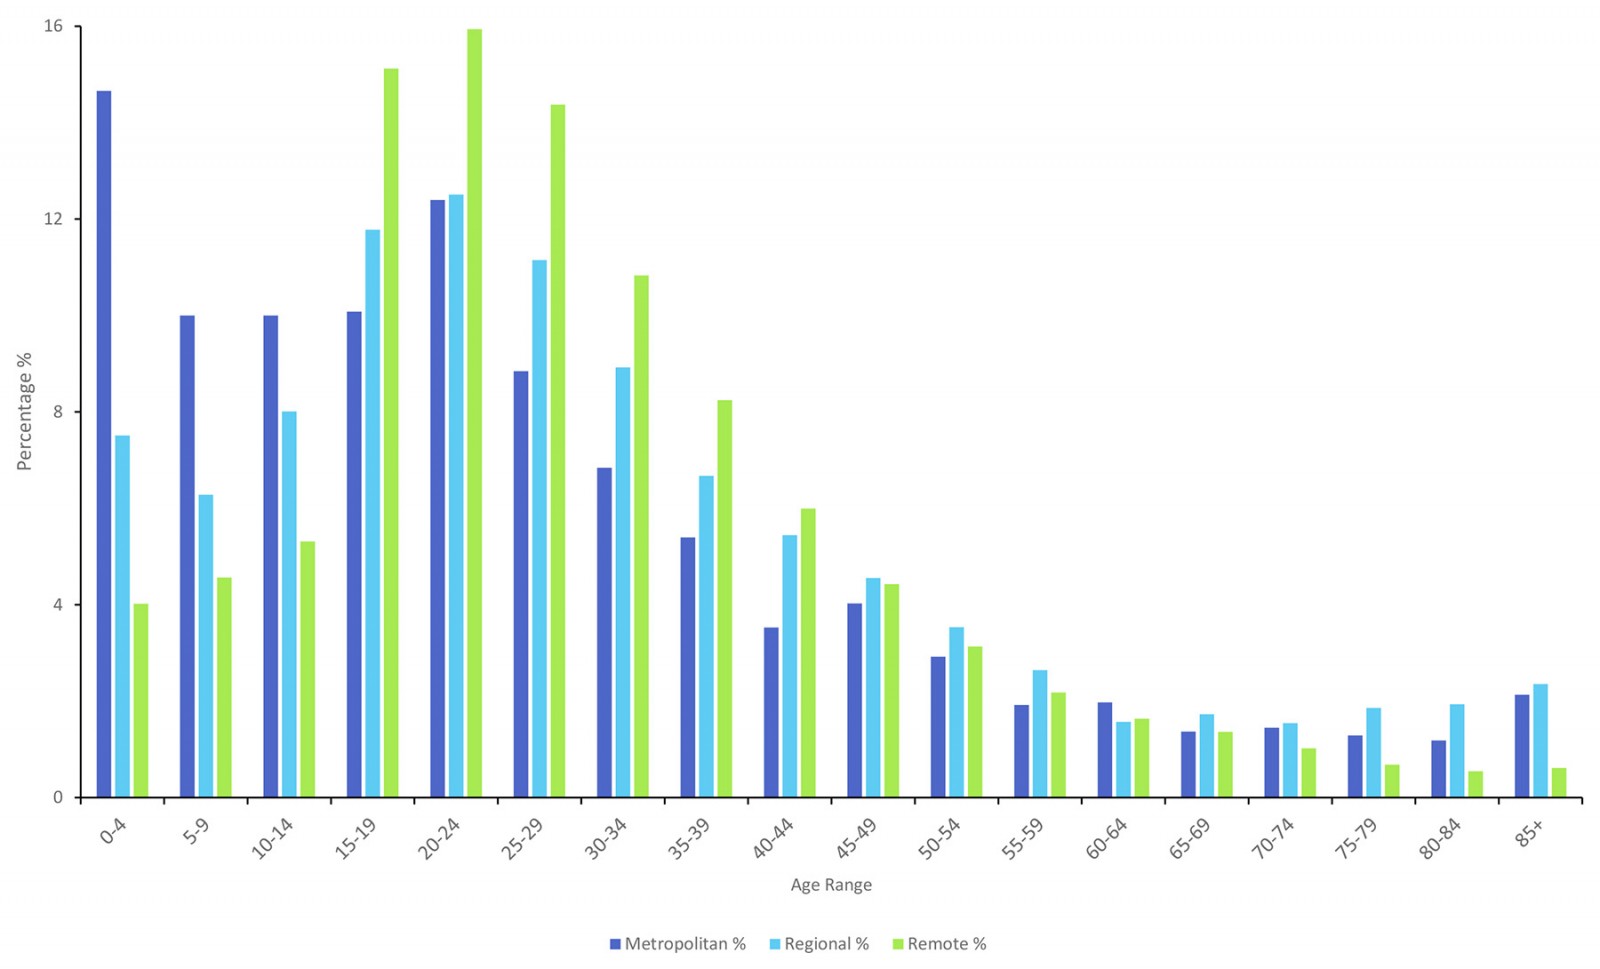 Figure 4: Age distribution of oral and maxillofacial injuries across metropolitan, regional and remote populations (Queensland Injury Surveillance Unit data, 2015–2021).
Distribution of injuries by aetiological mechanism in accordance with National Data Standards for Injury Surveillance codes is illustrated in Figure 534. The code titled ‘struck by or collision with person’ primarily includes injuries due to assault or sport-related incidents. The code titled ‘collision with object’ may include objects wielded by a person (eg cricket bat or golf club) or an object that incidentally made contact with the person (eg falling item). ‘Fall’ includes injuries from jumping, tripping or stumbling from any given height. ‘Transport’ injuries include those from a pedal cycle, or MVAs (involving driver or passenger of car, truck, motorcycle, etc). ‘Animal’ related incidents encompass injuries due to a bite, strike or fall from an animal. For ease in data visualisation, all other mechanisms were categorised into ‘other external cause’. This is mainly composed of unrecorded or unspecified injuries, but also low-incidence injuries (eg burns, electricity, firearms).
The role of human intent in the occurrence of the injury as assessed by the treating practitioner is illustrated in Figure 6. ‘Accident’ is a self-explanatory term suggesting the injury was not intended to occur. ‘Maltreatment and/or sexual assault’ mostly encompasses domestic and family violence, as well as sexual assault from unknown perpetrators. ‘Other or unspecific assault’ is inclusive of all other forms of interpersonal violence. ‘Other intent’ is mainly events of unspecified intent and low-incidence intents (eg legal intervention, intentional self-harm, iatrogenic injury).
The predominant mechanism of injury varied distinctly across geographic areas (Fig5). In the metro group, 'collision with person' (33.3%) and ‘fall’ (31.1%) were the most common injury mechanisms, with lower proportions involving transport-related incidents (10.2%), ‘collision with object’ (9.6%) and animal-related incidents (1.1%). Conversely, the regional and remote groups displayed a notably higher proportion of injuries from 'struck by or collision with person' (47.1% and 54.0%, respectively). Falls ranked second in these areas, constituting 22.4% of regional injuries and 13.1% in remote areas, while animal-related incidents were relatively more frequent in remote areas (2.9%) compared to metro (1.1%) and regional (2.3%).
Table 6: Oral and maxillofacial injury mechanism odds ratios of regional and remote areas compared to metropolitan areas (Queensland Injury Surveillance Unit data, 2015–2021)
| Mechanism of injury | Metro v regional OR (95%CI) | Metro v remote OR (95%CI) | Regional v remote OR (95%CI) |
|---|---|---|---|
| Struck by or collision with person | 0.56 (0.51–0.62) | 0.42 (0.38–0.48) | 0.76 (0.67–0.85) |
| Fall | 1.57 (1.41–1.74) | 3.00 (2.54–3.54) | 1.91 (1.61–2.26) |
| Collision with object | 0.94 (0.81–1.09) | 0.99 (0.81–1.22) | 1.06 (0.86–1.29) |
| Animal-related | 0.48 (0.33–0.69) | 0.37 (0.24–0.57) | 0.77 (0.53–1.12) |
| Transport-related | 1.99 (1.67–2.37) | 2.36 (1.81–3.07) | 1.18 (0.89–1.57) |
| Other external cause | 1.18 (1.03–1.34) | 0.92 0.78–1.09) | 0.79 (0.66–0.93) |
CI, confidence interval. OR, odds ratio.
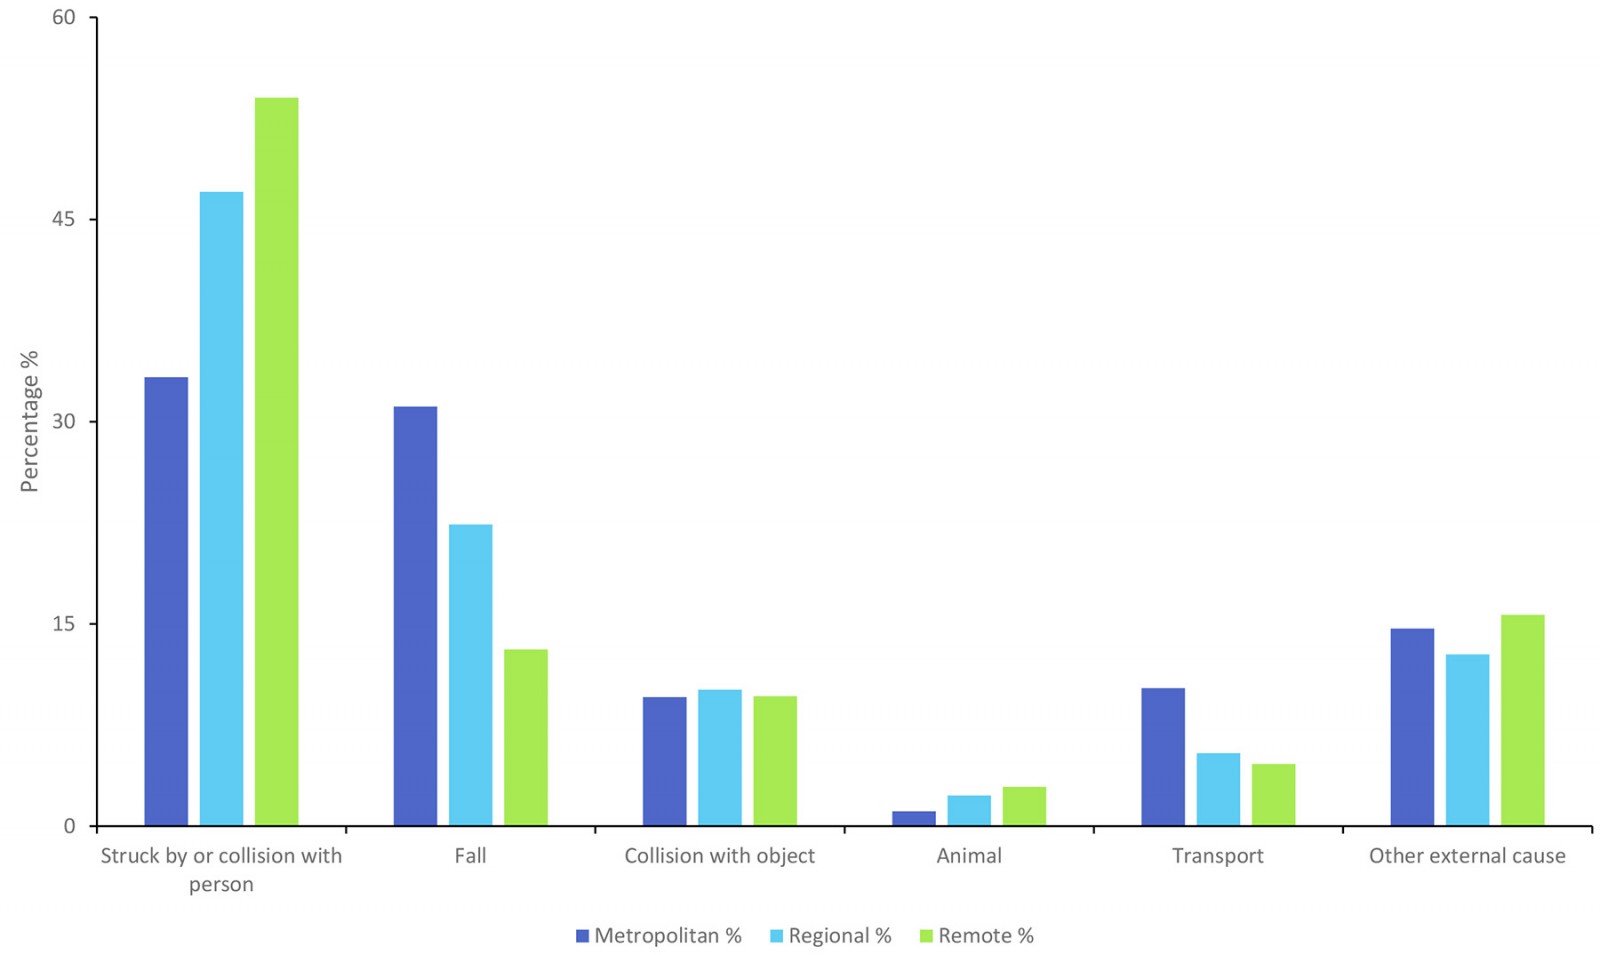 Figure 5: External causes of injuries among metropolitan and rural populations (Queensland Injury Surveillance Unit data, 2015–2021).
A χ2 test for independence was conducted to assess whether the distribution of injury mechanisms differed within rural areas (regional v remote). The results showed a highly significant difference (χ²(5)=66.89, p<0.0001), indicating that the types of injury sustained in regional areas differ substantially from those in remote areas.
An OR analysis was conducted to compare the likelihood of different injury mechanisms occurring in metro, regional and remote areas (Table 6). The results indicate that ‘struck by or collision with a person’ injuries were significantly more frequent in remote areas compared to metro and regional areas. Falls were nearly three times more likely to occur in metro compared to remote areas and nearly twice as likely in regional than in remote areas. Transport-related injuries were significantly more common in metro areas compared to regional and remote areas. Animal-related injuries were significantly more likely to occur in remote areas compared to metro and regional areas. These findings highlight distinct injury patterns across regions, with remote areas experiencing higher rates of interpersonal trauma and animal-related injuries, while falls and transport-related injuries are more prevalent in metro and regional areas.
Regarding intent, accidental injuries dominated all geographic groups, accounting for 74.7% of cases in the metro group, followed by regional (60.6%) and remote (50.8%) populations (Fig6). However, assault-related incidents were relatively more prevalent in remote (45.7%) and regional (35.6%) groups compared to metro areas (19.8%). Maltreatment or sexual assault injuries specifically were most frequent in remote (5.0%), followed by regional (3.3%), with the lowest incidence observed in metro areas (1.0%).
A χ2 test for independence was conducted to assess whether the distribution of injury intent differed significantly across metro, regional and remote areas. The test revealed a highly significant difference (χ²(6)=428.29, p<0.05), indicating that the proportion of accidental, assault-related and maltreatment-related injuries varies substantially depending on geographic location. An OR analysis was conducted to compare the likelihood of different injury intents occurring in metro, regional and remote areas (Table 7).
Table 7: Intent of oral and maxillofacial injury odds ratios of regional and remote areas compared to metropolitan areas (Queensland Injury Surveillance Unit data, 2015–2021)
| Intent | Metro v regional OR (95%CI) | Metro v remote OR (95%CI) | Regional v remote OR (95%CI) |
|---|---|---|---|
| Accident | 1.93 (1.73–2.13) | 2.86 (2.52–3.24) | 1.49 (1.32–1.68) |
| Other or unspecified assault | 0.49 (0.44–0.54) | 0.34 (0.30–0.39) | 0.70 (0.62–0.79) |
| Other intent | 1.48 (1.19–1.84) | 1.58 (1.16–2.16) | 1.07 (0.77–1.48) |
| Maltreatment and/or sexual assault | 0.29 (0.20–0.42) | 0.19 (0.13–0.29) | 0.66 (0.49–0.89) |
CI, confidence interval. OR, odds ratio.
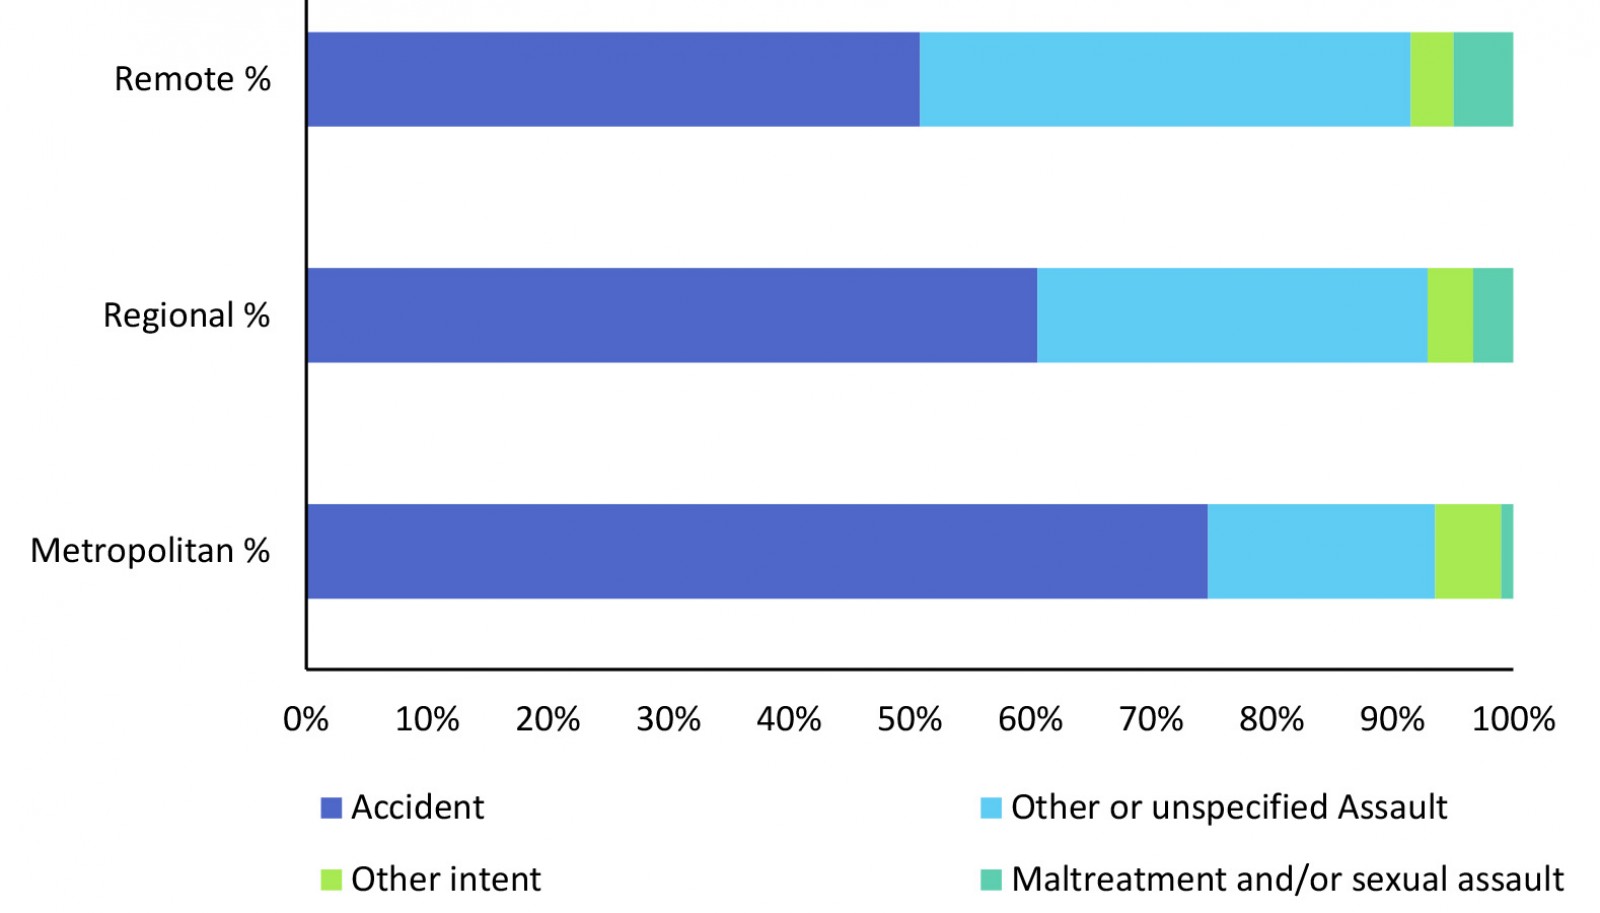 Figure 6: Distribution of oral and maxillofacial injuries in all geographic regions (Queensland Injury Surveillance Unit data, 2015–2021).
Accidental injuries were significantly more common in metro areas compared to remote (OR=2.86, 95%CI: 2.52–3.24) and more common in regional compared to remote (OR=1.49, 95%CI: 1.32–1.68). Assault-related injuries were significantly more common in remote areas than in metro areas (OR=0.34, 95%CI: 0.30–0.39) and regional areas (OR=0.70, 95%CI: 0.62–0.79). Maltreatment and/or sexual assault cases were significantly more frequent in remote areas compared to both metro (OR=0.19, 95%CI: 0.13–0.29) and regional (OR=0.66, 95%CI: 0.49–0.89) areas. These findings suggest that intentional injuries, including interpersonal assaults and maltreatment, occur disproportionately in more remote areas, whereas accidental injuries are more frequent in metro and regional settings.
A majority of injuries were of accidental nature in all population groups (Fig6). However, the regional and remote groups recorded a higher rate of relative assault-related cases compared to the metro group. The cases of assault made up 1362 and 672 injuries in the regional and remote groups compared to 753 cases seen in the metro group. There was an overall 2.9:1 male predilection of total assault-related cases. Males accounted for 82.6% of the assault-related injuries in the metropolitan population. However, this proportion was slightly lower in the regional and remote populations, where 72.5% and 70.5% of cases, respectively, were male. When solely accounting for incidents due to ‘maltreatment by spouse/partner’, the ratio revealed an overall female predilection of 5.7:1. Maltreatment accounted for 5.0% of all assault-related injuries in the metro group, compared to 9.3% in regional areas and 10.9% in remote areas. Odds ratio analysis further demonstrated that maltreatment-related injuries were 1.9 times more likely in regional areas (95%CI: 1.3–2.8) and 2.3 times more likely in remote areas (95%CI: 1.5–3.4) compared to metro areas.
The OMF injury rates per 100,000 as per the 2021 Australian census are illustrated in Figure 737. This graph demonstrates injury rates with respect to gender and age, and is intended to identify specific at-risk groups. To maintain clarity and interpretability in visual representation, age and gender distribution data has been presented using a dichotomous categorisation of metropolitan and ‘rural’ populations. The ‘rural’ group represents the combination of the regional and remote populations. Injury rates for rural males, metropolitan males and rural females showed large peaks between ages 15 and 24 years. Both male groups, more so the rural male population, had an especially steep increase during this age range.
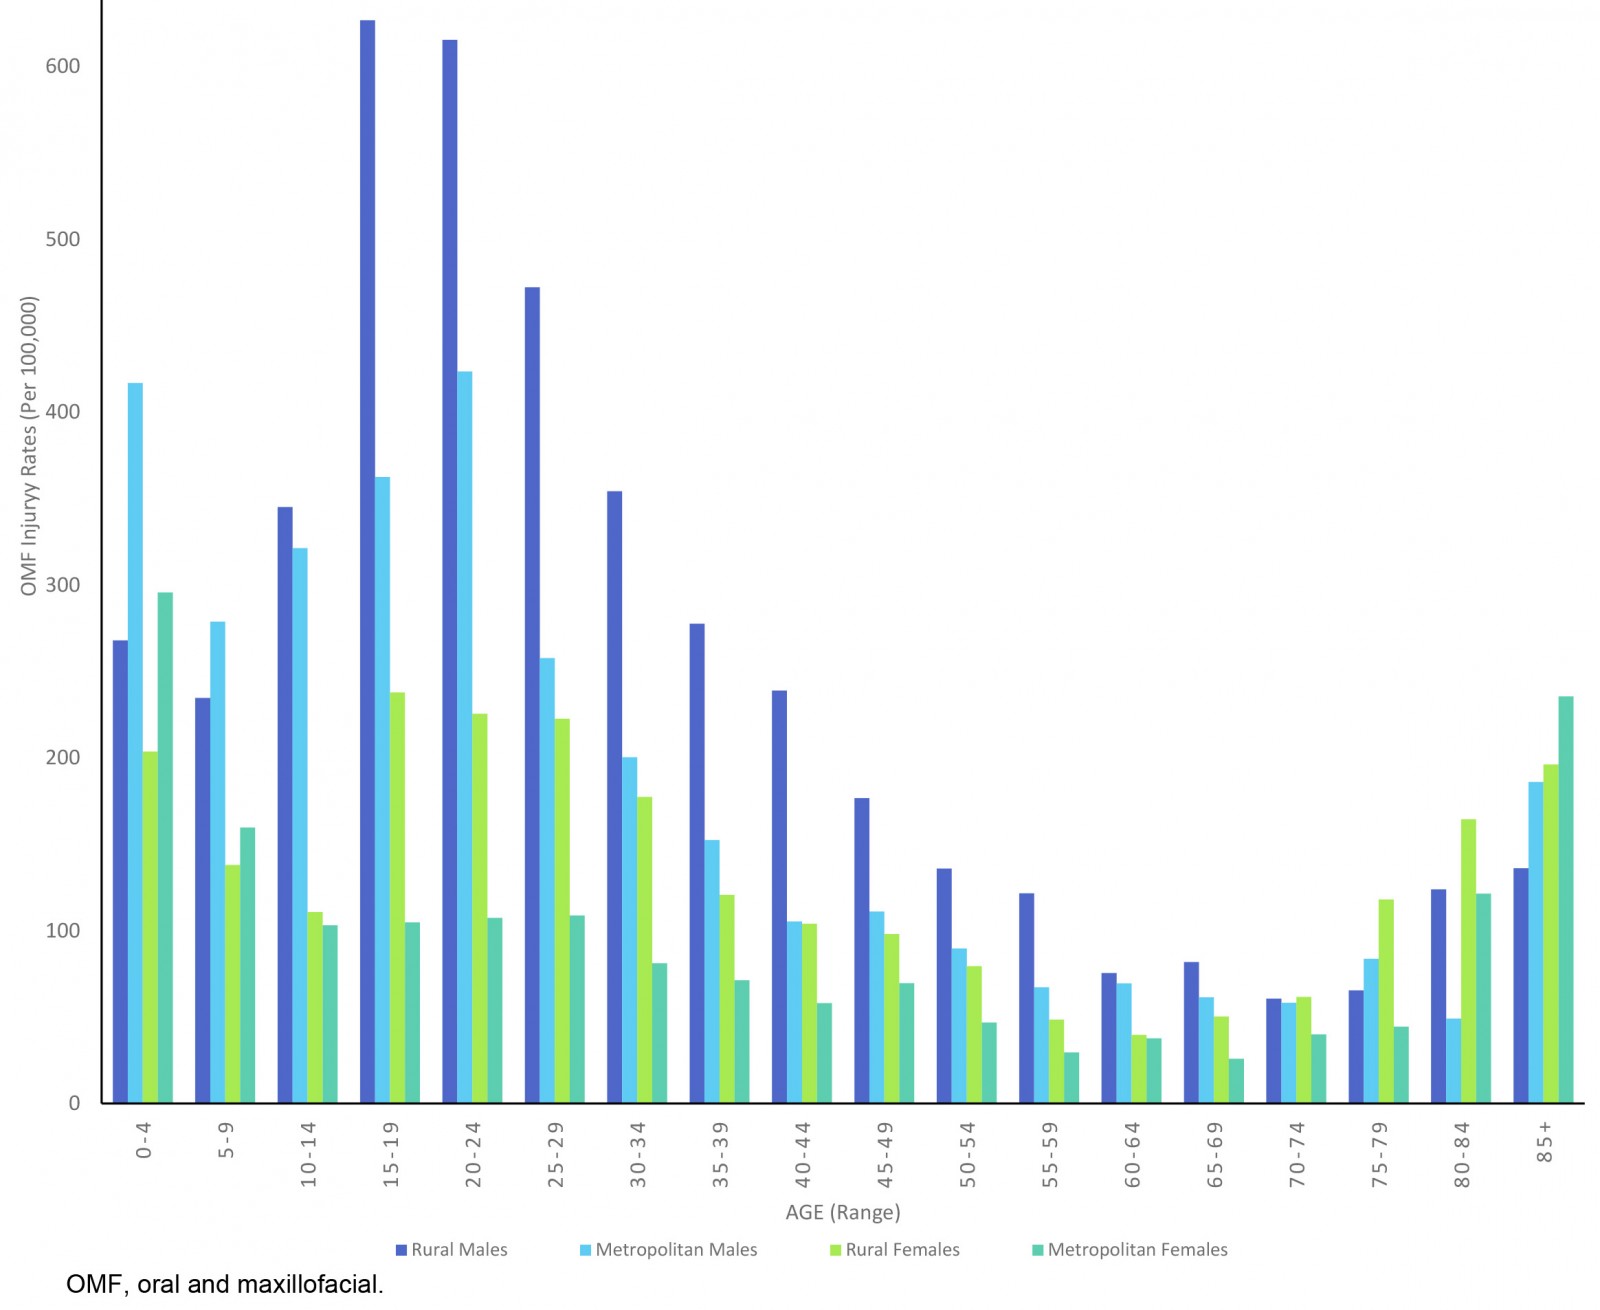 Figure 7: Age and gender distribution for oral and maxillofacial injury rates per 100,000 across metropolitan and rural populations (Queensland Injury Surveillance Unit data, 2015–2021).
Discussion
This retrospective study was conducted to analyse the trends of OMF injuries within the urban, regional and rural population over a 7-year period (2015–2021) in Queensland, Australia. This study demonstrated that OMF injuries are not evenly distributed across Queensland but instead increase markedly with rurality, both in absolute number and in population-adjusted rates.
Also identified were significant temporal trends in the incidence of OMF injuries. Linear regression analysis revealed that injury rates have been rising steadily across all three geographic regions over the study period (Table 3). While both metropolitan and remote areas showed modest but statistically significant increases in annual injury cases (22.9 and 24.4 cases per year, respectively), the rate of increase was substantially higher in regional areas, with an average annual rise of 74.4 cases per year (p=0.007). The most consistent trend was also observed in remote areas, suggesting an accelerating increase in injuries over time. These findings highlight the urgent need for proactive intervention and resource planning, especially in regional and remote areas – where both the rate and reliability of increase are concerning. The rising trajectory may reflect worsening risk exposures, inadequate mitigation strategies or delayed policy response in these regions.
When accounting for respective populations, the rate of injury per 100,000 rose progressively across the ASGS-RA classification from the most urban to the most remote areas. Compared to major cities, this translated to a 1.8–2.2 times higher risk in regional areas and 8.7–11.7 times higher risk in remote areas (p<0.05). This alarming trend may be attributed to a variety of factors unique to regional and remote areas.
Increasing rurality also coincides with high-risk occupations and socioeconomic disadvantage, which also increases vulnerability to trauma14. Kruger et al’s study on geographic modelling of jaw fractures had similar findings, showing fracture rates skewed towards people located in rural areas and the First Nations population, with considerable overlap between both variables32.
Beyond raw occurrence rates, this study also revealed that mechanism of injury varied significantly by geographic location. The ‘struck by or collision with person’ mechanism (typically representing interpersonal violence) dominated across all regions (Fig5); however, the odds of occurrence were significantly higher in regional areas (1.8 times) and remote areas (2.4 times) compared to metropolitan (p<0.05) (Table 6)32. Taylor et al14 extrapolate that rural areas have a younger population, higher First Nations demographic, are predominantly male and inclined to engage in risk-taking behaviours14. This was also demonstrated by our data, which showed that adults aged 20–24 years in remote areas were 18 times more likely to suffer an OMF injury compared to their metro counterparts (Table 5). Figure 7 demonstrates that rural males aged 15–19 years had the highest overall OMF injury rate (627 per 100,000) in 2021. They were followed closely by rural males aged 20–24 years (615 injuries per 100,000).
It has been well reported that OMF injuries, and trauma in general, occur primarily among males14,32. When adjusted for population, our data showed the annualised incidence rate was 22.9 (per 100,000) for metropolitan males, increasing to 43 in regional and 232.8 in remote males. Chi-squared analysis confirmed these variances to be significantly different (p<0.001). Interestingly, there were similar ratios of occurrences in the metropolitan (2.3:1 to males), regional (2:1), and remote cohorts (2.3:1) (p<0.001). These findings align with multiple studies that report a similar gender disparity in OMF trauma17-31. This pronounced male predominance in all geographic regions can be attributed to several factors. Males, especially in rural regions, are more likely to be involved in high-risk occupations and activities, which increases their exposure to injury14,15. Social and cultural norms that encourage risk-taking behaviours in young males, particularly during adolescence, also play a significant role. In rural areas, these norms may be further reinforced by social isolation and limited recreational activities, leading young males to engage in more hazardous behaviours. In our study, the injury rates were noted to be higher among males. The steep increase specifically among regional and remote males aged 15–24 years may be explained by the related increase in risk-taking behaviours seen in adolescents around this time14,15.
The influence of alcohol has been widely reported to instigate and exacerbate risk-taking behaviours19,20,38,39. With a minimum legal drinking age of 18 years in Australia, the effects of pre-existing risk-taking behaviours in adolescents may be heightened by a discernible increase in alcohol consumption in this age group39,40. In this regard, the high injury rates among the rural population may also be compounded with the high alcohol consumption rates in rural Australia14,19,20. Moreover, rural males have been reported to be at risk of risk-taking behaviours due to the influence of factors such as an unstable economy, occupational hazards, social isolation and unemployment40. Comparatively with the rest of the population, those who reside in rural areas experience a similar prevalence of mental illness41. However, it has been suggested that these comparable rates are masked by a high volume of untreated or undiagnosed mental health disorders41. The effects of risk-taking behaviours may be exacerbated in the rural population due to poor service integration, limited workforce and restricted funding, and limited utilisation of funding or services41. These findings have important implications for public health strategies. Interventions aimed at reducing OMF injuries in rural areas should particularly target young males, focusing on risk education and injury prevention. Programs that address the cultural factors driving risk-taking behaviours, as well as those that provide alternative recreational activities and mental health support, could be effective in reducing injury rates in this demographic. Additionally, addressing the higher rates of alcohol and substance use through targeted public health campaigns could mitigate one of the significant contributing factors to these injuries.
Environmental and occupational factors likely play a significant role in the elevated injury rates observed in rural areas. Rural populations are disproportionately engaged in high-risk occupations such as agriculture, mining, forestry and rural aviation, all of which are known contributors to trauma14. This is reflected in our findings, where animal-related injuries, for example, were significantly overrepresented in remote areas, occurring 1.3 times more frequently than in regional areas and 2.7 times more frequently than in metropolitan areas. Most of these cases were linked to livestock exposure, with horses accounting for 40% and cattle for 23% of incidents, highlighting the occupational hazards faced by rural communities. While transport-related injuries were more frequently reported in the metropolitan group overall, this was largely driven by pedal cycle incidents, which accounted for 52% of transport injuries in this group. MVAs, by contrast, constituted 37% of the group, with the remainder unspecified. In comparison, within the combined regional and remote groups, 58% of transport-related injuries were attributed to MVAs, while 37% were due to pedal cycles. This distribution suggests that road trauma risk profiles differ markedly by geography, with rural residents more likely to sustain serious injuries from MVAs, possibly due to longer travel distances, higher speeds and inferior road infrastructure. These findings emphasise the critical need for targeted public health strategies that address the unique risks faced by rural populations. Policies should focus on improving emergency healthcare access in remote regions, possibly through mobile health units or telemedicine services. Additionally, increasing awareness and prevention strategies in high-risk occupations could reduce the incidence of injuries.
In our study, injury rates were observed to affect adults and older age groups across all geographical populations. Overall, the occurrence rate of falls was inversely proportional to rurality. The odds of OMF injury due to falls in metro areas were 1.6 times and 3 times more than regional and remote areas respectively. For people aged 65 years and over, falls accounted for 75–85% in all cohorts. Older people are known to be at high risk of falls and fractures41. This is linked to the association between age and osteoporosis, a skeletal condition characterised by reduced bone mineral density and increased likelihood of insufficiency fractures42. Additionally, women are at even higher risk of osteoporosis due to the influence of menopause on increased osteoclastic function42. These results are similar to another study that noted high OMF injury rates (85%) were due to falls within the elderly population, with a male-to-female ratio of 0.5:118. The high incidence of falls among the elderly in all regions underscores the critical need for targeted fall prevention programs. These should include strategies to improve home safety, community exercise programs to enhance balance and strength, and widespread screening for osteoporosis. Given the higher risk among women due to menopause-related bone density loss, these interventions should particularly focus on elderly women to reduce the risk of fractures and related complications.
Although the predominant intent of injury was accidental in all geographical populations, the regional and remote groups were observed to have a higher prevalence and proportion of assault-related cases. Within recent literature, interpersonal violence appears to be a fluctuating mechanism of OMF injury, with authors reporting rates ranging from 30% to 59%17-31. These numbers are likely influenced by many social and geographical factors, as previously explored17-31. The present study showed the proportion of all assault-related injuries was markedly different across areas: 19.8% in metropolitan areas to 35.6% in regional areas and 45.6% in remote areas. This difference was statistically significant, as confirmed by a χ2 test (p<0.001), and suggests that the intent of injury is not evenly distributed across locations. The odds of experiencing an assault-related injury were consistently higher in remote areas, particularly for unspecified assaults, where the odds were lower in metro areas (OR=0.34, 95%CI: 0.30–0.39) and regional areas (OR=0.70, 95%CI: 0.62–0.79) when compared to remote regions. Similarly, maltreatment and/or sexual assault cases were significantly more frequent in remote areas compared to both metropolitan (OR=0.19, 95%CI: 0.13–0.29) and regional settings (OR=0.66, 95%CI: 0.49–0.89), indicating a concerning burden of interpersonal violence in geographically isolated communities.
Males in all geographic areas were more frequently injured due to assault, in comparison to females. However, increasing rurality demonstrated the male-to-female injury ratio to progressively decrease (4.7:1 in metro, 2.6:1 in regional and 2.4:1 in remote areas), explainable by the increasing rate of females being injured in proportion to increasing rurality. The rural female population was especially susceptible to maltreatment, and sexual and other forms of assault, than their metropolitan counterparts. Out of all maltreatment cases, OMF injuries occurred remarkably more often in females in metro (11:1), regional (4:1) and remote areas (11:1).
Maltreatment and/or sexual assault as an intent accounted for 2.6% of all OMF injuries in all regions. This is in agreement with studies by Wang et al42 and Nhongo et al43, which reported an approximate 2% rate of OMF injury due to domestic violence. Notably in this study, the injury rates are significantly higher when taking rurality into account. Maltreatment and/or sexual assault made up 3.3% and 5% of incidents in regional and remote areas compared to the 1% in metro regions41,42. This aligns with Australian Institute of Health and Welfare findings that report higher rates of domestic and family violence in regional areas (23%) compared to metropolitan areas (15%)44. When considering cases due to maltreatment or sexual assault, it is important to account for non-reporting bias. Non-reporting in this context refers to the phenomena where incidents of assault are not reported to authorities or support services, leading to an underrepresentation of the true severity of the problem45. This bias may be a result of various factors including fear, stigma, dependency, lack of awareness/support services, and cultural beliefs45. The Australian Institute of Health and Welfare highlights the differences in social values and norms in rural communities that negatively impact experiences of domestic and family violence46. George et al also outlines the poor understanding of domestic and family violence by health, social and legal services in regional and remote communities47. Overall, the maltreatment and sexual assault rates observed among rural females may be influenced by a combination of factors, including social isolation, cultural norms that discourage reporting, and limited access to support services48. Additionally, the stigma associated with reporting such incidents may be stronger in rural areas, where close-knit communities might inhibit victims from seeking help. Strategies should include improving access to support services for victims of domestic and family violence, enhancing community awareness programs and providing more robust training for local healthcare providers to recognise and respond to signs of abuse. Additionally, addressing the underlying social and cultural barriers that prevent reporting is crucial for reducing the prevalence of these assaults49.
This study has a few limitations worth noting. The data used in this study allowed for a broad outlook and analysis of OMF injuries in Queensland alone. The compromise for conducting a study on such a macroscopic scale is that the validity of the data relies heavily on the accuracy and breath of data collected. Several layers of reporting and recording procedures preceding the data presented in this study had potential for inconsistencies while clinicians documented the triage notes. The data held by the QISU also has some inherent limitations. Not all hospitals in Queensland reported their data and there is annual variability in the number of hospitals reporting to QISU33. This may overestimate or underestimate the reported injury numbers from a geographic location. Higher number of cases reported in urban hospitals or significant changes in trends may, in part, be attributable to variation in reporting across the geographic locations over the study period. It is estimated that the QISU data represents approximately one-fifth of all adult injury presentations to emergency departments in Queensland50. Additionally, QISU does not collect data of persons who died at the scene of injury or after admission to the hospital33. This may have potentially led to underreporting of certain mechanisms of injury such as MVAs, which often result in more severe trauma, and fatalities.
Conclusion
The findings of this study are particularly significant as they provide a detailed analysis of OMF injury patterns across Queensland, highlighting the disparities between metropolitan and rural areas. This study also demonstrated the factors that influence the rate of OMF injuries with rurality as a significant factor on both environmental and socioeconomic scales. Service provision should aim to be upstream, focused on improving mental health outcomes of the rural population and reduce risk-taking behaviours. Future studies should focus on investigating additional factors such as ethnicity, Indigenous status and socioeconomic status involving data from wider regions to further delineate the impact of rurality on OMF injuries.
Funding
SP received the Colin Cormie Scholarship from the Australian Dental Research Foundation.
Conflicts of interest
The authors have no conflict of interest to disclose.
Data availability
No new data was generated in this study. All the data analysed in this study can be obtained from Queensland Injury Surveillance Unit upon request.