

Introduction
In Australia, the agriculture, forestry and fishing industry consistently exhibits the highest mortality rate among all industries, with 14.7 deaths per 100,000 workers in 20221. Farmers, who constitute the majority of this industry2, have experienced an average of 79 fatalities per year from 2001 to 20203. Six primary agents – tractors, quad bikes, farm utilities, water bodies, motorcycles and horses – account for 58% of these fatalities. Notably, an estimated 36% of these cases could potentially have been prevented through established risk control strategies4.
Farmers must be cognisant of occupational hazards and protective measures, with the internet serving as a key resource for disseminating safety information to agricultural workers5-8. Given that online publications are not subject to formal regulation, it is essential to critically evaluate safety websites, akin to the evaluation of healthcare websites9,10. While numerous studies have assessed healthcare websites11-15, few have focused on safety websites16,17. Studies that evaluate websites do so to infer the overall quality of presented information. Information quality can be defined as ‘fitness for use’, with attributes of information quality including accuracy, completeness, reliability and interpretability18. Studies evaluating informational websites will primarily assess three variables: ‘quality’, content and readability. Although some work has been done on mobile applications19, to our knowledge no studies have examined websites related to occupational or agricultural safety.
The term ‘quality’ is used as an indicator of true information quality. Healthcare information ‘quality’ is assessed through validated assessment tools such as DISCERN20 and QUEST21, frameworks such as the JAMA benchmarks22, and the widely accepted HONcode certification23 – although it is worth noting that the HONcode was decommissioned in 2022. These tests elicit the reliability of provided information and are specific to assessing healthcare information. The exception is the JAMA benchmarks, which do not include health-specific criteria. The JAMA benchmarks are not a validated tool, but rather a framework that evaluates the presence of four benchmarks: authorship, attribution, disclosure and currency. Many papers refer to the JAMA benchmarks as measuring ‘quality’14,15,24-28, while others are moving towards the term ‘accountability’12,29-31. JAMA benchmarks may be a suitable tool for assessing the accountability or reliability of safety information, in addition to healthcare information.
Assessing website content involves measuring the ‘accuracy’ and ‘completeness’ of information when compared to a standard, such as healthcare guidelines. Content is typically assessed through a quantitative checklist11-13,29,32. Currently, there is no general tool available to assess website content, and as such researchers often create their own checklists specific to their subject matter. This approach leads to inconsistencies and makes it difficult to compare findings across studies due to a lack of uniform criteria.
Agricultural safety is a form of occupational safety. As such, safety standards are guided by the widely accepted Hierarchy of Risk Controls33,34. In Australia, workplaces are legislated to comply with the Hierarchy of Risk Controls (Fig 1) as outlined in the Safe Work Australia Model Code of Practice: How to manage work health and safety risks35. The hazard controls, in order of presumed effectiveness, include elimination (level 1); substitution, isolation and engineering controls (level 2); administrative controls (level 3); and personal protective equipment (level 4). The hierarchy’s premise is that a duty holder must aim for the highest level of control: elimination. If not reasonably practicable, they must minimise the risk by progressing through the other levels of the hierarchy. An ‘accurate’ occupational safety website will provide hazard control recommendations at all levels of the hierarchy, enabling a duty holder to navigate the Hierarchy of Risk Controls effectively. In addition, a ‘complete’ occupational safety website should discuss an array of relevant hazards, including both common and severe hazards.
Readability refers to the ease with which text can be read and understood36. Three widely used readability scores include Simple Measure of Gobbledygook (SMOG)37, Flesch Reading Ease Score (FRES)38 and Flesch–Kincaid Grade Level (FKGL)39. SMOG is the most widely used readability tool for healthcare information40, calculating readability based on the number of polysyllabic words (words with three or more syllables) in the text. SMOG has been estimated to test for 100% comprehension41 and is therefore regarded as the gold standard for healthcare information analysis42,43. FRES and FKGL are also widely used in health care and other areas44. Both scores assess readability using sentence length and word length, although they weigh each factor differently.
Readability is critical for ensuring interpretability of the provided information. In 2013, 13.7% of Australians had reading skills below year 7 (equivalent to grade 7 in the US)45. As such, the Australian Government recommends that information be at a reading level equivalent to Year 745, ensuring accessibility to most of the general population.
The internet is an essential educational resource across various domains, including health care and occupational safety. While numerous studies have assessed the quality of health information online11-15,29, there is a notable lack of research on safety information, as evidenced by the limited number of studies on this topic16,17. This study aimed to assess the content, accountability and readability of websites focused on agricultural safety. A secondary aim was to examine differences in the quality of website categories in terms of accuracy and completeness.
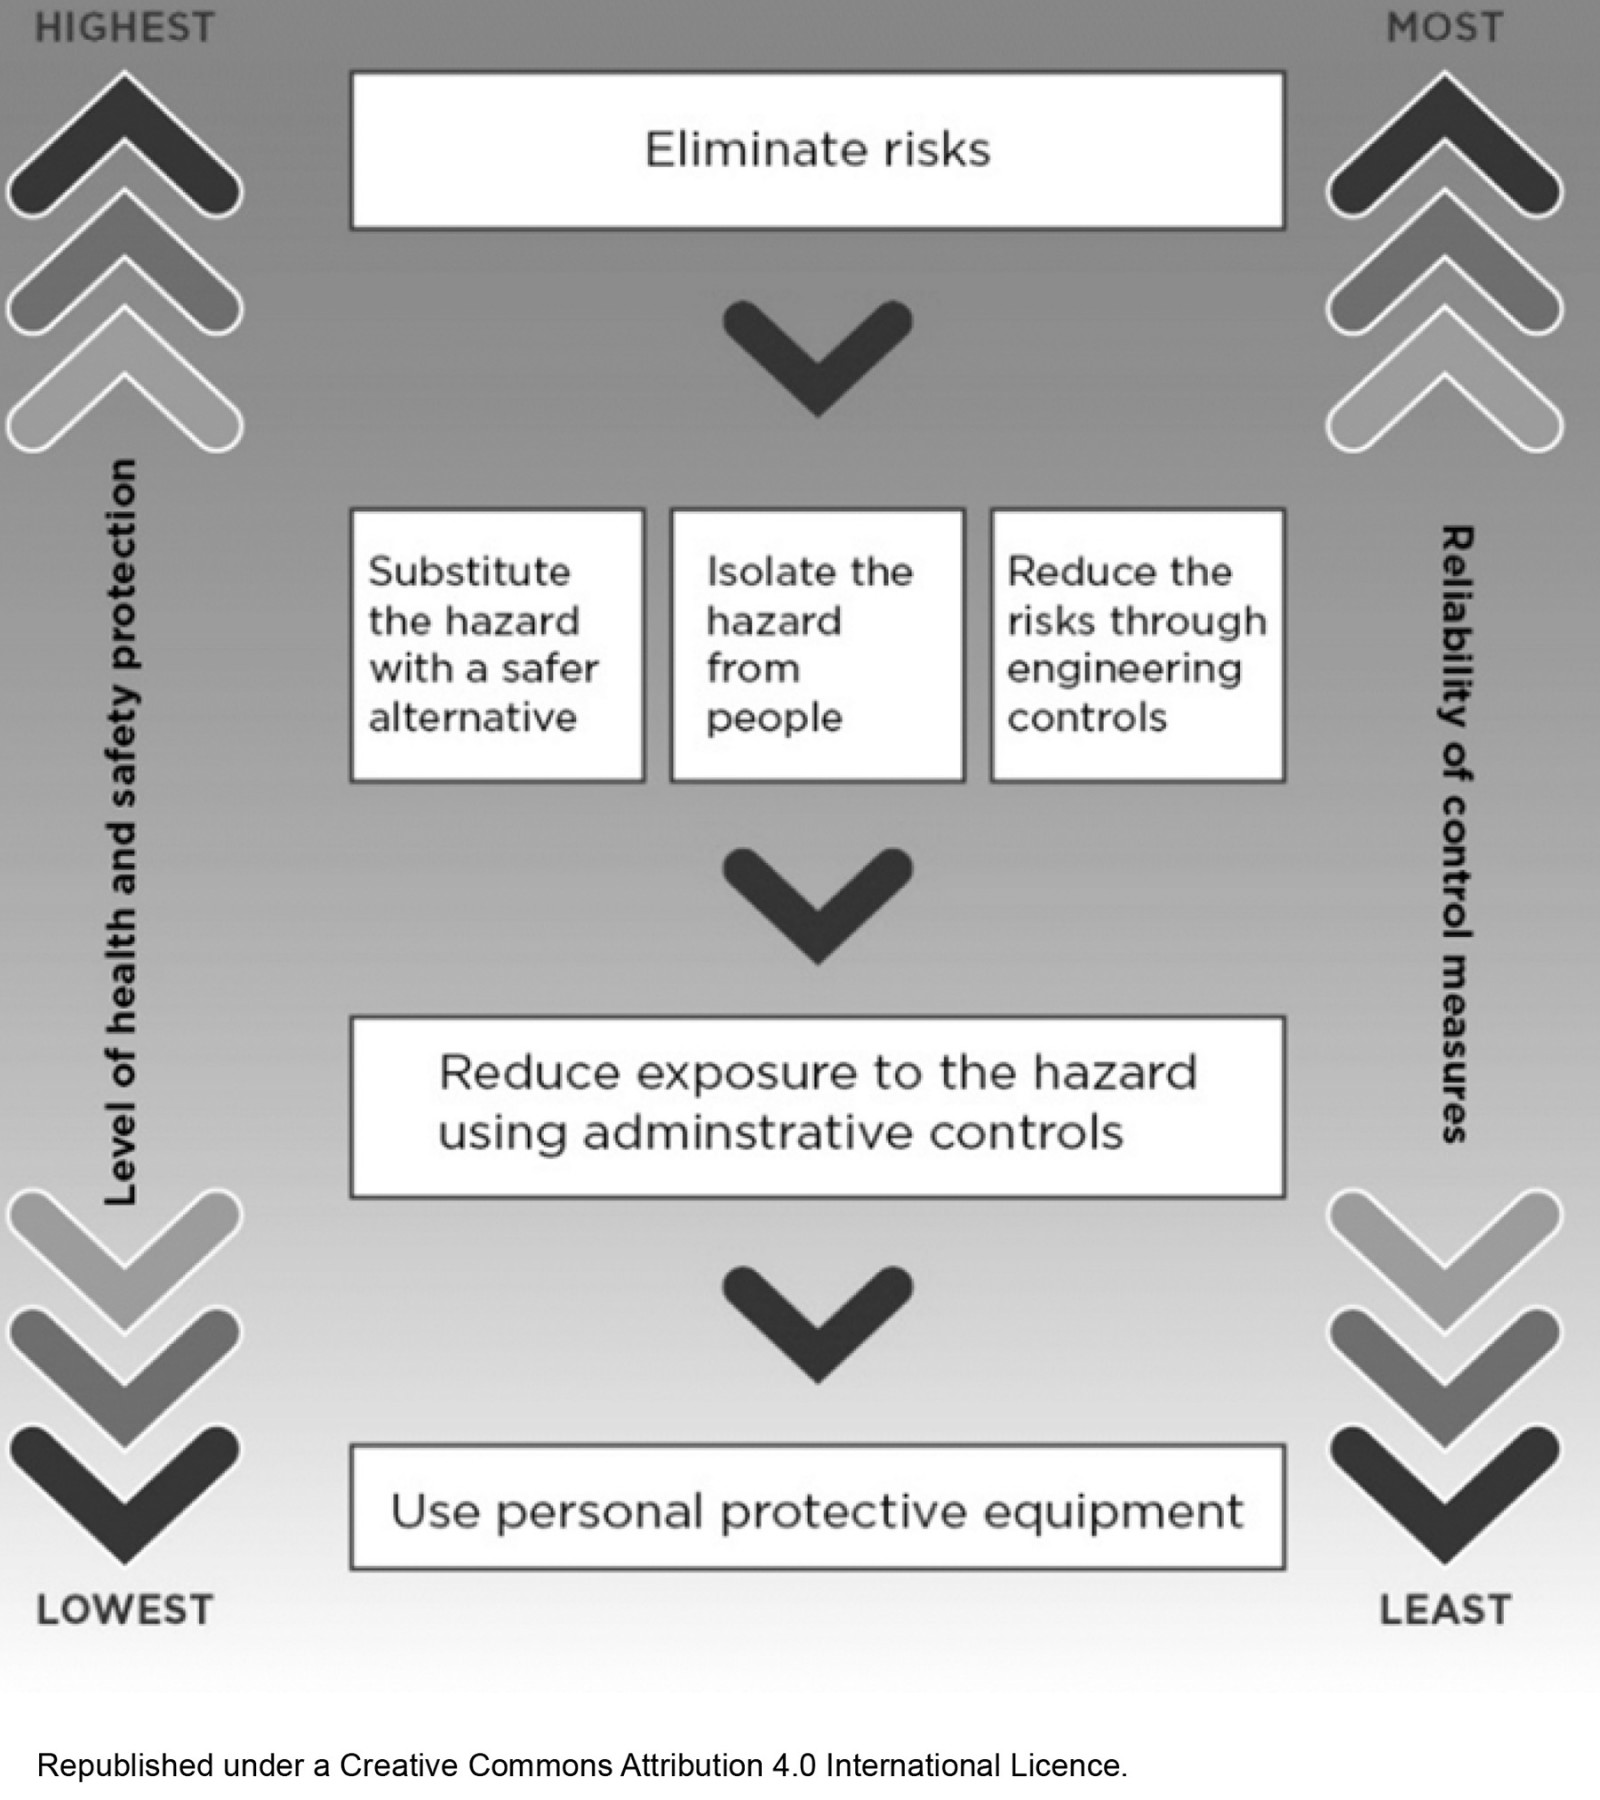 Figure 1: Hierarchy of Risk Controls from Safe Work Australia’s Model Code of Practice: How to manage work health and safety risks35.
Methods
Website selection
Google was utilised as the search engine, with only English language URLs being assessed. To ensure depersonalised results, searches were conducted in incognito mode with ‘personalised results’ settings disabled, and the cache and cookies cleared before each search. Three search terms were used: ‘agri* safety’, ‘farm* safety’ and ‘farm* injury prevention’. The asterisk serves as a placeholder at the end of the word, hence farm* covers the terms ‘farm’, ‘farms’, ‘farmer’ and ‘farming’. The URLs of the top 10 search engine result pages (SERPs) were copied into a Microsoft Excel spreadsheet. The following SERPs were excluded: duplicate websites, government reports, journal articles with no information about farming injury prevention, videos and social media.
Content
Two independent reviewers (AD and YG), visited and evaluated the presence of information regarding farming hazards and hazard control measures in the included SERPs. Reviewers navigated websites through links and search bars. Reviewers assessed all information including text, images and attached files. All evaluated information was attributable to the respective website.
The presence of information on nine farming hazards was assessed. Six hazards (tractors, quad bikes, other farming vehicles, water bodies, motorcycles and horses) were included due to their high mortality rates in Australia from 2001 to 20164. The other three hazards (manual tasks, falls and livestock handling) were included due to their prevalence as serious claims for workers' compensation in Australia from 2000 to 202346.
The presence of hazard control measures for each hazard was assessed. A tabulated checklist was created, with columns for the control measures (elimination, substitution, isolation, engineering controls, administrative controls and personal protective equipment) and rows for the hazards (tractors, quad bikes, other farming vehicles, water bodies, motorcycles, horses, manual tasks, falls and livestock handling). The checklist template is displayed in Appendix I. Control measures and their definitions were based on the Hierarchy of Risk Controls from Safe Work Australia’s Model Code of Practice35. Data from each reviewer was recorded to assess inter-rater reliability (kappa)47. Differences were then resolved by consensus between the two reviewers.
Completeness and accuracy
Each website was scored out of nine based on the total number of hazards addressed. This score represents the ‘completeness’ of the website content. Each hazard was scored out of four based on the number of recommended control levels. Hazard control levels were categorised as follows: level 1 – elimination; level 2 – substitution, isolation or engineering controls; level 3 – administrative controls; level 4 – personal protective equipment. The total score for each website was calculated by taking an average of all hazards addressed. This score represents the ‘accuracy’ of the website content.
Accountability
Due to the lack of instruments to assess occupational safety, JAMA benchmarks were used as a proxy for accountability22. This instrument evaluates the presence of four key components: attribution, authorship, currency and disclosure. Two independent reviewers (AD and YG) assessed each website and scores from each reviewer were recorded to assess inter-rater reliability, with discrepancies resolved by consensus between the two reviewers.
Readability
Websites were navigated to reach webpages containing information on tractors. If not available, a webpage containing information on any hazard was used. A minimum of 600 words was assessed. When necessary, text from multiple webpages was combined to achieve a minimum of 600 words. The text relevant to injury prevention was manually copied into Microsoft Word and cleaned of formatting. Readability was assessed with a commercial web-based suite of tools48, as used by Gagne et al49. Scores for FKGL, FRES and SMOG were recorded. FRES scores can be translated into grade scores using a scoring system from Flesch’s book How to write plain English50.
Categorisation
Websites were assessed using categories provided by Maki et al51. These categories include ‘government’, ‘commercial’, ‘journalistic’, ‘professional’, ‘health portal’, ‘non-profit organisation’ (NPO) and ‘other’.
Statistical analysis
Inter-rater reliability for the content analysis and JAMA benchmarks was examined using Cohen’s kappa coefficient47, with a 95% confidence interval (95%CI). Descriptive statistics were used to determine means with standard deviation for accuracy, completeness, JAMA benchmarks and readability scores. Independent t-tests were conducted to analyse differences between website categories. Statistical analyses were conducted using Microsoft Excel and Statistical Package for the Social Sciences v25 (IBM Corp; https://www.ibm.com/products/spss-statistics). P-values less than 0.05 were considered statistically significant.
Ethics approval
This study was exempt from ethics approval because it involved analysis of publicly available website content and did not include any human participants or identifiable personal data.
Results
The search strategy resulted in the identification of 30 potentially eligible SERPs. After applying the exclusion criteria and removing duplicates, 13 websites were included in the analysis (Fig2). Details of these websites, including name, URL, category and country of origin, are shown in Table 1. Of the 13 websites, 10 originate in Australia and three originate in the US. The website categories included government (6), NPO (4) and professional (3).
The completeness and accuracy scores are displayed in Table 1 and Table 2. Completeness ranged from 2 to 9, with a mean (M) of 6.1 (standard deviation (SD)=2.4). Government websites (M=7.3, SD=1.75) had statistically significant higher completeness scores than professional websites (M=3.0, SD=1.00, t=3.89, degrees of freedom (df)=7, p=0.006). NPO websites (M=6.5, SD=2.08) also had statistically significant higher completeness scores than professional websites (t=2.65, df=5, p=0.046). There was no statistically significant difference when comparing government websites to NPO websites (t=0.69, df=8, p=0.512).
Accuracy ranged from 0.3 to 3.8, with a mean of 2.4 (SD=1.0). Government websites (M=3.1, SD=0.5) had significantly higher accuracy scores than NPO websites (M=1.7, SD=1.2, t=2.675, df=8, p=0.028) and professional websites (M=2.0, SD=0.6, t=2.711, df=7, p=0.03). There was no statistically significant difference when comparing NPO websites to professional websites (t=–0.47, df=5, p=0.659).
The JAMA benchmark scores for each website are presented in Table 1, with a breakdown of the JAMA benchmark scores in Table 3. The intraclass correlation between the reviewers was 0.804 (95%CI 0.643–0.965), indicating substantial inter-rater reliability47. The mean JAMA benchmark score for all websites (n=13) was 2.5 (SD=0.78). The mean JAMA benchmark scores for each website category are shown in Table 3. There was no statistically significant difference in the mean JAMA benchmarks across categories. Results of the statistical analysis are shown in Appendix II.
Readability scores for each website are displayed in Table 1. SMOG scores ranged from 10.5 to 14.9, with a mean of 11.8 (SD=1.5). FKGL scores ranged from 7.6 to 13.1, with a mean of 9.2 (SD=1.7). FRES scores ranged from 25.8 to 63.1, with a mean of 53.6 (SD=10.6), a score that is equivalent to grade 10–12 readability50. The mean readability scores for each website category are shown in Table 2. There was no statistically significant difference in mean readability scores across categories. Results of the statistical analysis are displayed in Appendix II.
The results of the content evaluation are shown in Table 4 and Table 5. For assessment of hazards being addressed on websites, intraclass correlation between reviewers was 0.644 (95%CI 0.503–0.785), indicating moderate inter-rater reliability47. For assessment of the presence of hazard control measures on websites, intraclass correlation between reviewers was 0.503 (95%CI 0.434–0.572), indicating moderate inter-rater reliability47. Tractors were the most commonly addressed hazard (n=13, 100%), followed by quad bikes (n=11, 85%). Motorcycles were the least addressed hazard (n=3, 23%). Regarding accuracy of content related to each hazard, falls had the greatest accuracy score (3.3/4) followed by manual tasks (2.9/4).
Table 1: Websites and scores for content, accountability and readability
| Website | URL | Country | Category | Content | Accountability | Readability | |||
|---|---|---|---|---|---|---|---|---|---|
| Completeness (/9) | Accuracy (/4)† | JAMA (/4) | SMOG (grade)† | FKGL (grade)† | FRES (0–100)† | ||||
| Safe Work Australia | https://www.safeworkaustralia.gov.au/safety-topic/industry-and-business/agriculture | Australia | Government | 8 | 2.9 | 2 | 10.6 | 8.4 | 49.8 |
| WorkSafe Queensland | https://www.worksafe.qld.gov.au/safety-and-prevention/hazards/workplace-hazards/agriculture | Australia | Government | 7 | 3.3 | 2 | 11.5 | 8.4 | 59.9 |
| Commerce WA | https://www.commerce.wa.gov.au/worksafe/agricultural-health-and-safety (link no longer active) | Australia | Government | 4 | 3.8 | 2 | 10.7 | 7.6 | 63.1 |
| AgriSafe Network | https://www.agrisafe.org | US | NPO | 6 | 0.3 | 3 | 10.5 | 8.3 | 62.8 |
| National Centre for Farmer Health | https://farmerhealth.org.au/agrisafe-clinics | Australia | NPO | 9 | 2.0 | 3 | 12.1 | 9.2 | 50.4 |
| Better Health Channel | https://www.betterhealth.vic.gov.au/health/healthyliving/farm-safety-and-handling-agrichemicals | Australia | Government | 9 | 2.3 | 3 | 11.2 | 8.5 | 56.3 |
| WorkSafe Victoria | https://www.worksafe.vic.gov.au/agriculture | Australia | Government | 8 | 3.5 | 2 | 13.1 | 11.3 | 52.5 |
| Farmsafe Australia | https://farmsafe.org.au | Australia | NPO | 7 | 3.1 | 4 | 10.7 | 8.6 | 60.6 |
| SafeWork NSW | https://www.safework.nsw.gov.au/__data/assets/pdf_file/0011/483680/SW09235-0519-A-Z-Farm-Safety-Guide.pdf | Australia | Government | 8 | 2.9 | 2 | 11.3 | 8.3 | 59.5 |
| Lancaster General Health | https://www.lancastergeneralhealth.org/health-hub-home/2021/december/18-simple-steps-to-prevent-farm-accidents (link no longer active) | US | Professional | 4 | 1.3 | 3 | 11.5 | 8.5 | 56.3 |
| Injury Matters | https://www.injurymatters.org.au/wp-content/uploads/2021/06/201123_KI_ToolkitFarmSafety.pdf | Australia | NPO | 4 | 1.3 | 2 | 14.5 | 11.4 | 38.7 |
| UGA Extension (University of Georgia College of Agricultural & Environmental Sciences) | https://extension.uga.edu/publications/detail.html?number=B1255&title=agricultural-safety-preventing-injuries | US | Professional | 2 | 2.5 | 3 | 10.9 | 7.9 | 58.7 |
| Royal Australasian College of Surgeons | https://www.surgeons.org/en/about-racs/position-papers/farm-injury-trauma-prevention-2017 | Australia | Professional | 3 | 2.3 | 1 | 14.9 | 13.1 | 25.8 |
† Rounded to one decimal place.
FKGL, Flesch–Kincaid Grade Level. FRES, Flesch Reading Ease Score. NPO, non-profit organisation. NSW, New South Wales. SMOG, Simple Measure of Gobbledygook. WA, Western Australia.
Table 2: Mean and standard deviation for website content, accountability and readability, by category
| Category |
Content mean±SD† |
Accountability mean±SD† |
Readability mean±SD† |
|||
|---|---|---|---|---|---|---|
| Completeness (/9) | Accuracy (/4) | JAMA (/4) | SMOG | FKGL | FRES | |
| Government (n=6) | 7.3±1.8 | 3.1±0.5 | 2.2±0.4 | 11.4±0.9 | 8.8±1.3 | 56.9±5 |
| Non-profit organisation (n=4) | 6.5±2.1 | 1.7±1.2 | 3±0.8 | 12±1.8 | 9.4±1.4 | 53.1±11 |
| Professional (n=3) | 3.0±1.0 | 2.0±0.6 | 2.3±1.2 | 12.4±2.2 | 9.8±2.8 | 46.9±18.3 |
| All websites | 6.1±2.4 | 2.4±1 | 2.5±0.8 | 11.8±1.5 | 9.2±1.7 | 53.4±10.6 |
† Rounded to one decimal place.
FKGL, Flesch–Kincaid Grade Level. FRES, Flesch Reading Ease Score. NPO, non-profit organisation. SD, standard deviation. SMOG, Simple Measure of Gobbledygook.
Table 3: JAMA benchmarks and number of benchmarks met for the selected websites
| Number of websites (n (%)) (N=13) | |
|---|---|
| 4 benchmarks met | 1 (8) |
| 3 benchmarks met | 5 (38) |
| 2 benchmarks met | 6 (46) |
| 1 benchmarks met | 1 (8) |
| 0 benchmarks met | 0 (0) |
| Attribution benchmark | 4 (31) |
| Authorship benchmark | 4 (31) |
| Currency benchmark | 13 (100) |
| Disclosure benchmark | 11 (85) |
Table 4: Content evaluation summary of hazard agents addressed and hazard control measures recommended
| Hazard agent |
Websites addressing hazard agent n (%) (N=13) |
Websites recommending hazard control measure n (%) (N=13) |
|||||
|---|---|---|---|---|---|---|---|
| Level 1 | Level 2 | Level 3 | Level 4 | ||||
| Personal protective equipment | Admin controls | Engineering controls | Isolation | Substitution | Elimination | ||
| Tractor | 13 (100) | 11 (84.6) | 10 (76.9) | 12 (92.3) | 1 (7.7) | 1 (7.7) | 0 (0) |
| Quad bike | 11 (84.6) | 10 (76.9) | 9 (69.2) | 9 (69.2) | 4 (30.8) | 7 (53.8) | 2 (15.4) |
| Other farm vehicle | 8 (61.5) | 5 (38.5) | 6 (46.2) | 4 (30.8) | 4 (30.8) | 3 (23.1) | 2 (15.4) |
| Water body | 7 (53.8) | 2 (15.4) | 3 (23.1) | 2 (15.4) | 6 (46.2) | 0 (0) | 1 (7.7) |
| Motorcycle | 3 (23.1) | 2 (15.4) | 0 (0) | 0 (0) | 0 (0) | 0 (0) | 0 (0) |
| Horse | 8 (61.5) | 8 (61.5) | 5 (38.5) | 1 (7.7) | 2 (15.4) | 2 (15.4) | 0 (0) |
| Manual task | 9 (69.2) | 7 (53.8) | 7 (53.8) | 8 (61.5) | 4 (30.8) | 8 (61.5) | 8 (61.5) |
| Fall | 10 (76.9) | 9 (69.2) | 9 (69.2) | 8 (61.5) | 4 (30.8) | 3 (23.1) | 7 (53.8) |
| Livestock handling | 10 (76.9) | 5 (38.5) | 7 (53.8) | 8 (61.5) | 5 (38.5) | 1 (7.7) | 5 (38.5) |
Table 5: Content evaluation summary of average number of hazard control levels recommended, represented as accuracy
| Hazard agent |
Accuracy mean±SD† |
|---|---|
| Tractor | 2.5±0.9 |
| Quad bike | 2.7±1.1 |
| Other farm vehicle | 2.5±1.4 |
| Water body | 1.9±1.3 |
| Motorcycle | 0.3±0.6 |
| Horse | 2±0.8 |
| Manual task | 2.9±1.3 |
| Fall | 3.3±1.1 |
| Livestock handling | 2.5±1.5 |
† Rounded to one decimal place.
SD, standard deviation.
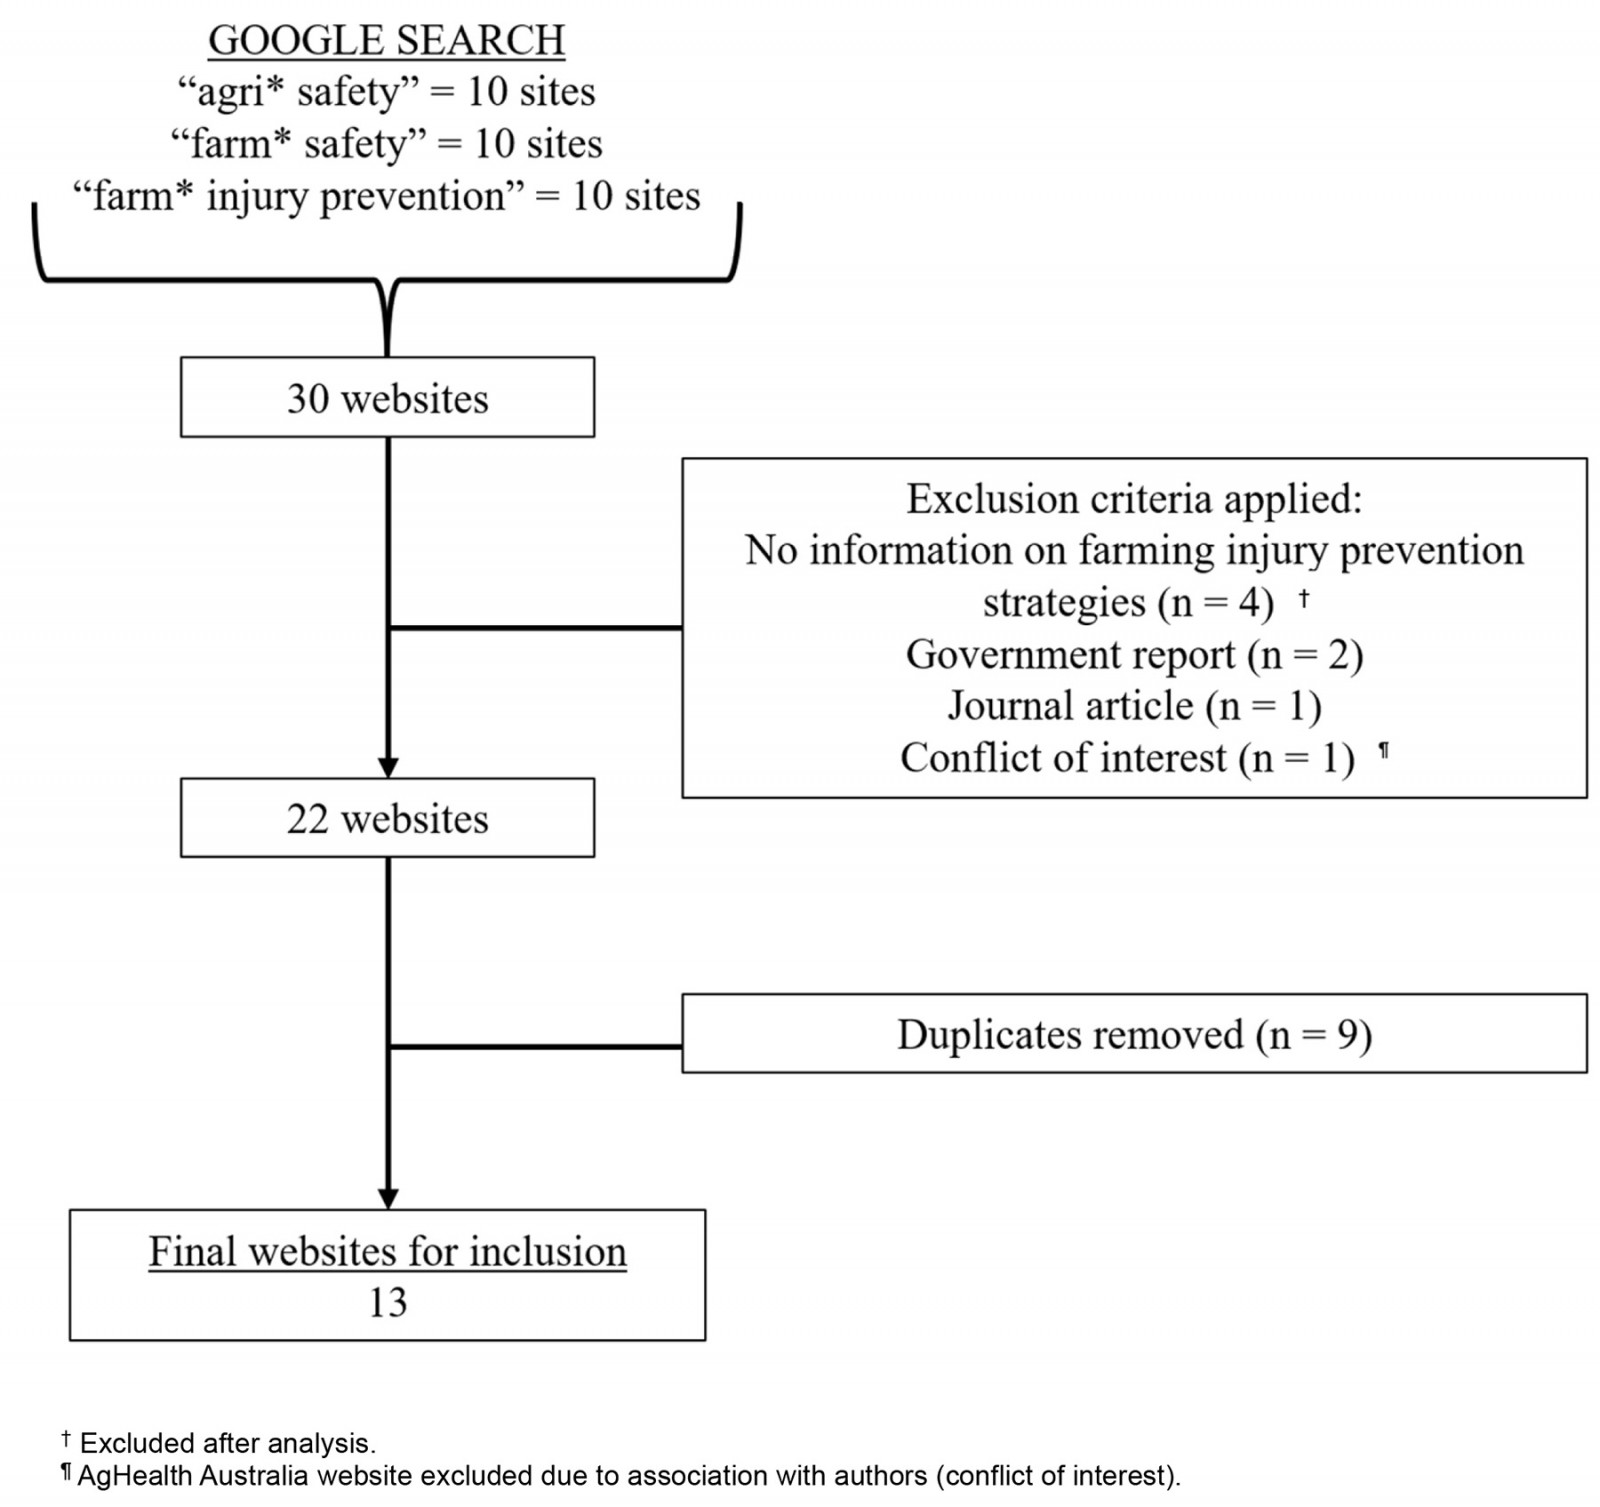 Figure 2: Flowchart for inclusion of search engine result pages for analysis.
Discussion
Numerous organisations provide websites that deliver safety advice to farmers; however, to date and to our knowledge, there has been no investigation into the standard of safety information, and to our knowledge this is the first article of its kind to examine the quality of information available on agricultural safety websites.
Both government and NPO websites showed more comprehensive results in addressing relevant hazards in agricultural safety when compared to professional websites. This finding may be due to a difference in the aims of website categories. For the government and NPO websites, both the SERP and the parent website are dedicated to occupational safety, as opposed to professional websites wherein only the SERP provided information concerning safety. Government websites showed higher accuracy scores than NPO and professional websites, a finding that may reflect the effort of government websites to increase the utilisation of the Hierarchy of Risk Controls. However, this finding may be due to differences in the websites’ target audience. The Hierarchy of Risk Controls is primarily relevant to workers, therefore NPO or professional websites aimed at the general public may not have incorporated it into their recommendations, leading to lower accuracy scores.
Through the assessment of accountability using the JAMA benchmarks, it was noted that authorship (n=4) and attribution (n=4) were disproportionately absent from the assessed websites when compared to disclosure (n=13) and currency (n=11). The authorship criteria require that authors and their relevant credentials are provided. The lack of declared authorship is likely due to the institutional nature of government and NPO websites, which make up the majority of websites assessed in this study. The attribution criteria require that references and sources are listed clearly. The lack of attribution may be due to inherent differences between safety information and healthcare information, which the JAMA benchmarks were originally designed to assess22. In health care, there is usually a sufficient amount of research and scientific evidence on which to base healthcare recommendations. In contrast, there is a profound lack of research on agricultural safety52-54, which may be the reason for the lack of attribution.
Readability was assessed using several readability scores, including SMOG37, FKGL39 and FRES38. According to SMOG scoring, no websites were below grade 8 level of readability. This finding is consistent with those of Cheng and Dunn55, who found that, when using SMOG scoring, only 0.4% of Australian healthcare websites were written at or below grade 8 equivalent readability. When using FRES, a score of 70 to 80 is equivalent to a school level of grade 750. No websites achieved a FRES score of 70 or above, which is the minimum score to meet the Australian Government recommendations. When using FKGL scoring, only 2 of the 13 websites were below grade 8 readability. As such, it can be stated that websites focused on agricultural safety have poor readability. Improving readability across all websites is critical for ensuring accessibility.
Overall, websites with a focus on agricultural safety can enhance their content by increasing the number of hazards discussed, notably motorbikes and water bodies. Additionally, these websites should more frequently utilise the framework set out by the Hierarchy of Risk Controls. Safety websites typically do not make attributions for their information but should do so to improve accountability and move towards more effective evidence-based recommendations.
The main strength of this study is that it addresses a current public safety issue using the most widely used search engine. This study has several limitations, including the collected data for categorical variables being dependent on the investigator’s skill in scanning and identifying these variables, which could lead to some information being missed. This was addressed by having two independent reviewers analyse each website. Although the aim was to gather a wide range of websites without favouring any specific region in Australia, results might not be generalisable outside of Australia. The number of hazards addressed was assumed to reflect completeness and the average number of recommended control levels was assumed to reflect accuracy. These assumptions have not been validated; therefore, it is important to be cautious when using ‘completeness’ and ‘accuracy’ to judge the quality of agricultural safety information. This is a common limitation due to the frequent use of novel quantitative checklists in the assessment of content on websites11-13. Furthermore, in relation to completeness, using the total number of hazards addressed does not consider that some hazards may be more relevant than others due to their prevalence in the farming community and the severity of resulting injury. For example, addressing tractors may be more important than motorcycles due to their higher rate of mortality. In addition, accuracy uses the Hierarchy of Risk Controls as a standard due to its widespread use in occupational safety. Yet, the effectiveness of the Hierarchy of Risk Controls in the agricultural industry has not been established in the literature.56A survey of Canadian farmers found that reported adherence to all levels of the Hierarchy of Risk Controls did not correlate with a protective effect for injury56. Finally, many of the referenced studies that guided website and information interpretation are outdated, limiting the applicability of these tools to modern contexts.
Moving forward, future research should consult farmers on their sources of safety information, as it is important to establish whether farmers are using the websites assessed in this study. A 2015 survey of farmers in the US identified newspaper and magazine articles as the most commonly used source of agricultural safety information, followed by the internet7. However, this survey can be considered outdated in the exponentially growing digital world. Likely, farmers are increasingly obtaining safety information from videos on YouTube or other social media platforms7,8. A 2019 qualitative study interviewing dairy farmers in the US highlighted the utility of videos as a source of safety information for workers57. Future studies should focus on codesigning a validated tool to assess occupational safety information.
Conclusion
Websites related to agricultural safety could enhance their content by increasing the number of hazards discussed. Government websites contained agricultural safety information that was of greater quality when compared to NPO and professional websites, frequently addressing important hazards and utilising the Hierarchy of Risk Controls as a framework. In addition, occupational safety websites should endeavour to address more hazards and recommend control measures that reduce worker exposure to hazards. Finally, websites focused on agricultural safety showed poor readability and should focus on attributing recommendations. Combined, these modest recommendations might increase the overall quality of safety information available to farmers.
Acknowledgements
The research team thanks professor David Lyle for his insights on the draft of the manuscript.
Funding
The authors declare no specific funding was received from any bodies in the public, commercial or not-for-profit sectors to carry out the work described in this article.
Conflicts of interest
The authors declare no conflicts of interest.
References
appendix I:
Appendix I: Checklist for assessment of content on agricultural safety websites
| Hazard agent | Are [hazards] addressed as a hazard? | Is [hazard control measure] recommended as a control measure for [hazard]? | |||||
|---|---|---|---|---|---|---|---|
| Hazard control measure | |||||||
| Personal protective equipment | Admin controls | Engineering controls | Isolation | Substitution | Elimination | ||
| Tractor | |||||||
| Quad bike | |||||||
| Other farm vehicle | |||||||
| Water body | |||||||
| Motorcycle | |||||||
| Horse | |||||||
| Manual task | |||||||
| Fall | |||||||
| Livestock handling | |||||||
Appendix II: Statistical results of independent t-test comparing categories for JAMA, SMOG, FKGL and FRES scores
| Assessment type | Comparison | Mean±SD† | t-statistic | Degrees of freedom | p-value | |
|---|---|---|---|---|---|---|
| JAMA | Government and NPO | 2.2±0.4 | 3±0.8 | –2.169 | 8 | 0.062 |
| Government and Professional | 2.2±0.4 | 2.3±1.2 | –0.333 | 7 | 0.749 | |
| NPO and Professional | 3±0.8 | 2.3±1.2 | 0.904 | 5 | 0.408 | |
| SMOG | Government and NPO | 11.4±0.9 | 12±1.8 | –0.638 | 8 | 0.541 |
| Government and Professional | 11.4±0.9 | 12.4±2.2 | –1.057 | 7 | 0.326 | |
| NPO and Professional | 12±1.8 | 12.4±2.2 | –0.32 | 5 | 0.762 | |
| FKGL | Government and NPO | 8.8±1.3 | 9.4±1.4 | –0.726 | 8 | 0.488 |
| Government and Professional | 8.8±1.3 | 9.8±2.8 | –0.819 | 7 | 0.44 | |
| NPO and Professional | 9.4±1.4 | 9.8±2.8 | –0.286 | 5 | 0.787 | |
| FRES | Government and NPO | 56.9±5 | 53.1±11 | 0.738 | 8 | 0.482 |
| Government and Professional | 56.9±5 | 46.9±18.3 | 1.314 | 7 | 0.23 | |
| NPO and Professional | 53.1±11 | 46.9±18.3 | 0.563 | 5 | 0.598 | |
† Rounded to one decimal place.
FKGL, Flesch–Kincaid Grade Level. FRES, Flesch Reading Ease Score. NPO, non-profit organisation. SD, standard deviation. SMOG, Simple Measure of Gobbledygook.
You might also be interested in:
2010 - Emergency department demographics at a small Australian rural hospital