


Introduction
Human health resources delivering healthcare services, and the equity distribution of health personnel resources, are issues that need attention in Turkey. Regional differences in the allocation of health resources can be a significant barrier to access for some of the population to health services1. The importance of availability, distribution and quality of human resources for health is increasingly understood in reaching the goals of national, regional and international health systems. Measuring inequalities in health human resource distribution is a new area of research2. The imbalanced distribution of healthcare personnel within a country or between countries is, more or less, a common problem for the world as well as for Turkey. Especially in developing countries, there are inequalities in the distribution of human resources for health. In many countries, density is much higher in capital cities3. In contrast to other countries, both quantitative inadequacies and distribution imbalances exist in Turkey’s health labour force. Healthcare employees are more concentrated, particularly in metropolitan areas such as Istanbul, Ankara and Izmir4. Therefore, several policy reforms were introduced to achieve a more balanced distribution of the health labour force and provide people with equitable health service access in Turkey.
The Ministry of Health launched the Health Transformation Program (HTP)5 in 2003 for effective, efficient and fair provision of healthcare services for all people. In this process, having a quantitatively and qualitatively adequate supply of human resources for health has been a principal objective, and various policies have been implemented for this purpose.
In the framework of the HTP, several measures were introduced to change the distribution of human resources for health. One of these changes is the opportunity for physicians to work under contract. By this means, physicians were given a chance to work for higher wages in places where attracting and retaining doctors was difficult, leading to a more balanced distribution of physicians across the country. Also, a nationwide prioritisation system has been established in personnel appointments, and staff have started to be employed accordingly. According to this prioritisation system, new healthcare worker would primarily be assigned to institutions for which needs are urgent. In addition to the regulations made, the student quotas of medical faculties have been increased to improve the quantitative aspect of human resources for health.
This study aimed to take a closer look at the impact of policies implemented to reduce the imbalance of the distribution of human resources for health for more than 10 years in Turkey.
Methods
To examine the distribution of health labour force within the country and change trends by years, this situation analysis study used the official data on active health professionals in 2002, 2005, 2008 2012, and 2016, collected from the Ministry of Health-affiliated General Directorate of Personnel6. The study also used the population statistics of the Turkish Statistical Institute as official data7.
In this study, the term ‘health professionals’ was confined to specialists, GPs, nurses and midwives. Graduate medical doctors working in residency programs were excluded because their education hospitals were mostly located in populated and economically developed regions of Turkey.
There are 81 provinces in Turkey. The number of provinces in the country changed most recently in 1999. Hence, during the period covered by this study there has been no change in the number of provinces in Turkey.
Distributional imbalance was analysed using Lorenz curves and Gini coefficients at the province level. As a summary measure, the Gini coefficient captures the deviation shown in the Lorenz curve between the observed distribution and the expected uniform distribution, which represents equality8. This equality distribution is shown by a diagonal line, and the greater the deviation of the Lorenz curves from this line, the greater the inequality (Fig1). When applying this index to health variables, the cumulative proportion of the population is generally shown on the x-axis, and the cumulative proportion of the health variable on the y-axis9,10.
The Gini coefficient ranges from 0 to 1. The value of 0 represents perfect equality, and the value of 1 indicates total inequality. It corresponds to twice the area between the Lorenz curve and the equality line, as shown in Figure 1. The first step for calculating the Gini coefficient using geopolitically aggregated data is to sort the geographic units by health variable (eg physician density – number of physicians per population) from the worst to the best situation (highest to lowest density). The densities are then transformed into continuous variables and the cumulative proportion is calculated for both variables. The graph showing the cumulative proportion for the health variable (y-axis) and the cumulative proportion of the population is then prepared, and the Gini coefficient can be calculated. Although the level of inequalities is reflected in the value of the Gini coefficient itself (eg a value very close to 0 will represent a low level of inequality), the interpretation of the coefficient is usually done in comparative terms, by contrasting the calculated value to that of other geographic units and population groups. Again, a coefficient of 0.2 will represent a higher level of equality than a coefficient of 0.4. The cumulative proportions of both variables can also be read directly from the graphical representation of the Lorenz curve.
The Gini coefficient can be expressed as a ratio of two regions defined by a 45 degree line and a Lorenz curve in a unit box. There are different methods to calculate the Gini. One of these methods, Brown’s formula11, is:
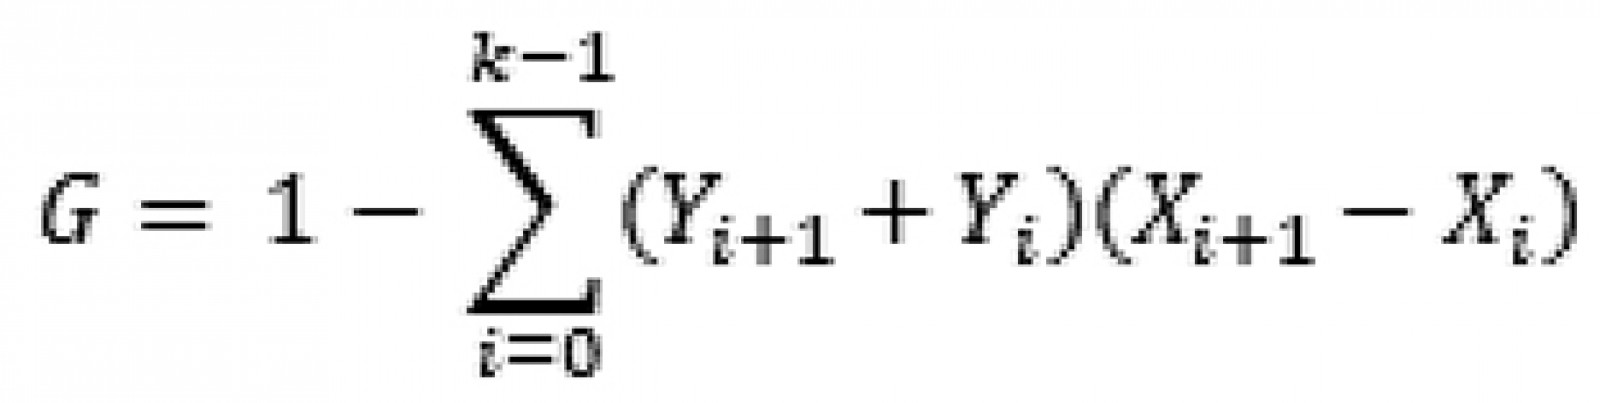
where X is a cumulated proportion of the population variable, Y is the cumulated proportion of the health variable and k is the number of geopolitical units9. DAD v4.6 (University of Laval; http://dad.ecn.ulaval.ca) distributive analysis software12 was used to draw the Lorenz curves and calculate Gini coefficients. Population weights were taken into account in the estimates. Confidence intervals for the Gini coefficients were also calculated.
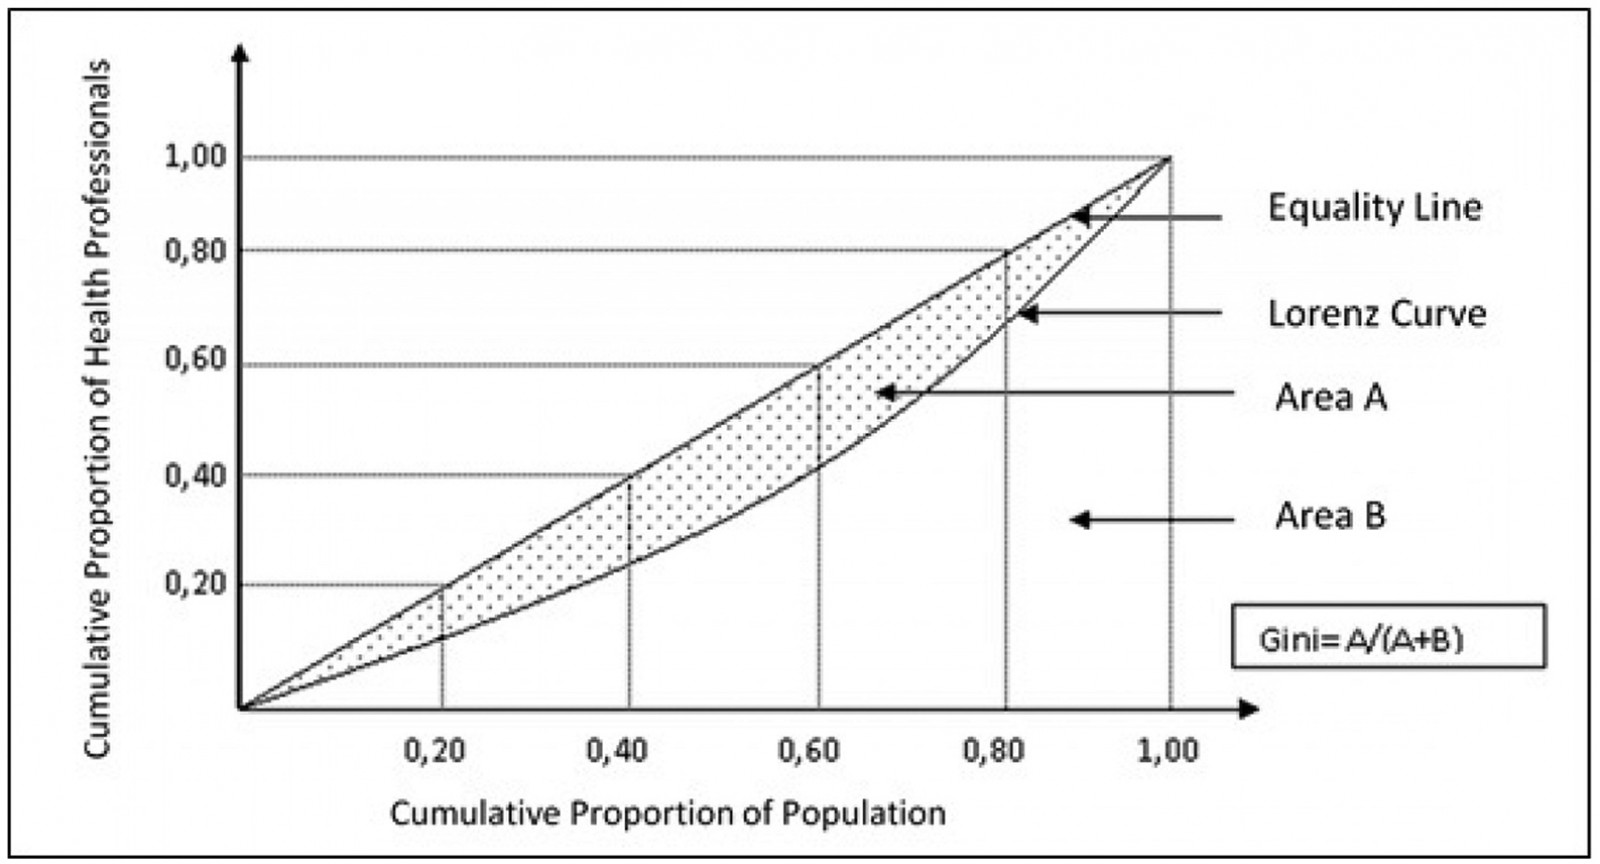 Figure 1: Health professional distributional imbalance analysis using Lorenz curves and Gini coefficients at province level in Turkey, 2002–2016.
Ethics approval
The data used in this study were collected from open public resources and so no ethics approval was required.
Results
The effect of the health policies applied over 15 years on health human resources distribution was analysed using Lorenz curves and Gini coefficients at province level in this study. The average number of people per health professional for different health professions during 2002–2016 in Turkey is presented in Table 1. The average number of people per health professional decreased gradually over the years, except for GPs for 2008.
Gini coefficients for the distribution of health professionals at the province level in 2002, 2005, 2008, 2012 and 2016 in Turkey are presented in Table 2. Figure 2 shows the Lorenz curves for the distribution of specialists, general practitioners, nurses and midwives at the province level during the past 15 years.
While the highest values of Gini coefficient are seen in specialists, the lowest values are seen in general practitioners. Geographical imbalances for healthcare professions have shown a noticeable decrease along the study years except for 2016. The Gini coefficient was 0.33 for the inequality of provincial distribution of specialists in 2002, but it decreased gradually to 0.27 in 2005, 0.26 in 2008 and 0.19 in 2012. However, it increased mildly by 0.02 points in 2016. Gini coefficients also slightly increased in 2012–2016 for the distribution of GPs and total physicians. In the same 2012–2016 period, the Gini coefficient stayed stable for midwives and showed a slight decrease for nurses (Table 2).
In this study, the distribution of medical residents was not taken into account and they were excluded from all analyses. The number of medical residents increased from 15 592 in 2002 to 23 264 in 2016. The geographic distribution of medical residents was more unfair than the distribution of specialists and GPs. The Gini coefficient was estimated as 0.41 for medical residents in 2016. However, their distributional effect on the geographic imbalance of the total physician workforce was slight. The Gini coefficient for total GPs and the specialist workforce was 0.12 in 2016, and this coefficient increased by 0.04 points when medical residents were included in the calculation.
Table 1: Number of health professionals, Turkey, 2002–2016 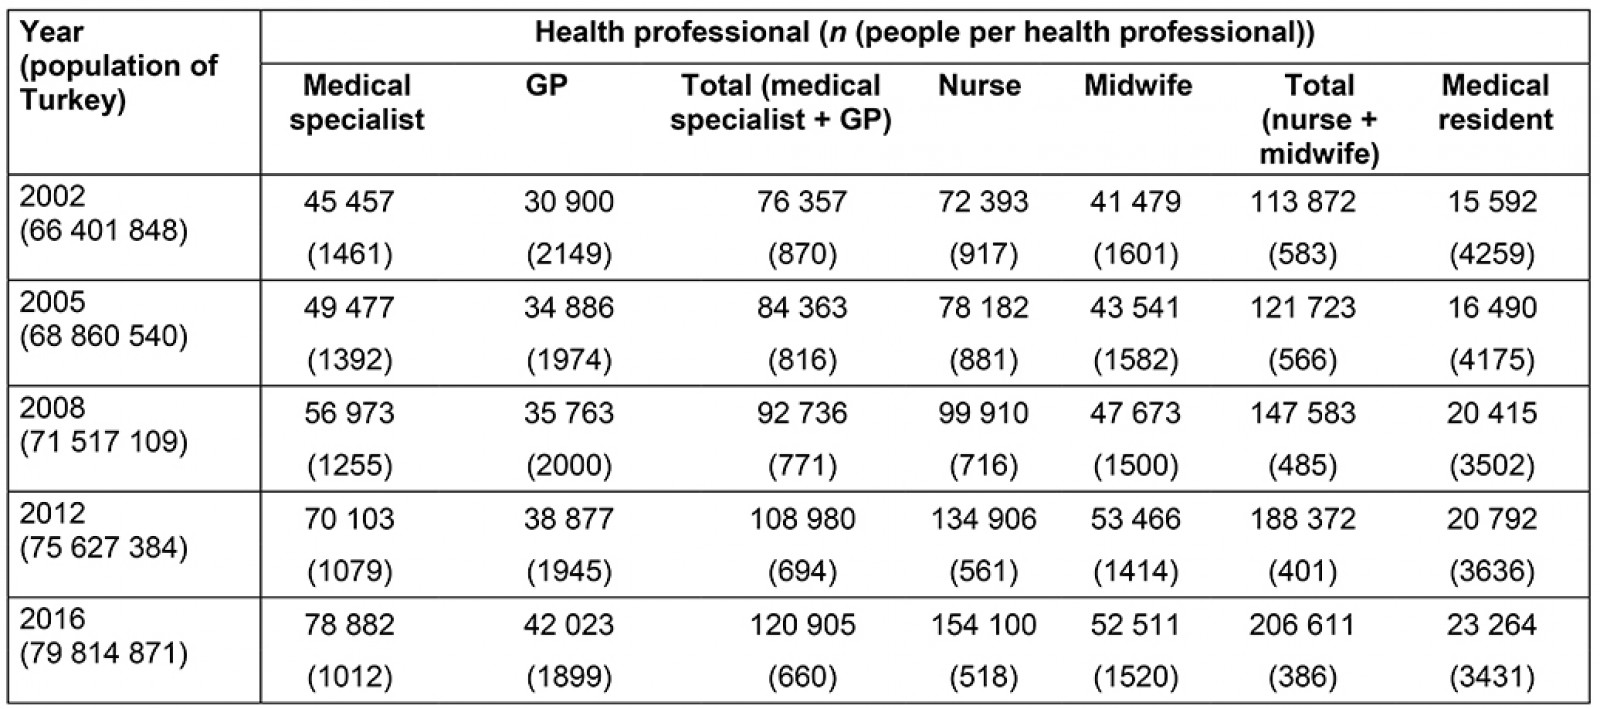
Table 2: Gini coefficients for distribution of health professionals at province level, Turkey, 2002–2016 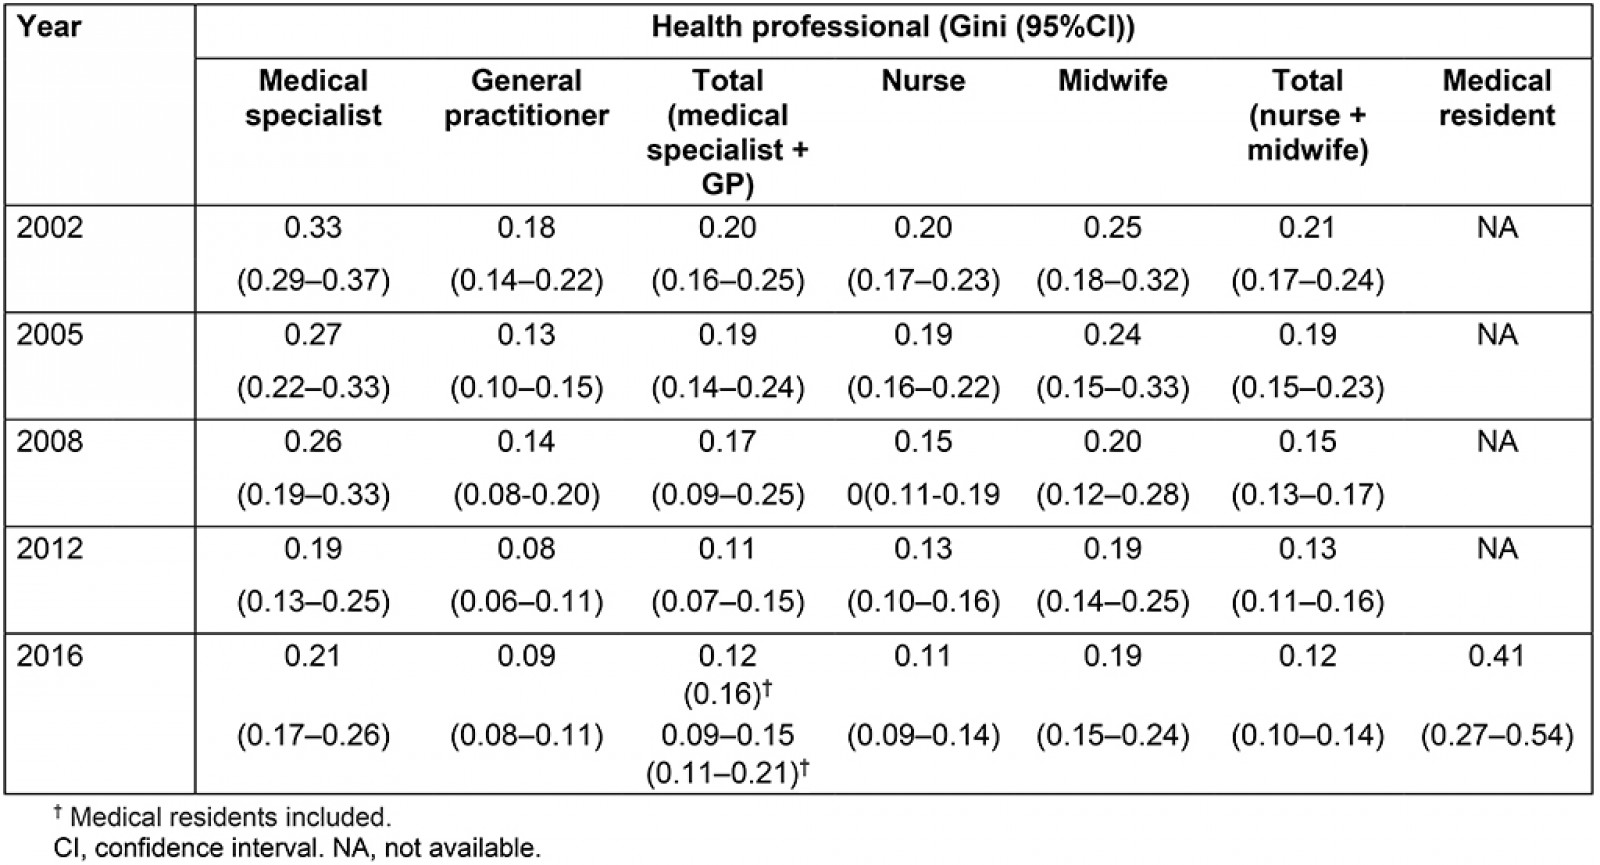
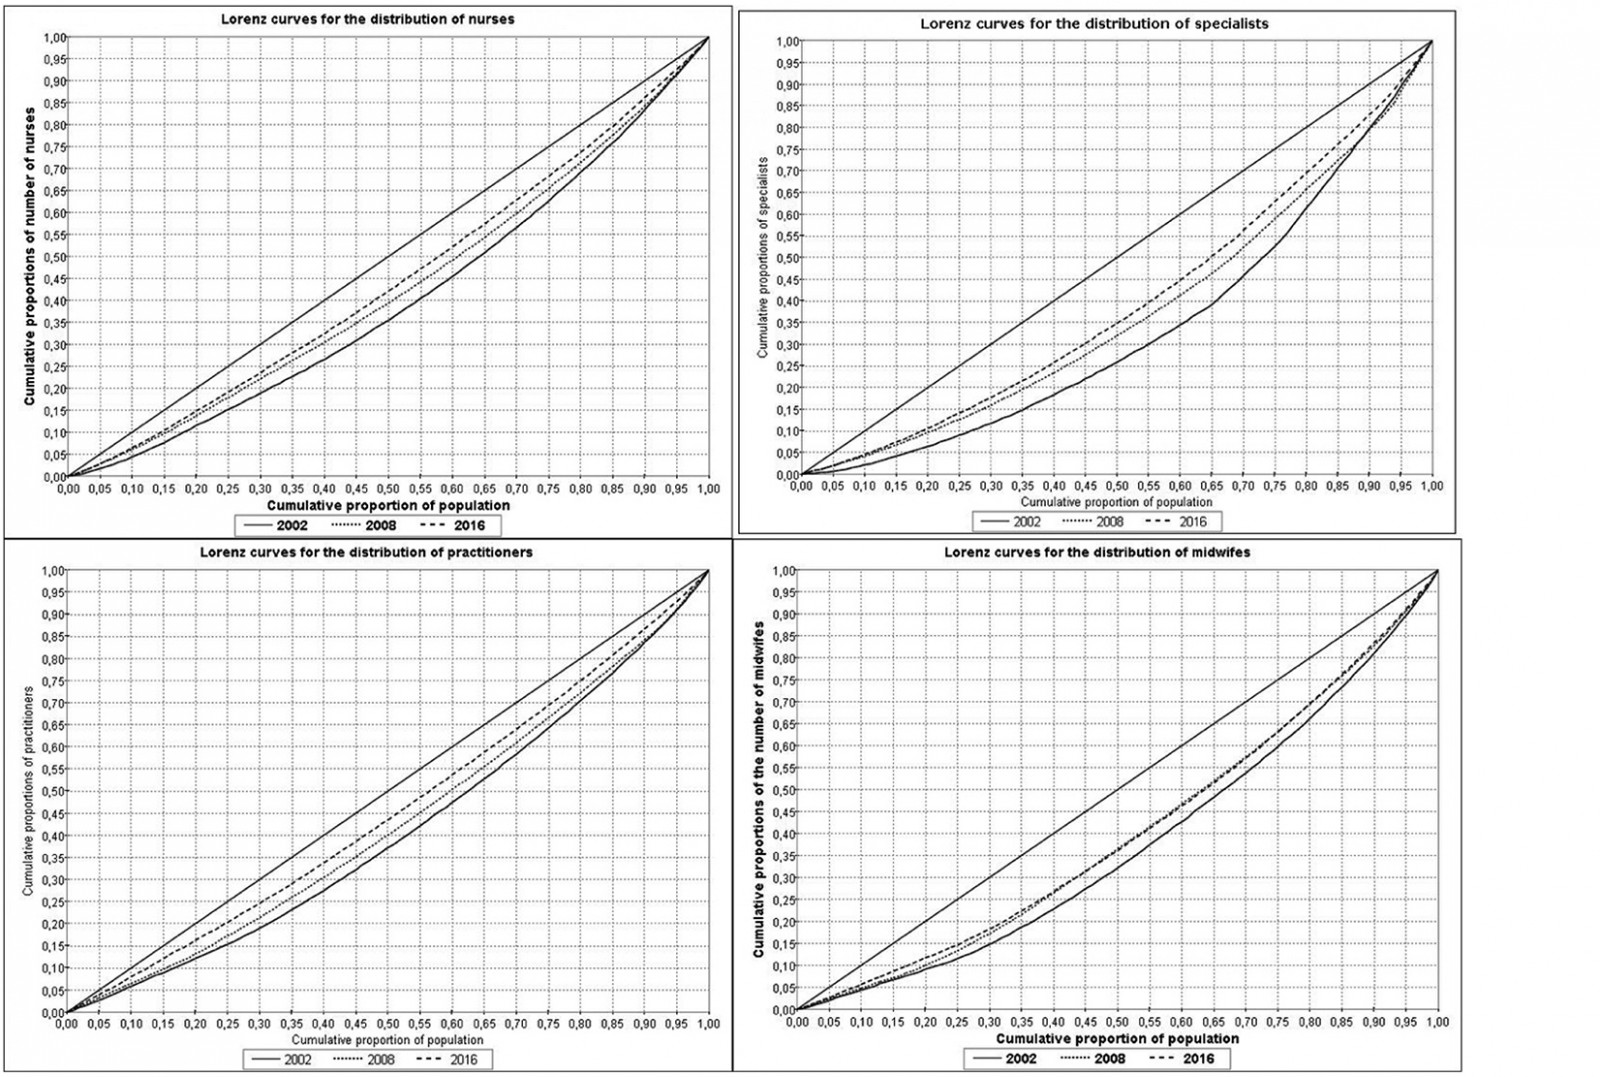 Figure 2: Lorenz curves for distribution of different health professions at province level in Turkey, 2002–2016.
Discussion
Human resources have an important place among health resources. The assessment of health human resources was carried out in the context of different health professionals in this study. According to an OECD report, Turkey still occupies the last ranks in the list of physician density among the OECD and the WHO European region countries, although it had one of the highest rates of increase in the number of physicians per 1000 population (5.4 %) in 2000–20093,13. Similarly, Turkey occupies the last rank in the list of nurse-midwife density (1.9 per 1000 population) among the WHO European region countries.
Because the inequities in human resources distribution are a serious threat to health care, the distribution imbalances need to be considered when formulating the policy, rather than simply increasing the number of human resources for health. The Lorenz curve and the Gini coefficient were used in studies where inequalities in the distribution of different health human resources were investigated8,14-23.
The Gini coefficient method has found widespread use in the measurement of health disparities in recent years, and the method has been widely used for many years to measure dimensions of dispersion inequalities24,25.
In this study, it was observed that the distribution of GPs was more balanced than specialist physicians. Similarly, in a study conducted in Iran, in which the distribution of health personnel between 2007 and 2013 was examined, it was observed that the distribution of GPs was more balanced than that of specialists23.
Geographical imbalances for healthcare professions have shown a noticeable decrease over the 15 years examined in the present study. The findings indicate that the health labour force has had a quantitative improvement in Turkey, and that some major progress has been made in the distribution of healthcare personnel within national borders, but there is still some way to go to reach the targets. For example, in 2016, the Gini coefficient for GP distribution was 0.09 in Turkey. This figure indicated a more balanced situation compared to Poland1, and Japan26, and GP distribution was less balanced compared to the UK26. Gini coefficients were 0.30, 0.17 and 0.08 for these countries, respectively1,26.
In Turkey, Ministry of Health detailed records considering the density of health professionals at the province level pointed to some problems in both GP and specialist physician supply in some of the eastern and south-eastern Anatolia provinces that are socioeconomically underdeveloped, such as Sirnak, Hakkari, Mus and Agri6. These results imply that physicians prefer not to practise in under-developed, remote and rural areas, even if they are paid higher wages. Although national researches conducted in Turkey indicate that physicians attach significance to financial incentives – very similar to the findings of many other studies conducted in the international literature – the implementation gave quite the opposite result27. The failure of the contract-based healthcare personnel employment implementation, despite its financial incentives, may need to be further questioned for underlying reasons. The Gini coefficient of primary care physicians against the population in Japan (0.1755) was more than twice that observed for Britain (0.0837), indicating a substantially less equal distribution in Japan.
It is observed that positive developments have been occurring in the density and distribution of health labour force in recent years under the HTP in Turkey. Although the compulsory public service is thought to have created bigger impacts on these positive outcomes, it is apparent that the success in reducing geographical imbalance is due to several actions and interventions over the years. Since its beginning, the process has clearly indicated that the qualitative and quantitative adequacy of healthcare personnel, in addition to the financial support and political commitment given to implementations and actions, is essential to the success of health reforms. In this regard, identifying and implementing financial and non-financial incentives to satisfy both health service providers and health service users is critically significant.
It is considered that good coordination of long-term plans, personnel appointments and other actions, which aim to enhance the capacity of health human resources in this new system running under HTP, will soon prove to be helpful in properly handling and overcoming the problem. Furthermore, as the imbalance is reduced and the number of qualified healthcare personnel is increased, the Ministry of Health may even reassess the compulsory public service in health service provision. If new universities are opened up in socioeconomically under-developed regions that suffer from physician undersupply, certainly without any prejudice to proper technological and scientific infrastructures, the distribution of medical residents might also be balanced. So, advanced technology might be reached. These new universities and medical schools might contribute to the socioeconomic development of these regions, which might then be further preferred by specialist physicians as a result.
It is seen that geographical imbalance is a more severe problem in developing and under-developed countries. This study indicates that political commitment, legal infrastructure and a wide range of actions, accompanied by patience and continuity, are required to overcome this problem. In this context, Turkey is believed to serve as an example for other countries having similar socioeconomic conditions and suffering similar problems.
However, a recent study revealed that unmet healthcare need due to availability has increased during the 2006–2013 period in the rural parts of Turkey28. In this regard, taking into account only the provincial level of HCW distribution is a limitation of the present study. The present findings cannot reflect the rural situation, and rural and urban disparities, at this point. In a recent study comparing the HRH distribution of urban and rural areas, it was found that the Gini coefficient of human resources in urban areas was lower than that in rural areas, which showed that the fairness of the allocation of human resources is slightly better in urban areas than that in rural areas21. Furthermore, findings marking mild deterioration of Gini coefficients for 2016 should be monetarised very closely.
Another limitation of this study is that disease diagnoses were not used in these analyses. Diagnoses that can be obtained from ICD10 disease codes would have been useful in revealing the distribution of human resource for health suitable for health needs. The ICD diagnostic coding system has been used for decades in Turkey and has been mandatory since 2005. However, the authors could not include this in terms of purpose and design in the present study.
The present findings cannot reflect the geographical relationships with the distribution of HRH. A drawback of using the Gini coefficient to assess inequality in physician distribution is that it ignores geographical relationships in data22.
Conclusion
Human resources for health per person in Turkey still remain very low compared to similar countries, but there is a promising and continuous decrease among the inequalities of human health workforce geographic distribution. It is crucial to evaluate the effectiveness of current implementations targeting human health workforce distribution imbalance and planning new and more effective interventions when needed.