


Introduction
The agencies overseeing the Australian Government’s National Disability Insurance Scheme (NDIS), the Department of Social Services (DSS) and the National Disability Insurance Agency (NDIA) have recognised the challenge of ‘thin’ markets for some years. In essence, thin markets reflect inadequate service availability resulting in people’s needs not being met1. The NDIS identifies thin markets as those 'where there is a gap between the needs of [clients] and the services available in the market. This can occur in a particular location (where services are needed), and/or for a particular service, and/or for certain cohorts of [clients]'2 (p. 3).
In particular, the NDIS and the NDIA are seeking to identify and respond to potentially thin markets for NDIS consumers who live in geographically rural/remote areas, as well as those who require specific supports or have complex needs. A key research initiative in this area is examining market actions and the stewardship of markets to address supply gaps as well as other disparities3. This includes a focus on market capacity in which the dimensions of market sufficiency and market diversity are key. Market sufficiency means there is enough service provision for competition to emerge and for basic needs to be met. Market diversity refers to the availability of different approaches to service provision, enabling participants to have a meaningful choice. The intersecting categories are summarised in Table 1.
This framework and these definitions provide helpful categories against which to consider the delivery of disability services and may be useful to inform decision making for rural contexts. In particular, it suggests that more remote regions, where market sufficiency and diversity of disability services are very limited, may be characterised as reflecting some degree of market failure. It may also be noted that many rural and remote disability services are far from the ideal of diversified supply.
Table 1: Market capacity framework3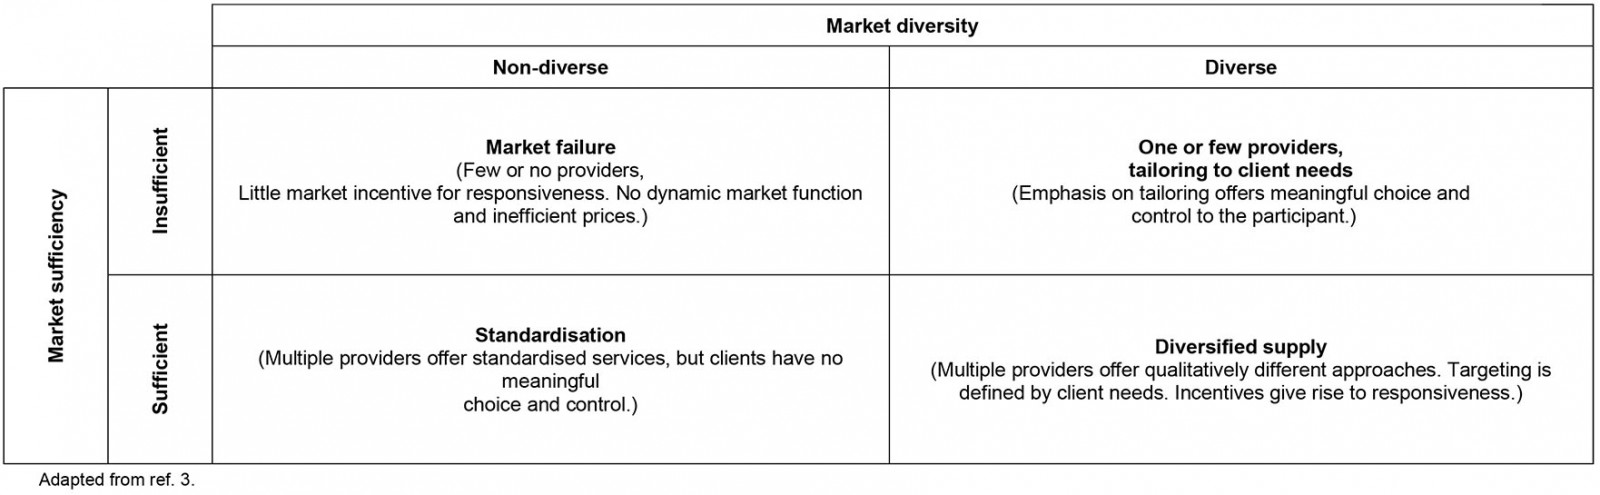
Methods
We sought to gain an indication of the extent to which the disability services market (in particular, NDIS services) in rural Queensland reflected sufficiency and diversity. Therefore, we undertook a spatial analysis of allied health professionals and disability support providers in rural Queensland. Spatial analysis is a technique used to document and explore location-specific questions and problems4. In the context of health services research, spatial analysis is a seminal methodology that has consistently been used to investigate the geographic distribution of health services in relation to priority areas requiring services5,6. In this respect, spatial analysis has been used to establish the nature and capacity of services7 and/or accessibility of services (travel time to services)5. Such analysis can help identify locations having poor service access. Our spatial analysis sought to depict the number of health providers within Queensland localities across all regional classifications.
Data underpinning this work came from two sources. First, the location of health providers was derived from the Healthdirect Australia National Health Services Directory8, a comprehensive directory including the location of over 300 000 health services within Australia. Health services considered for this analysis included Queensland-based allied health providers across the disciplines of physiotherapy, occupational therapy, psychology, social work and speech pathology, and providers classified as disability-specific aids and equipment and disability-specific referral and information.
Second, regional classification data were obtained from the Australian Statistical Geography Standard Remoteness Structure9 which classifies all areas of Australia into five levels of remoteness largely based on service access. The five levels of remoteness consist of (from least remote to most remote) major cities, inner regional, outer regional, remote and very remote. Localities were areas defined by the Australian Bureau of Statistics’ Urban Centre and Locality structure. Localities are areas with residential populations of 200 people or greater within a distinguishable geographic boundary. These localities are mainly classified as bounded locality, other urban or major urban.
ArcMap v10.4.1 (ArcGIS; https://desktop.arcgis.com/en/arcmap/10.4) was used for all spatial analysis and the Statistical Package for the Social Sciences v26 (IBM; http://www.spss.com) was used to produce descriptive statistics. In ArcMap, all Queensland localities fitting entirely within a remoteness classification were identified using the ‘select by location’ geoprocessing tool. Next, the numbers of health services across each service type within each of these localities were counted via the spatial join geoprocessing tool. Then, descriptive statistics to clarify the mean number of providers for localities across regional classifications were produced using the crosstabs function in SPSS.
Results
Table 2 details the mean number of service providers across inner regional, outer regional, remote, and very remote localities. There were 241 localities across the three categories: bounded locality (population 200–499; 90 localities), bounded locality (population 500–999) (84 localities) and other urban (population 1000–4999; 67 localities). As there were only six localities residing entirely in a major city remoteness classification, descriptive statistics were not produced for this region. Similarly, 21 remaining localities straddling several classifications (particularly other urban classifications) were also not considered for analysis.
The numbers marked with daggers pertain to localities with the lowest mean number of providers (indicative of having the fewest providers) across the four selected remoteness classifications (inner regional, outer regional, remote and very remote). For example, the lowest mean number of physiotherapists in the larger urban localities (population 1000–4999 people) was 0.59 in the inner regional category (of which there were 37 localities). This amounts to roughly one physiotherapist across two localities. However, in the very remote category, the mean number was 1.20, which is much greater than one physiotherapist for each locality.
This pattern is also evident across other professions and remoteness classifications. In general, for the very small ‘bounded localities’ (population 200–499), those towns or localities having the inner regional or outer regional classifications tended to have a lower mean number of service providers (with the exception of psychology) than those classified as remote or very remote. Likewise, the mid-sized ‘bounded localities’ (population 500–999) in inner regional and outer regional areas tended to have lower mean numbers of service providers than their counterpart localities in remote and very remote areas. There was a very similar finding for ‘other urban’ localities (population 1000–4999). The more remote the town or community, the greater the relative proportion of service providers.
Table 2: Service provider means across three types of locality and remoteness classification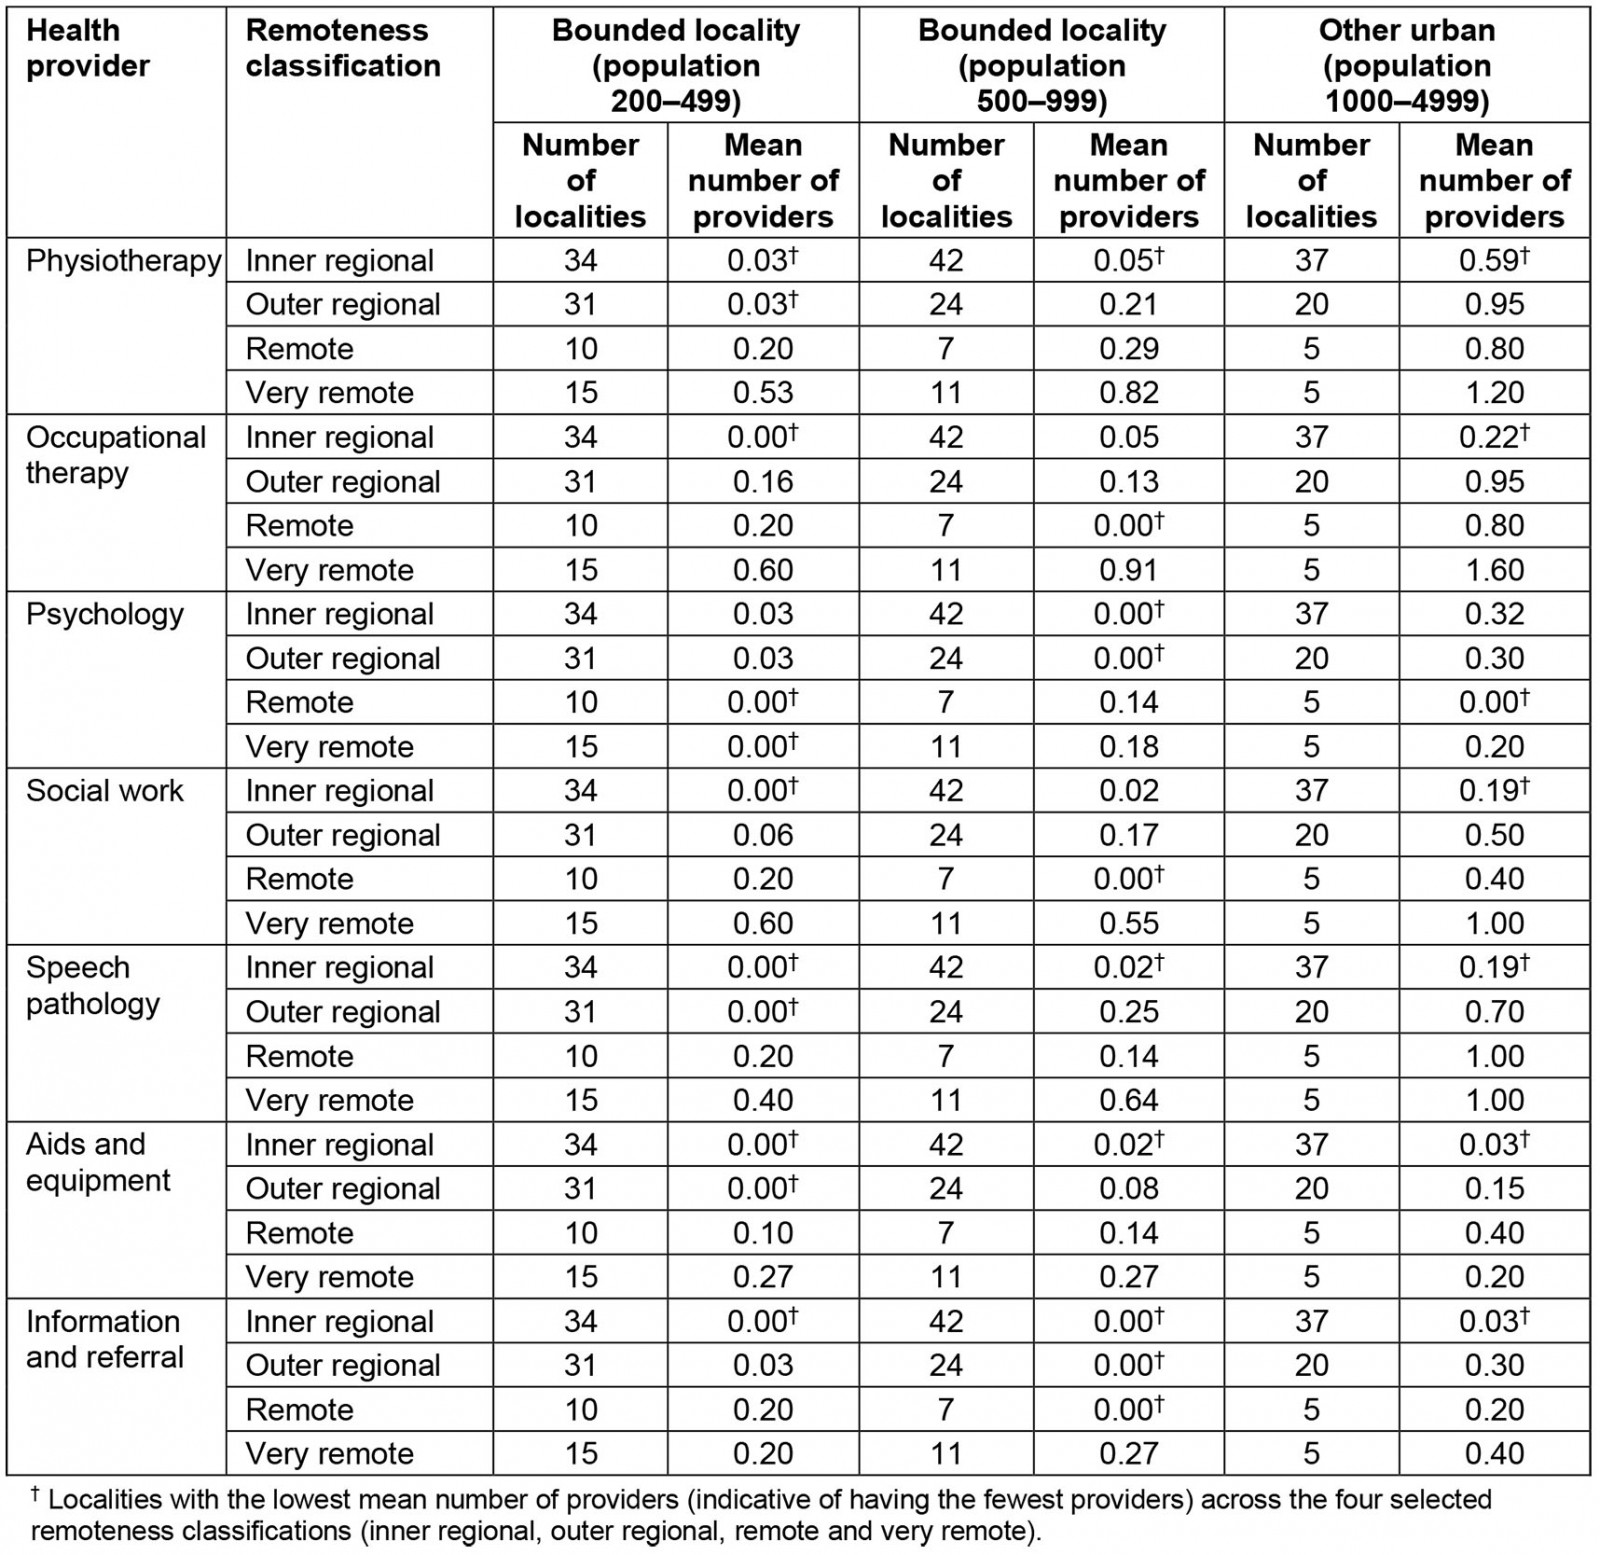
Discussion
A ‘face-value’ interpretation of these findings suggests that, across most allied health service types, people in more remote localities, for all three population sizes, tend to have a proportionally greater number of providers than those in towns with larger, more regional classifications. While we acknowledge that there may be other approaches to analysis that provide a different perspective, we were concerned that it could be concluded from this fundamental analysis that there are higher levels of sufficiency of allied health and disability services in more rural and remote areas than in regional areas. Specifically for major allied health practitioner types and more generic disability services, the mean number of providers was higher for the more remote categories than for the regional categories. A similar conclusion might be drawn with regard to diversity, noting that those localities coming under the more remote classifications are proportionally more likely to have a range of allied health and generic providers, and are more likely to have more of each category than those localities that are more regional.
Such a potential interpretation of these data may lead to funding or policy decisions for services, which preference those in the more regional (non-remote) areas. Our concern is that decision making based on these rather simplistic numerical or spatial interpretations of sufficiency and diversity will not accommodate other important dimensions. To conclude that there is greater sufficiency and diversity of disability services in more remote areas is at odds with the realities faced by consumers and providers in these communities10. We suggest that simple ratios of service providers or activities per population size do not capture the complexity of these issues, particularly in more remote geographical areas. The current commentary does not address why these findings are so counter-intuitive, but underscores the view that attempts to model adequacy of services relying on such proportions must be complemented by some qualitative and contextual understanding.
We suggest that concepts of market sufficiency and diversity should only be a part of any strategy to depict adequacy of services in rural and remote areas. Market-related conceptualisation should be complemented by consumer-related and provider-related conceptualisations of service adequacy. We offer a number of issues or considerations which may inform the conversation around how best to identify and respond to rural and remote ‘thin’ markets for disability services.
Adequacy of services is also a function of meaningful consumer choice. For some rural and remote consumers, the push for diversity of providers may have limited traction. Thin-markets thinking suggests that, where there is low diversity, in the form of a common delivery model, few locations or limited hours, meaningful choice for consumers in how they can access care is reduced. In our experience of disability services (and indeed many other services and amenities in more remote communities), people are likely to prefer a provider who is familiar, who understands them, and is familiar with their context. Suitability of providers rather than choice of providers may be a primary concern11.
Adequacy of services also depends on consumer preference for provider. For many rural and remote consumers, other attributes may also be important in their choice of provider. In particular for Indigenous consumers, concerns for the cultural safety of the provider and the agency will outweigh concerns of market sufficiency and diversity12,13. Likewise, other factors such as gender of provider, personal factors, perceived skills and relevance of the provider or mutual connections or existing relationship will also be important for some and will outweigh market factors.
Workforce factors may also inform conceptualisations for depicting services.
Depictions of adequacy of access must acknowledge service base as well as service location. For many allied health and disability service providers in rural and remote locations, their place of residence or primary business location may be very far from the locations in which services are provided. As such, there are likely to be many errors and inconsistencies in equating service access to the location in which practitioners are registered or based. The reality for many remote disability and health service providers is that much of their time is spent travelling14. This requires more nuanced consideration. Further, with the increasing adoption of telehealth, some of these discrepancies between provider and consumer location will become even more complex.
The notion of adequacy of access should accommodate the reality of multiple provider roles. In many smaller communities, allied health and disability services professionals have multiple roles15. They may also work in acute settings, aged care, private practice or outside of health and disability services. This reality of service delivery is likely to influence workforce statistics and mapping exercises.
Depictions of service adequacy should recognise the reality of ‘loose’ roles. In some remote communities, allied health professionals will often provide services beyond their prescribed role15. For example, the hospital occupational therapist might provide some disability services that would otherwise not be available, regardless of whether the professional is registered or compensated by the NDIS.
Understanding of adequacy of access should also acknowledge the place of non-traditional providers. Likewise, in some cases, community members may contribute skills and time to assist people with disabilities (for example, the local mechanic may repair a wheelchair, or community members may provide assistance with care). This reality of rural and remote contexts is a potential resource that may strengthen social integration but will confound attempts to quantify details of service provision.
Service adequacy is also a function of evidence. To some extent, discussion regarding market diversity or standardisation of services may run counter to the priority for evidence-based practice that underpins all allied health practice. If services provided align with best practice and current evidence, many other factors will be secondary. Whether there are multiple providers, standardised services and choice of provider should be less important than whether those services align with current best practice.
Conclusion
The concerns and considerations highlighted in this commentary have arisen from the authors’ uneasiness about too much reliance on quantitative or spatial data and methods to depict thin markets. In response we have highlighted a few of the factors that might be considered if we are to meaningfully depict the adequacy and availability of disability services in rural and remote communities. Our analysis suggests that nuanced approaches, recognising consumer and community considerations and provider realities will be important. However, most rural and remote consumers and families may not have had exposure to a full range of services and so may not be able to advocate for more nuanced approaches that may more appropriately meet their needs. Further, incorporating consumer-, community- and provider-relevant considerations into models or monitoring systems will be challenging, but necessary.
Policymakers, funding bodies and service provider agencies require objective indicators that can be collected and monitored to ensure quality, equity and access. The challenge facing all stakeholders is to develop new indicators that are meaningfully reflective of the realities of rural and remote consumers, families, communities and service providers, as well as market realities.
References
You might also be interested in:
2018 - “Surfing the coastal wave”-a new way to consider workforce distribution