


Introduction
Chronic non-communicable diseases pose a significant threat to human health due to their high potential for causing death and disability1. Among these diseases, diabetes mellitus is particularly concerning due to its rapidly increasing incidence and substantial impact on global public health2-4. In 2021, the prevalence of diabetes in adults aged 20–79 years reached 10.5% (536.6 million people)2. Projections suggest this figure will rise to 12.2% (783.2 million people) by 20452,5. Type 2 diabetes is the most common form, accounting for 90–95% of cases2,6. Effective management of type 2 diabetes and other chronic conditions requires a proactive, integrated, continuous healthcare system focused on the patient7. However, the current system tends to prioritize acute exacerbations of these conditions and operates in a fragmented, episodic manner7,8. This approach has led to negative consequences, including an increased burden on health systems and economic strain9. This issue is particularly pressing in low- and middle-income countries, like Brazil, where the capacity of health services to manage chronic conditions is even more limited9-12.
The Chronic Conditions Care Model appears to be a promising strategy for implementation in Brazil13. Based on the principles of the Chronic Care Model, the Chronic Conditions Care Model seeks to rethink and redesign care by adopting new strategies for patients in health services13,14. Its goal is to broaden the scope of care and foster dialog between informed, active patients and well-prepared, proactive health teams14}. Implementing this model can enhance institutional capacity to manage chronic conditions, defined as the ability and effectiveness of health institutions to provide adequate care and services to patients13,14. Evaluating this capacity provides objective data that can guide service improvements15,16.
The Patient Assessment of Chronic Illness Care (PACIC) is an instrument designed to measure the perceived level of chronic illness management. It considers the service user's perspective and can be used across various levels of health care, including primary health care, which is crucial in managing patients with chronic conditions15-18. In diabetes, higher PACIC scores are associated with improved glycemic control markers, self-management activities, physical activity, and reduced distress19,20. Actions of primary healthcare providers involve regular and systematic monitoring of chronic diseases, aiming to control and prevent complications while providing adequate support to patients21-23. However, certain regions like Amazonas, Brazil’s largest state by area, face unique geographic challenges that hinder these efforts24,25. Remote municipalities face barriers such as limited access, a shortage of health services, and a shortage of medical professionals, which directly affect the health of the population26,27. An integrative review revealed that few studies in Brazil have examined the care provided by health institutions for chronic conditions from the service user's perspective16,28-30. In the northern region, no studies have been identified that address this topic.
The present study aimed to determine whether there is an association between individual characteristics, including sociodemographic, clinical, behavioral, and functional performance variables, and the PACIC score in the primary care setting in remote municipalities of the Brazilian Amazon.
Methods
Study design
This cross-sectional quantitative study is part of the Health in Primary Care for the Amazonas Population project31. Conducted between October 2020 and December 2022, the study covered 10 cities in the remote municipalities of Amazonas: Alvarães, Coari, Iranduba, Itacoatiara, Itapiranga, Manacapuru, Novo Airão, Presidente Figueiredo, Rio Preto da Eva, and Silves (Fig1). Amazonas, with 62 cities, faces unique geographical and socioeconomic challenges that hinder the development of primary healthcare initiatives25,32. Over half the population resides in Manaus, the state capital. The state has one of the lowest road network percentages in Brazil, due to both inadequate public management and the prevalence of rivers, which facilitate river navigation but limit road travel. Most cities rely on slow river transport, hindering regional development and complicating the provision of adequate healthcare support25,26,33.
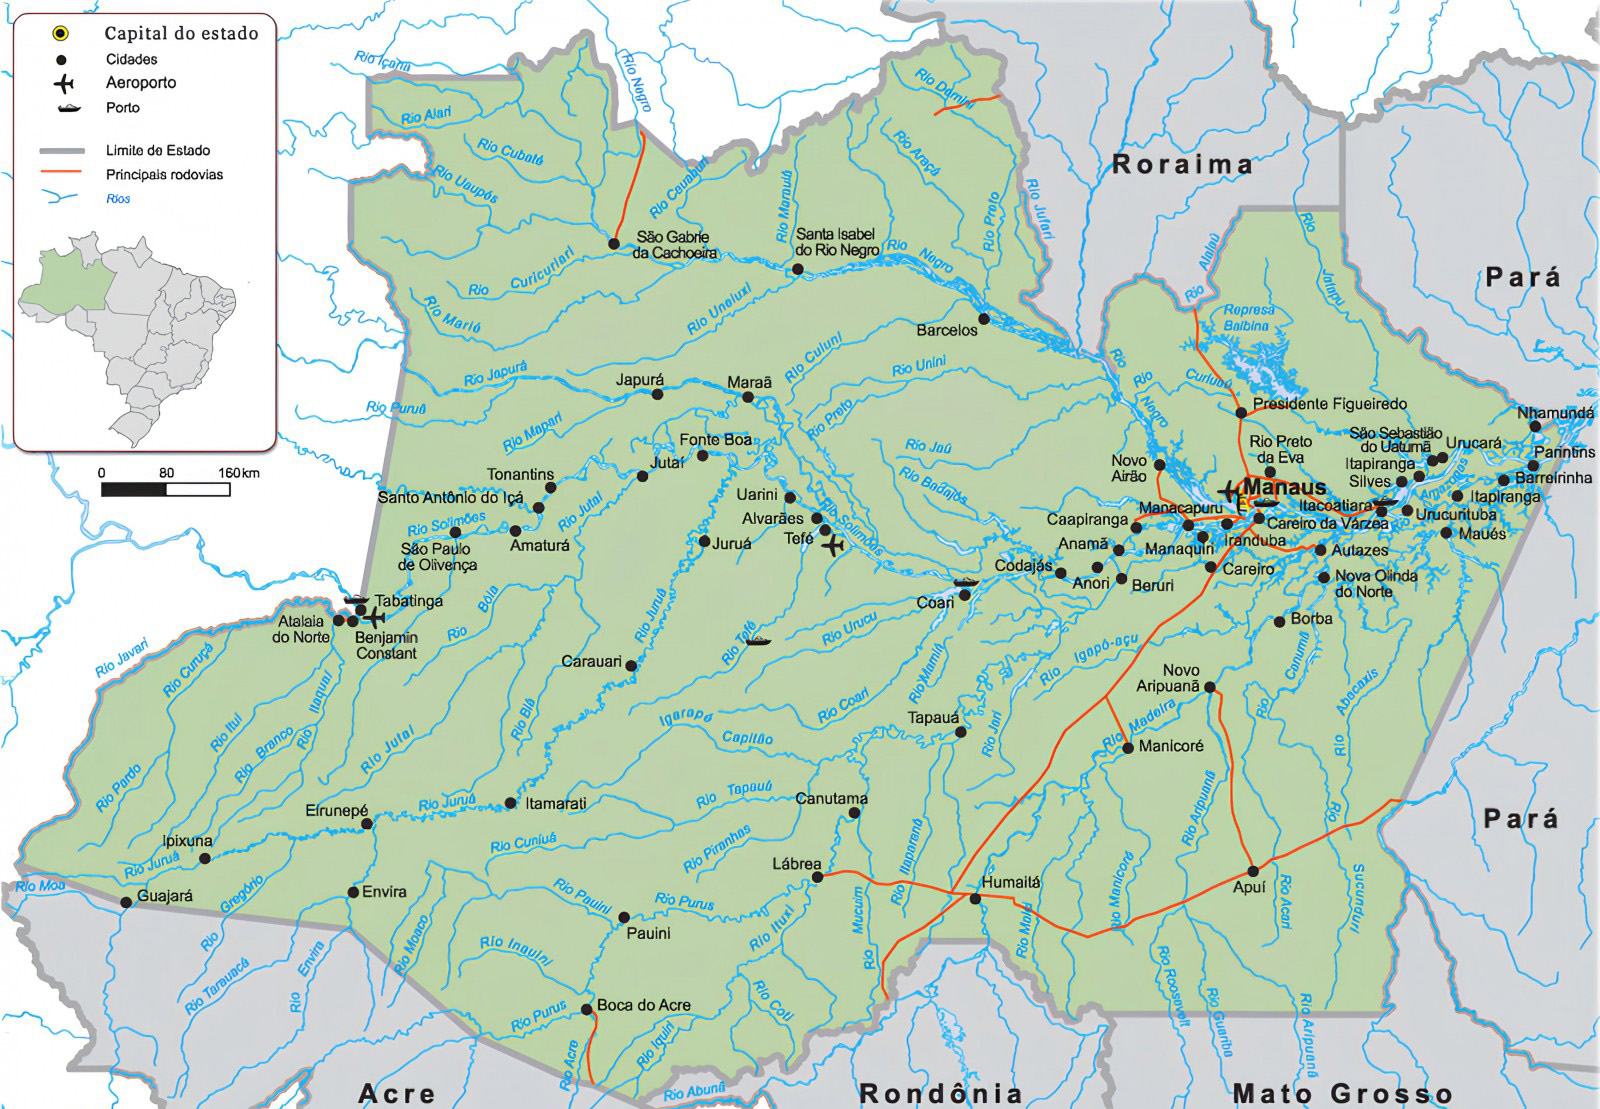 Figure 1: The state of Amazonas and its cities, Brazil34.
Participants and sampling technique
Participants in this study were patients diagnosed with type 2 diabetes who had been registered with a primary healthcare provider for at least 6 months. Exclusion criteria included patients who refused to participate or had communication disorders that hindered participation. The estimated number of type 2 diabetes patients required for the research was based on a diabetes prevalence of 5.2%35. Using G*Power software v3.1 (Heinrich-Heine-Universität Düsseldorf; https://www.psychologie.hhu.de/arbeitsgruppen/allgemeine-psychologie-und-arbeitspsychologie/gpower), a sample size of 955 participants was estimated31. Participants were randomly selected from the primary healthcare provider's registration lists.
Data collection instruments
Dependent variable
The dependent variable was the perceived level of type 2 diabetes management (measured by the PACIC). These scores were analyzed across the five PACIC domains and the instrument's total score. The study utilized the PACIC questionnaire, validated for use in Brazil, to collect data16,36. Additional information on participants, including sociodemographic, clinical, behavioral, and functional performance variables, was also gathered. The PACIC consists of 20 questions divided into five domains, with responses on a 5-point Likert scale: (1) never, (2) rarely, (3) sometimes, ( 5) always.
To calculate the total PACIC score, responses are summed and divided by 20. Each domain score is calculated by averaging the responses within that domain8,15. The domains provide insights into the care offered to patients with chronic conditions, reflecting essential elements of health care (Fig2).
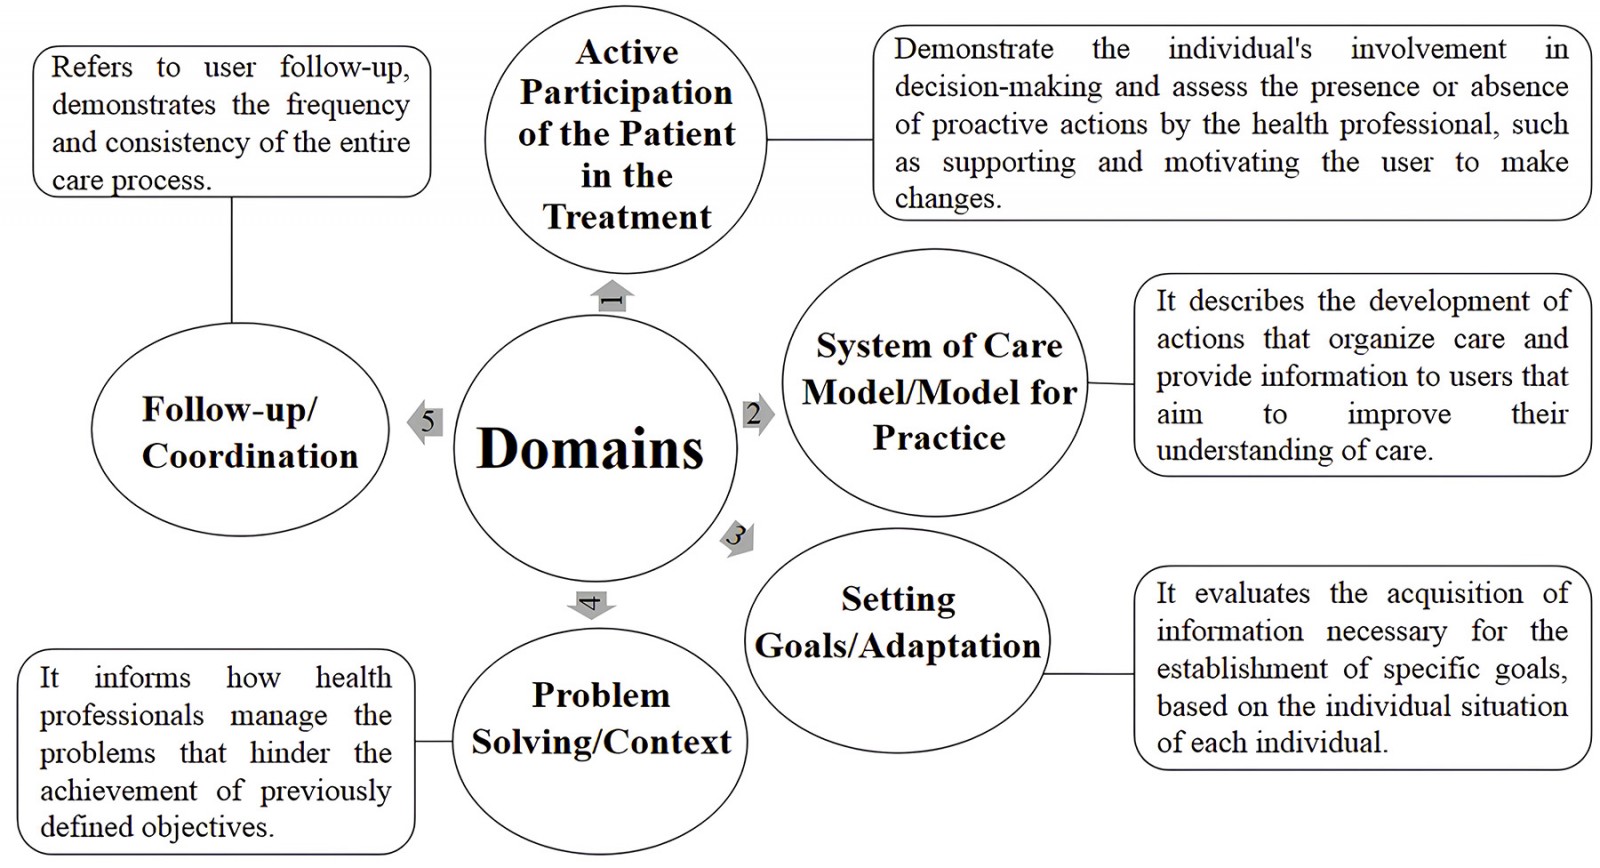 Figure 2: Description of Patient Assessment of Chronic Illness Therapy domains and their inherent aspects.
The PACIC domains are:
1. active participation of the patient in the treatment (questions 1–3)
2. system of care model/model for practice (questions 4–6)
3. goal-setting/adaptation (questions 7–11)
4. problem-solving/context (questions 12–15)
5. follow-up/coordination (questions 16–20).
Higher scores represent better ratings8,15.
Independent variables
The independent variables were organized into four blocks: sociodemographic, clinical, behavioral, and functional performance. Sociodemographic variables were gender (female/male), age (years), race/ethnicity (yellow, white, indigenous, brown, black), marital status (single, married/common-law marriage, divorced, widowed), years of education, monthly income (categorized in minimum wage effective March 2023), retirement (yes, no), and current employment (yes/no). Clinical variables were self-perceived health (very bad, bad, fair, good, very good)37, duration of diabetes (years), memory difficulty (yes, no), number of self-reported diseases, number of medications taken, BMI (kg/m2)38,39, hospitalization in the year before the interview (yes, no), presence of chronic pain in the year before the interview (yes, no), raw score of the Patient Activation Measure 13 and patient activity level classification (level 1, no engagement and overwhelmed; level 2, becoming aware but still struggling, level 3: taking action; level 4, maintaining behavior and progressing)40.
Behavioral variables were need for travel to receive treatment (yes, no); participation in primary healthcare provider activities (yes, no), smoking status (yes, no), frequency of alcohol consumption (never, two or three times a week, four or more times a week, once a month or less, two to four times a month), level of physical activity according to the International Physical Activity Questionnaire (very active, active, irregularly active a, irregularly active b, sedentary)39, and intrinsic religiosity (Intrinsic Religiosity Inventory score)41.
Functional performance-related variables were raw score and classification in the Brazilian Older American Resources and Services Multidimensional Functional Assessment Questionnaire (no impairment, mild impairment, moderate impairment, severe impairment)42, and fall in the year before the interview (yes, no).
Data collection procedures
The researchers contacted the State Health Department of Amazonas and then the municipal health departments of each city. After receiving initial project approval from the state health department, they sought consent from the municipal health departments to conduct the research. Next, primary healthcare unit coordinators were identified to facilitate contact with patients and other professionals. Community health workers escorted researchers to the participants’ homes.
Data analysis
After data collection, the data were tabulated and analyzed using Microsoft Office Excel for tabulation and R software v4.2.1 (R Project; https://www.r-project.org) for analysis. Normality was assessed with the Kolmogorov–Smirnov test. Descriptive and inferential statistics were used to present results: percentages were used for categorical variables and means and standard deviations for continuous variables. The association between PACIC scores and independent variables was analyzed using a generalized linear model with a gamma distribution and a log-link function. Six models were adjusted, one for each dependent variable (each PACIC domain score and the total score). A significance level of 5% was used to reject null hypotheses when the p-value was less than 0.05. The model's linear predictor provides raw coefficient estimates, which are interpreted using the exponential function to return to the original scale of the dependent variable. For categorical variables, the lowest level served as the reference category, and 0 was used for numerical variables, applying this pattern across all models.
Ethics approval
The Health in Primary Care for the Amazon Population research study was approved by the ethics and research council of the Universidade Federal do Amazonas (registration 4.318.325 and 4.994.196). All participants sign the informed consent form before the interviews.
Results
The sample included 965 participants, predominantly female (67.7%), with an average age of 61.6±13.4 years. Most participants identified as brown (74.4%). Just over half were married (57.5%) and retired (51.0%). Length of education varied from 0 to 22 years, with a mean of 5.1±5.2 years. In terms of income, 47.5% earned below one minimum wage, while 36.3% reported earning one minimum wage, and approximately 64.5% of respondents were unemployed.
In terms of clinical variables, 46.0% of respondents rated their self-perceived health as fair. Poor and very poor health perceptions were reported by 22.6%. The average duration of type 2 diabetes was 7.8±7.2 years, and 55.0% reported memory difficulties. Participants reported an average of 3.0±1.7 self-reported diseases, with medication use ranging from 0 to 12 medications and a mean of 2.3±1.8 medications. The average BMI was 28.6±5.8 kg/m². More than half (58.7%) reported no chronic pain episodes, and 83.3% had no hospitalizations in the year before the interview. In terms of activity levels on the Patient Activation Measure 13, only 12.0% were classified as level 4 (high activity), while the largest group (32.8%) was level 3 (moderate activity).
There were 64.2% of participants who reported needing to travel for treatment, and many (91.0%) stated they did not participate in primary healthcare activities. The majority (95.0%) reported not being smokers, while 84.8% indicated they never consumed alcohol, and 8.1% drank once a month or less. According to the International Physical Activity Questionnaire classification, 62.2% were sedentary, and 26.1% were active. The mean score on the Intrinsic Religiosity Inventory was 43.7±14.1. The mean raw score on the Brazilian Older American Resources and Services Multidimensional Functional Assessment Questionnaire was 4.1±4.3 points. In terms of functional impairment, 33.4% were classified with mild impairment, 26.3% with severe impairment, and 25.4% with no impairment. Additionally, 64.5% reported experiencing falls in the year prior to the interview.
The PACIC findings indicate that patients rated the quality of care received as low, based on the instrument's total score (Table 1). Notably, the goal-setting/adaptation domain received the highest score, while the active participation of the patient in treatment domain had the lowest.
The regression models for each domain and the total score are summarized in Table 2. Only significant independent variables are included for each model.
Sociodemographic, clinical, and behavioral variables influenced the total PACIC score. Notably, higher age and more years of education were associated with lower scores. Specifically, for each additional year of age, the PACIC score decreased by 0.33%, and for each additional year of education the score declined by 0.74%. The effects of these variables on each domain are detailed in Table 2.
Table 1: Description of total score and five domains of the Patient Assessment of Chronic Illness Care applied to people diagnosed with type 2 diabetes in remote municipalities of Amazonas, Brazil between 2020 and 2022 (n=965)
| Domain | Mean score (± SD) (points) |
|---|---|
| 1. Active participation of the patient in treatment | 5.7±2.9 |
| 2. System of care model/model for practice | 6.9±3.3 |
| 3. Goal-setting/adaptation | 10.6±5.1 |
| 4. Problem-solving/context | 8.2±4.5 |
| 5. Follow-up/coordination | 9.9±3.9 |
| Total Patient Assessment of Chronic Illness Care score | 2.1±0.8 |
SD, standard deviation
Table 2: Estimates of the effect of independent variables associated with the scores of PACIC domains and total score
| Domain | Characteristic/effect | Variable | Estimate | Exp (estimate) | % |
|---|---|---|---|---|---|
| 1. Active participation of the patient in the treatment | Intercept | 2.0717 | 7.9380 | –¶ | |
| Age (years) | –0.0043 | 0.9957 | 0.43 | ||
| Years of education | –0.0099 | 0.9902 | 0.98 | ||
| Retirement | No† | 0.0000 | 1.0000 | ||
| Yes | 0.1185 | 1.1258 | 12.58 | ||
| BMI | –0.0072 | 0.9928 | 0.72 | ||
| Patient activity level | Level 1† | 0.0000 | 1.0000 | ||
| Level 3 | 0.1458 | 1.1569 | 15.69 | ||
| Participation in primary healthcare provider activities | No† | 0.0000 | 1.0000 | ||
| Yes | 0.3636 | 1.4385 | 43.85 | ||
| Falls | No† | 0.0000 | 1.0000 | ||
| Yes | –0.0746 | 0.9281 | 7.19 | ||
| 2. System of care model/model for practice | Intercept | 1.5016 | 4.4887 | –¶ | |
| Very poor | 0.0000 | 1.0000 | |||
| Self-perception of health | Poor | 0.1556 | 1.1684 | 16.84 | |
| Good | 0.2016 | 1.2233 | 22.33 | ||
| Very good† | 0.3323 | 1.3942 | 39.42 | ||
| Patient activity level | 0.0035 | 1.0035 | 0.35 | ||
| Need to travel for treatment | No† | 0.0000 | 1.0000 | ||
| Yes | 0.0836 | 1.0871 | 8.71 | ||
| Participation in primary healthcare provider activities | No | 0.0000 | 1.0000 | ||
| Yes† | 0.3625 | 1.4369 | 43.69 | ||
| 3. Goal-setting/adaptation | Intercept | 2.3448 | 10.4308 | –¶ | |
| Years of education | –0.0071 | 0.9929 | 0.71 | ||
| Duration of diabetes (years) | 0.0043 | 1.0043 | 0.43 | ||
| Number of diseases | –0.0208 | 0.9794 | 8.06 | ||
| Need to travel for treatment | No | 0.0000 | 1.0000 | ||
| Yes† | 0.0839 | 1.0875 | 8.75 | ||
| Participation in primary healthcare provider activities | No | 0.0000 | 1.0000 | ||
| Yes† | 0.3695 | 1.4470 | 44.70 | ||
| 4. Troubleshooting/context | Intercept | 2.2312 | 9.3107 | –¶ | |
| Age (years) | –0.0046 | 0.9954 | 0.46 | ||
| Years of education | –0.0094 | 0.9907 | 0.94 | ||
| Retirement | No | 0.0000 | 1.0000 | ||
| Yes† | 0.0830 | 1.0866 | 8.66 | ||
| Duration of diabetes (years) | 0.0065 | 1.0066 | 0.65 | ||
| Number of diseases | –0.0247 | 0.9756 | 2.40 | ||
| Hospitalization | No | 0.0000 | 1.0000 | ||
| Yes† | –0.0947 | 0.9096 | 9.04 | ||
| Level 1 | 0.0000 | 1.0000 | |||
| Patient activity level | Level 2 | 0.1213 | 1.1290 | 12.90 | |
| Level 3† | 0.1518 | 1.1639 | 16.39 | ||
| Need to travel for treatment | No | 0.0000 | 1.0000 | ||
| Yes† | 0.1263 | 1.1347 | 13.47 | ||
| Participation in primary healthcare provider activities | No | 0.0000 | 1.0000 | ||
| Yes† | 0.3772 | 1.4583 | 45.83 | ||
| 5. Follow-up/coordination | Intercept | 1.9596 | 7.0966 | –¶ | |
| Study time (years) | –0.0062 | 0.9938 | 0.62 | ||
| Duration of diabetes (years) | 0.0074 | 1.0075 | 0.75 | ||
| Chronic pain in past year | No | 0.0000 | 1.0000 | ||
| Yes† | 0.0719 | 1.0745 | 7.45 | ||
| Patient activity level | 0.0040 | 1.0040 | 0.4 | ||
| Need to travel for treatment | No | 0.0000 | 1.0000 | ||
| Yes† | 0.2499 | 1.2839 | 28.39 | ||
| Sedentary | 0.0000 | 1.0000 | |||
| International Physical Activity Questionnaire | Active† | 0.0834 | 1.0870 | 8.70 | |
| Very active | 0.1537 | 1.1661 | 16.61 | ||
| Total Patient Assessment of Chronic Illness Therapy score | Intercept | 0.7385 | 2.0927 | –¶ | |
| Age (years) | –0.0033 | 0.9967 | 0.33 | ||
| Study time (years) | –0.0074 | 0.9926 | 0.74 | ||
| Retirement | No | 0.0000 | 1.0000 | ||
| Yes† | 0.0680 | 1.0703 | 7.03 | ||
| Duration of diabetes (years) | 0.0055 | 1.0055 | 5.50 | ||
| Level 1 | 0.0000 | 1.0000 | |||
| Patient activity level | Level 2 | 0.0815 | 1.0849 | 8.49 | |
| Level 3† | 0.1296 | 1.1384 | 13.84 | ||
| Level 4† | 0.1033 | 1.1088 | 10.88 | ||
| Need to travel for treatment | No | 0.0000 | 1.0000 | ||
| Yes† | 0.0705 | 1.0730 | 7.30 | ||
| Participation in primary healthcare provider activities | No | 0.0000 | 1.0000 | ||
| Yes† | 0.3390 | 1.4035 | 40.35 |
† Reference category of the explanatory variables in the model.
¶ No percentages are associated with reference values for the model.
Exp (estimates), exponential of raw estimates.
Discussion
This study assessed primary healthcare providers' ability to serve adults with type 2 diabetes in remote municipalities of Amazonas from the perspective of service patients. It explored how sociodemographic, clinical, behavioral, and functional performance variables affect perceived level of chronic illness management, analyzing both the overall PACIC score and individual domain scores. The study found a mean PACIC score of 2.1±0.8 on a scale of 1 to 5 points, indicating that care provided by primary healthcare providers in remote municipalities of Amazonas was infrequent and inadequate, reflecting weakened support. Although this value is within the range reported by other Brazilian studies (1.55 to 2.92 points), it is closer to the lower end of this variation, which may indicate specific weaknesses in the Amazonian context8,29,30,36. Sociodemographic and structural differences between regions, as well as the exclusive focus on people with type 2 diabetes, may explain this result. Analyzing each domain of the PACIC questionnaire provides detailed insights into the factors affecting care quality. By examining the data from each domain, researchers can identify specific aspects of care that contributed to the low overall score, revealing unique factors that impact the quality of assistance provided.
Domain 1: Active participation of the patient in treatment
The first PACIC domain, which measures patient involvement in decision-making about their care, received the lowest score in this study, consistent with other research8,30,36. In the previous year, falls were a significant negative factor, with individuals who experienced falls scoring lower on this domain (Table 2). Falls can increase dependence and impact healthcare needs43. Conversely, participation in primary healthcare provider activities was associated with higher scores in this domain (Table 2). However, most participants did not engage in these activities, reflecting the domain's weakness. This lack of participation may be due to limited access to primary healthcare providers, often due to economic constraints or logistical challenges in the Amazon region, where many patients must travel long distances by river in small boats32.
Domain 2: System of care model/model for practice
The chronic care model emphasizes placing the patient at the center of health care, requiring professionals to help patients develop the skills and confidence to manage their health7,14. The second PACIC domain evaluates the support provided to patients and their satisfaction with the care organization. As shown in Table 1, this domain received the second lowest score, highlighting deficiencies in care organization. Participants felt that the healthcare team did not adequately promote organized care, which may have affected patient engagement, as reflected in the first domain's low score.
Although variables associated with this domain had positive effects on scores, the overall score remained low (Table 2). This could be due to low frequencies in items with high positive impact estimates. Silva et al stress that healthcare professionals need to transition from being mere prescribers to becoming active partners in patient care to improve service quality30.
Domain 3: Goal-setting/adaptation
The third PACIC domain, which assesses the adaptation of guidelines and goal setting for individual needs, received the highest score in this study. This contrasts with findings from other Brazilian studies8,29,30,36. Effective adaptation and goal-setting are crucial for user adherence to treatment, influenced by factors such as understanding, memory, education, and economic conditions44.
It appears contradictory that participants reported goals and adaptations while showing low engagement and dissatisfaction with the care organization. This suggests that patients might not fully recognize or value these measures. Regular monitoring is essential to track progress toward goals and address gaps45. Table 2 indicates that years of education and the number of diseases negatively impacted the score for this domain, while other variables had a positive effect. Although the need to travel for treatment had a significant positive effect on this domain's score, a large portion of participants reported this issue.
Domain 4: Problem-solving/context
The low scores in domains 1 and 2, despite reports that healthcare professionals set goals and adapt instructions, suggest these efforts may not be effectively enhancing care. This highlights a barrier to improving care quality.
The fourth domain, which addresses barriers in managing chronic conditions, received the third-highest score, indicating some weaknesses that need to be addressed. Factors such as age, years of education, number of diseases, and recent hospitalizations negatively impacted this domain’s score (Table 2). However, some variables positively influenced the score, and exploring these could help strengthen this component. Notably, a higher level of activity (level 3) had a significant positive effect on this domain, showing that greater awareness of one’s role in care can improve outcomes. Silva et al suggest that developing a collaborative care plan between professionals and patients can enhance problem-solving effectiveness30.
Domain 5: Follow-up/coordination
The fifth PACIC domain focuses on continuity of care, assessing whether patients receive adequate follow-up to manage their condition. In this study, this domain received the second-highest score, suggesting that participants perceive follow-up care as generally acceptable.
This finding aligns with results from the third domain, where participants reported that healthcare professionals effectively set and follow up on individual goals. However, despite these positive aspects, domains 1 and 2 indicate that these efforts have not significantly improved patients' understanding of their care or their involvement in decision-making. Studies suggest that low levels of education can hinder patients' comprehension of instructions, reducing their confidence in participating in care decisions46,47.
Total PACIC score
The study found that sociodemographic, clinical, and behavioral variables were linked to the total PACIC score (Table 2). Specifically, advancing age was associated with a lower PACIC score, as older individuals may engage less in self-management activities36, which could explain the low score observed in a Brazilian study with elderly participants in Belo Horizonte30. Additionally, greater years of education were associated with lower PACIC scores. Higher levels of education often lead to a more critical assessment of received care, due to increased access to health information48.
Conversely, participation in primary healthcare provider activities positively affected the PACIC score, indicating that user involvement in these activities improved the score. However, barriers such as accessibility issues may have limited user engagement, thereby reducing the overall impact of this variable on perceived type 2 diabetes management.
Strengths and limitations
Unlike previous Brazilian studies16,29,30,36, this research used a generalized linear model with a gamma distribution and a log-link function for regression analysis. This method enabled a detailed examination of how various independent variables influenced both the overall PACIC score and the scores for each of its five domains. This approach provided more profound insights into the factors contributing to weaker care provision. Additionally, the study benefited from a randomized, population-based sample and employed a translated and adapted Portuguese instrument, which improved response accuracy among patients with type 2 diabetes.
However, the study's cross-sectional design limited its ability to establish causal relationships between outcomes and independent variables. Furthermore, the inclusion of other chronic conditions in some comparative studies may have introduced discrepancies. The number of refusals and losses during data collection was not systematically documented, which restricts the ability to assess sampling losses. This aspect will be addressed in future studies with improved tracking procedures.
Conclusion
From the perspective of patients with type 2 diabetes, the perceived level of type 2 diabetes management (measured by the PACIC) of primary health care in the interior of Amazonas appears to be insufficient. Various sociodemographic, clinical, and behavioral factors were associated with PACIC scores. Specific associations were found between these factors and the scores of domains 3, 4, and 5. Domain 2 showed associations with specific clinical and behavioral variables, while domain 1 was associated with sociodemographic, clinical, behavioral, and functional performance factors.
Funding
Fundação de Amparo à Pesquisa do Amazonas (FAPEAM Universal 2018) and Coordenação de Aperfeiçoamento de Pessoal de Nível Superior (CAPES 001) supported this work.
Conflicts of interest
The authors have no conflict of interest.
Data availability
Data will be made available on request.
References
You might also be interested in:
2018 - Lack of Medical Resources and Public Health Vulnerability in Mongoliafs Winter Disasters
2012 - Oral health care during pregnancy: four aims may be too many
2007 - Core drivers of quality: a remote health example from Australia