




 download PDF
Introduction
Climate change is increasingly impacting human health around the world1. WHO has estimated an additional 250,000 deaths annually by 2030 due to climate-induced changes in the environment2. Compared to urban areas, climate change is disproportionately impacting rural communities, which have more outdoor workers, fewer cooling centers, healthcare workforce shortages, and longer transportation times to hospitals3,4. Furthermore, those living in rural areas are older and report poorer overall health5.
Despite the vulnerability of rural areas and the disproportionate climate risks they face, there is little research characterizing how rural communities are specifically impacted by climate change, how providers perceive climate-related health threats, or how prepared providers feel to address these risks with patients6,7. Consideration of rural contexts is rarely included in social and health science climate research, occurring in less than 5% of studies8. In the US, 16.6% of the population live in rural communities, and this gap limits our understanding of how climate change is affecting a substantial portion of the country9. Understanding their perspectives represents a currently unaddressed gap in the climate health literature.
Health professionals are in a unique position to both observe the health impacts of climate change and educate the public about these risks10. While trust in governmental institutions is declining in the US, healthcare providers, particularly in rural areas, remain trusted messengers of health information11,12. According to Piltch-Loeb et al, healthcare providers were considered trustworthy by more than twice as many Americans compared to those working in the public health sector, such as the US Centers for Disease Control and Prevention or local health departments13. Because they are trusted, providers may play a significant role in improving public awareness of climate-related health threats14. Providers can also help policymakers understand emerging climate-related health trends in their regions.
Although no identified studies have focused specifically on rural providers, there is a growing body of literature that examines healthcare providers’ climate-related knowledge, attitudes, and practices more broadly. Kotcher et al’s multinational survey of healthcare providers found that participants largely understood climate change as a significant cause of human harm15. However, time constraints, along with personal, professional, and social barriers, prevented many healthcare providers from engaging in climate change education with the public15. Multiple studies have found healthcare providers observed similar climate-related illnesses and conditions in their practices, including illness due to outdoor air quality, physical and mental harm from forest fires, and anxiety and depression15-18. However, none of this work examined how these issues manifest in rural settings, where climate impacts may be more visible and access to specialty care is more limited.
In this study, rural healthcare providers in the Northwestern US – Washington, Alaska, Idaho, Wyoming, and Montana – were surveyed to characterize their views on climate change and its impact on patient health. Focusing on rural clinicians in these states represents providers who are already experiencing substantial climate-related health risks15,19-21. This region offers a meaningful cross-section of rural practice environments where providers regularly encounter climate-related challenges. The survey examined how rural healthcare providers perceive the relevance of climate change to their clinical work and how prepared they feel to address these issues with patients. By focusing specifically on rural providers, an understudied group in the climate health literature, this work addresses a critical gap in understanding how frontline clinicians in rural communities are experiencing and responding to climate-related health impacts. Understanding these providers' perspectives is essential because provider perceptions influence how care is provided to community members. Research on health behavior change suggests that providers who perceive a health threat as relevant to their patients are more likely to screen for related conditions, counsel patients on risk reduction, and advocate for system-level preparedness. Conversely, providers who do not perceive climate change as clinically relevant are unlikely to integrate it into patient encounters, regardless of the evidence base. In rural communities where providers often serve as a primary source of health information, this gap between evidence and perception has direct implications for patient education, clinical decision-making, and community-level adaptation15.
Methods
The survey
A 38-question electronic survey (Supplementary material 1) was conducted to understand the varied drivers in rural physicians' interactions with health issues related to climate change. The survey questions cover demographics, practice characteristics, political ideology, perceptions on climate change and patient-level impacts, attitudes and behaviors in discussing climate-related health with patients, climate-conscious clinical knowledge and behaviors, and resource needs. Survey items were adapted from prior research that utilized questionnaires to investigate clinician beliefs about climate change16-18,22. Eight novel items were created to address gaps in the existing literature, including healthcare-sector emissions awareness, climate-informed advocacy, and differential perceived rural impacts of climate change. Novel items were pretested by two physicians for face validity and clarity prior to dissemination. Surveys were administered online by an encrypted invitation from Research Electronic Data Capture (https://www.project-redcap.org) with in-platform data aggregation and may have been completed in clinical settings or on personal time. Survey links were active from March to July 2025, with no results excluded due to the submission date.
Recruitment
The study included rural healthcare providers. In the US, physicians hold either a Doctor of Medicine (MD) or Doctor of Osteopathic Medicine (DO); both complete equivalent residency training and hold identical practice rights, though the latter programs additionally emphasize musculoskeletal manipulation. This study also included advanced practice providers, encompassing physician assistants and nurse practitioners (NP, or Doctor of Nursing Practice when doctorally prepared). Advanced practice providers are non-physician clinicians who hold prescribing authority and practice with varying degrees of physician oversight depending on state regulations.
To define ‘rural’ the Rural Urban Commuting Area (RUCA) code classification system was used. RUCA is a US federal taxonomy that classifies census tracts along a 1–10 gradient based on population density and commuting patterns, from major urban centers to the most isolated rural areas. Recruitment occurred in communities listed as RUCA code 4 or higher: having a population of 0–49,999 people (who commute primarily within their own community for necessities)9. All participants took the survey voluntarily without financial incentive or employer requirement.
Participants were recruited through of medical education partners of the University of Washington's Department of Rural Programs. The survey was originally intended to capture responses from rural providers across all five WWAMI states (Washington, Wyoming, Alaska, Montana, and Idaho) using the university’s network of contacts at teaching sites in each state. However, it was noted early in the recruitment process that other surveys were already being administered to the same provider networks in Idaho and Wyoming. To avoid survey fatigue and reduce the burden on those providers, providers were not actively recruited in those two states. As a result, the majority of responses came from Washington, Alaska, and Montana.
Clinical site administrators were contacted and sent the survey electronically; they were asked to distribute it to providers within their clinics and hospitals, to be taken at their leisure. Some physicians affiliated with rural programs were emailed directly and asked to share the survey within their organizations. Response deadlines of 2–3 weeks were included to increase participation. Surveys were sent to approximately 400 physicians, of which 115 completed the survey. Seven responses were excluded from the final analysis due to RUCA code classification discrepancies with their self-reported primary community of practice. Because surveys were distributed both directly and through clinical site administrators who shared them within their organizations, the exact number of providers who received the survey link cannot be determined. Furthermore, the total rural provider workforce across the study states is not precisely known; the University of Washington Center for Workforce Studies reports 22,056 practicing physicians in Washington, Montana, and Alaska, but this figure includes both rural and urban physicians20. Additionally, reliable data on the number of currently practicing physician assistants and nurse practitioners in rural areas was not available. As a result, a precise response rate cannot be calculated.
Variables
Independent variables were the provider’s location of practice (city and state), years since completing graduate education, gender identity, age, specialty, professional degree, and self-disclosed political leaning.
Dependent variables were Likert-scale agreement questions for a series of statements about belief in, concern for, and behaviors regarding climate change and its effects on patient health, as well as a list of potential climate-related health effects for which providers indicated the extent to which they perceived their patients to be impacted. Dependent variables were converted to an integer between 1 and 5 (5 being the most climate-conscious/concerned response). Respondents were also asked if they were interested in any of a list of resources that may help them to integrate climate change into their practice, of which they could select any number, or none, as well as use a write-in ‘other’ box.
Analysis
Responses that did not fit study criteria (n=7) were excluded. Descriptive statistics were calculated for the entire sample, as well as for specific demographic groups (gender, state, political leaning). Two compound metrics were created by aligning and averaging responses that indicated belief in or concern about climate change, and responses regarding noticed health impacts. Because the aggregated responses were on a scale of 1 to 5, the compound metrics are as well, with 1 being least concern/no effects noted, and 5 being the most concern/all effects noted. An ordinary least-squares regression model was run on the two compound metrics to assess internal validity, as there would be an expected positive correlation between noticing impacts of climate change and being concerned about the impacts of climate change. Analysis of variance (ANOVA) analyses of seven demographic characteristics against these metrics were used to analyze responses. A significance level alpha equal to 0.05 was used throughout, such that statistical significance was determined for analyses with a p-value less than 0.05. Graphical representations were made of responses to individual questions of interest. ANOVA analyses and graphical modeling are both useful for understanding how a variable, such as the compound belief or impact metric, varies between demographic groups within a single category. However, given the way that different demographic identities intersect to create a more complex, unique perspective in individuals, a model that can help to understand and visualize the relative effects of multiple confounding demographic factors on a person’s belief in and awareness of climate impacts was also desirable. To this end, a random forest model was created to assess the combined and confounding effects of the aforementioned seven demographics on the compound climate change concern metric. The random forest model sequentially reevaluates which demographic factor has the greatest influence on the outcome variable of interest within each subset of the dataset, allowing trends in the compound belief metric to be analyzed in the context of particular assortments of demographic groups, rather than taking each independent variable as an isolated factor. Because the aim of this random forest model was to explore significant contributing factors beyond political identity, it was excluded to prevent overshadowing other factors. Because of the way random forest models iterate, one strongly correlated variable will mask all others and collapse the majority of a tree’s complexity. When retained in the random forest model, political identity split the majority of nodes, and tree depth was so limited as to yield little to no information of use about the effects of other variables. Specialty was also excluded due to highly unbalanced representation across specialty groups, which would have produced unstable or misleading estimates, given the way random forest models use training data sets. Maximum depth was capped at 10, minimum split was 10, and the complexity parameter was set to 0.001. The model removes samples with incomplete data, leaving training set of N=81.
Ethics approval
All participants provided electronic, informed consent to voluntarily participate. Data were anonymized to protect confidentiality. Risks were minimal, limited to potential discomfort providing opinions on sensitive topics; thus, participants could skip questions. The University of Washington Institutional Review Board (IRB) deemed this study exempt under category 2 (IRB ID #[STUDY00021410]). These authors have no financial support or conflicts of interest.
Results
Participant characteristics
A total of 115 providers completed the survey, with seven responses being excluded due to misalignment with RUCA code exclusion criteria in self-reported city of practice. Of the remaining 108 providers, 79.2% of respondents were medical doctors (DO/MD), while the remaining 20.8% were advanced practice providers. Profession distribution varied significantly between states, with one in three Montana providers being advanced practice providers and nearly all Alaska providers being DOs/MDs (Appendix I, FigA1). A total of 82.0% of respondents were practicing family medicine providers, with the others reporting specialties including internal medicine, emergency medicine, and pediatrics (Appendix I, FigA2). Over 60% reported 10 or more years in practice, while less than 25% reported fewer than 5 years in practice. Providers self-identified across the political spectrum, with 31.5% liberal, 24.1% moderately liberal, 15.7% moderate, 12.0% moderately conservative, 5.6% conservative, and 11.1% preferring not to answer. A full demographic breakdown can be found in Table 1. A map showing the distribution of survey responses geographically can be found in the appendix (Appendix I, FigA3).
Table 1: Survey respondent demographics
| Characteristic | Variables | All states | AK | WA | MT |
|---|---|---|---|---|---|
| Gender | Male | 43 | 21 | 18 | 3 |
| Female |
62 |
22 | 21 | 19 | |
| Non-binary/self-described/prefer not to say |
3 |
2 | |||
| Age (years) | 20–29 | 1 | 1 | ||
| 30–45 |
54 |
18 | 26 | 10 | |
| 46–60 |
38 |
18 | 11 | 9 | |
| >60 |
15 |
9 | 2 | 3 | |
| Time in practice (years) | 0–5 | 24 | 5 | 16 | 2 |
| 5–10 |
16 |
9 | 4 | 3 | |
| 10–20 |
34 |
11 | 16 | 7 | |
| >20 |
34 |
20 | 3 | 10 | |
| Health profession | MD/DO | 84 | 44 | 26 | 13 |
| NP/DNP/PA |
22 |
1 | 12 | 8 | |
| No answer |
2 |
1 | 1 | ||
| Medical specialty | Family medicine | 82 | 33 | 33 | 14 |
| All other/no answer |
26 |
12 | 6 | 8 | |
| Total |
|
108 | 45 | 39 | 22 |
AK, Alaska. DNP, Doctor of Nursing Practice. DO, Doctor of Osteopathic Medicine. MD, Doctor of Medicine. MT, Montana. NP, nurse practitioner. PA, physician assistant. WA, Washington.
Beliefs about climate change and health
Nearly all respondents (95.4%) believe climate change is occurring, with only 1.8% disagreeing, and 2.8% being unsure. Most providers (82.4%) believe they have experienced the impacts of climate change within their communities. The majority of respondents agreed or strongly agreed both that climate change currently impacts their patients' health (65.7%) and will continue to impact their patients’ health in the future (83.4%). While these trends were broadly consistent between states, there were notable variations in the distribution of these beliefs between states (Fig1).
The majority of providers (56.1%) believed that health impacts of climate change should be considered in the shared decision-making process, and over half (54.6%) agreed that the healthcare sector is a significant contributor to CO2 emissions. However, 40.7% were neutral on whether providers should have an active role in addressing climate change with their patients, with 30.6% disagreeing, and only 28.7% agreeing. Only 28.7% of respondents agreed/strongly agreed that they were comfortable counseling patients on health impacts of climate change, and less than 11% reported ‘often’ discussing the effects of climate change on their patients’ health.
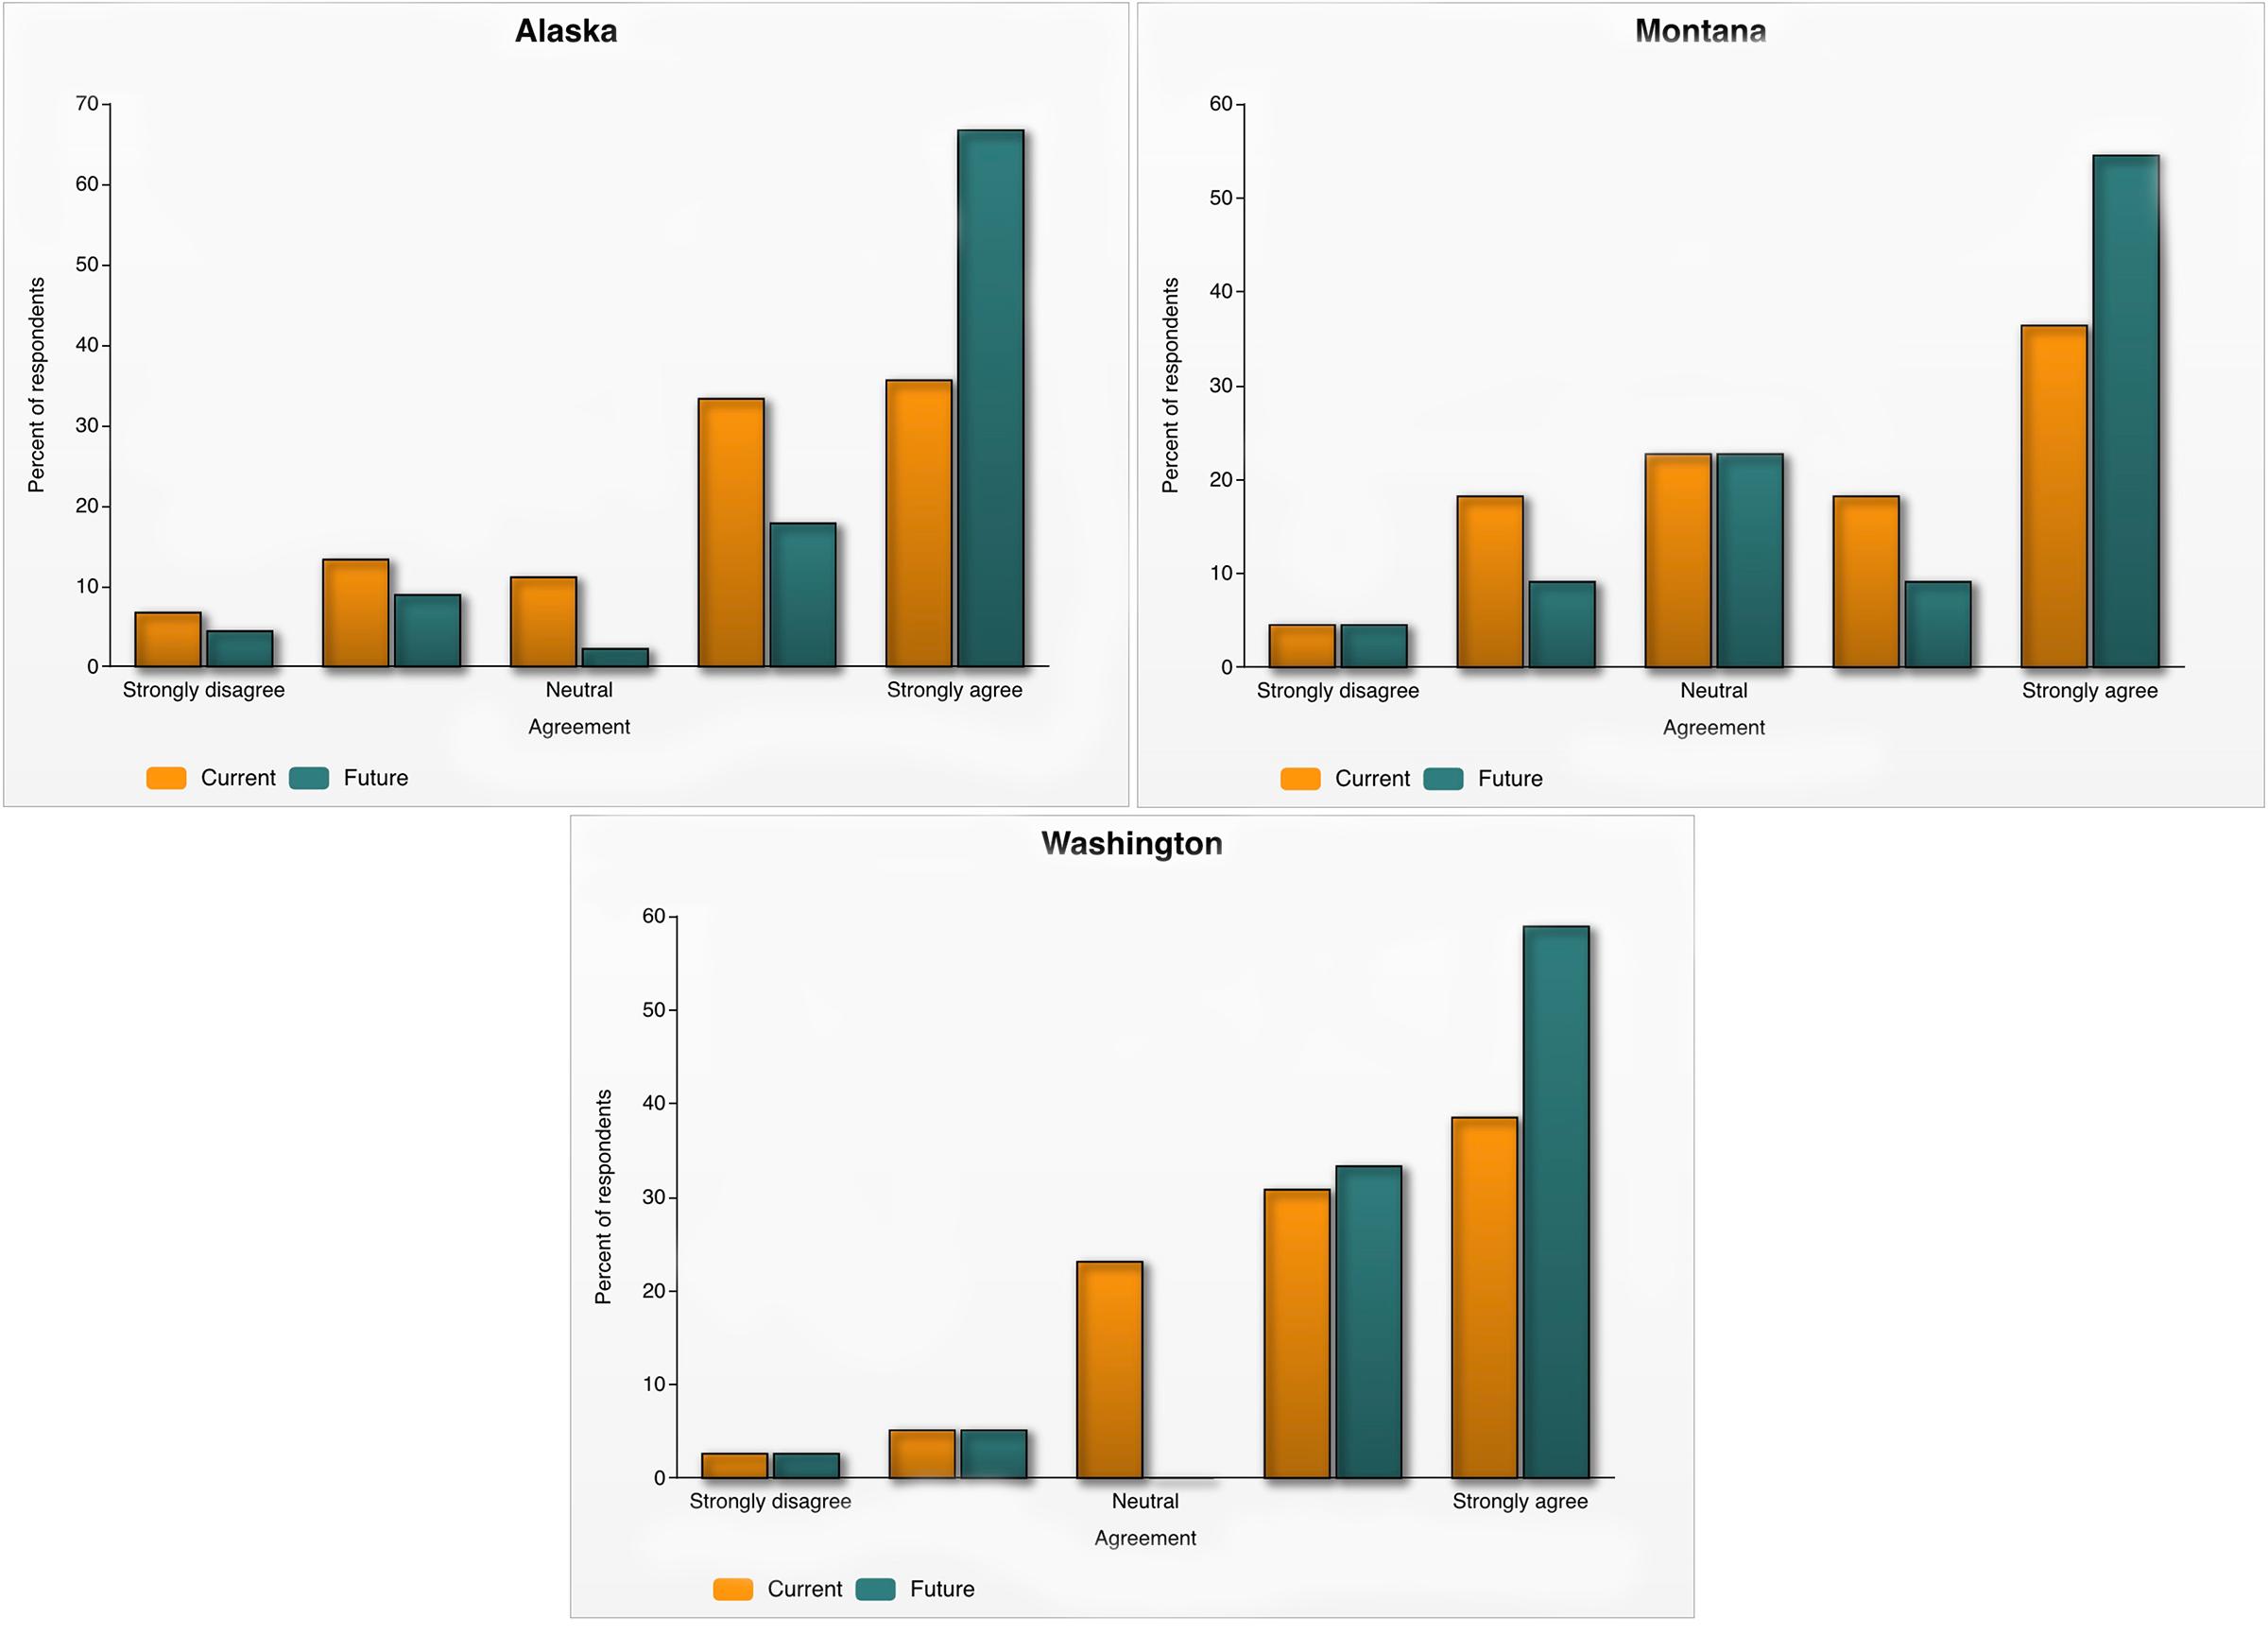 Figure 1: Provider agreement with the statement that climate change currently affects patient health, and/or will in the future, by state (Alaska n= 45, Montana n=22, Washington n=39).
Awareness of climate change effects
Questions accessing provider opinions on specific patient-level impacts of climate change were accessed on a 1–5 scale, with 5 signifying that the provider believes patients in their community are ‘strongly impacted’ by the climate-related health event. Of all proposed impacts, the largest portion of providers felt strongly that patients were impacted by respiratory issues due to air quality (43.5%), followed closely by allergies (42.1%), environmental climate-related injuries (37.0%), and mental health concerns (37.0%) (Fig2). Alaskan providers were less likely than average to report patients being strongly impacted by air quality (28.9%), allergies (35.6%), and mental health concerns (28.9%). They were more likely than average to report patients being strongly impacted by food supply/quality (35.6%) and access to health care (26.7%). Washingtonian providers were more likely than average to report patients being strongly impacted by almost every climate-related health impact, with the exception of geographically new diseases and access to health care. Montana providers were less likely than average to report patients being strongly impacted by almost every climate-related health impact, with the exception of environmental injuries and mental health concerns.
The aggregate measure of what climate-related impacts providers have noticed was not significantly correlated to the provider’s state of employment. On ANOVA analysis, there was only slightly more variation in noticed impacts between states than within, failing to show a statistically significant effect (F(4, 103)=1.519, p=0.202) (Appendix I, FigA4).
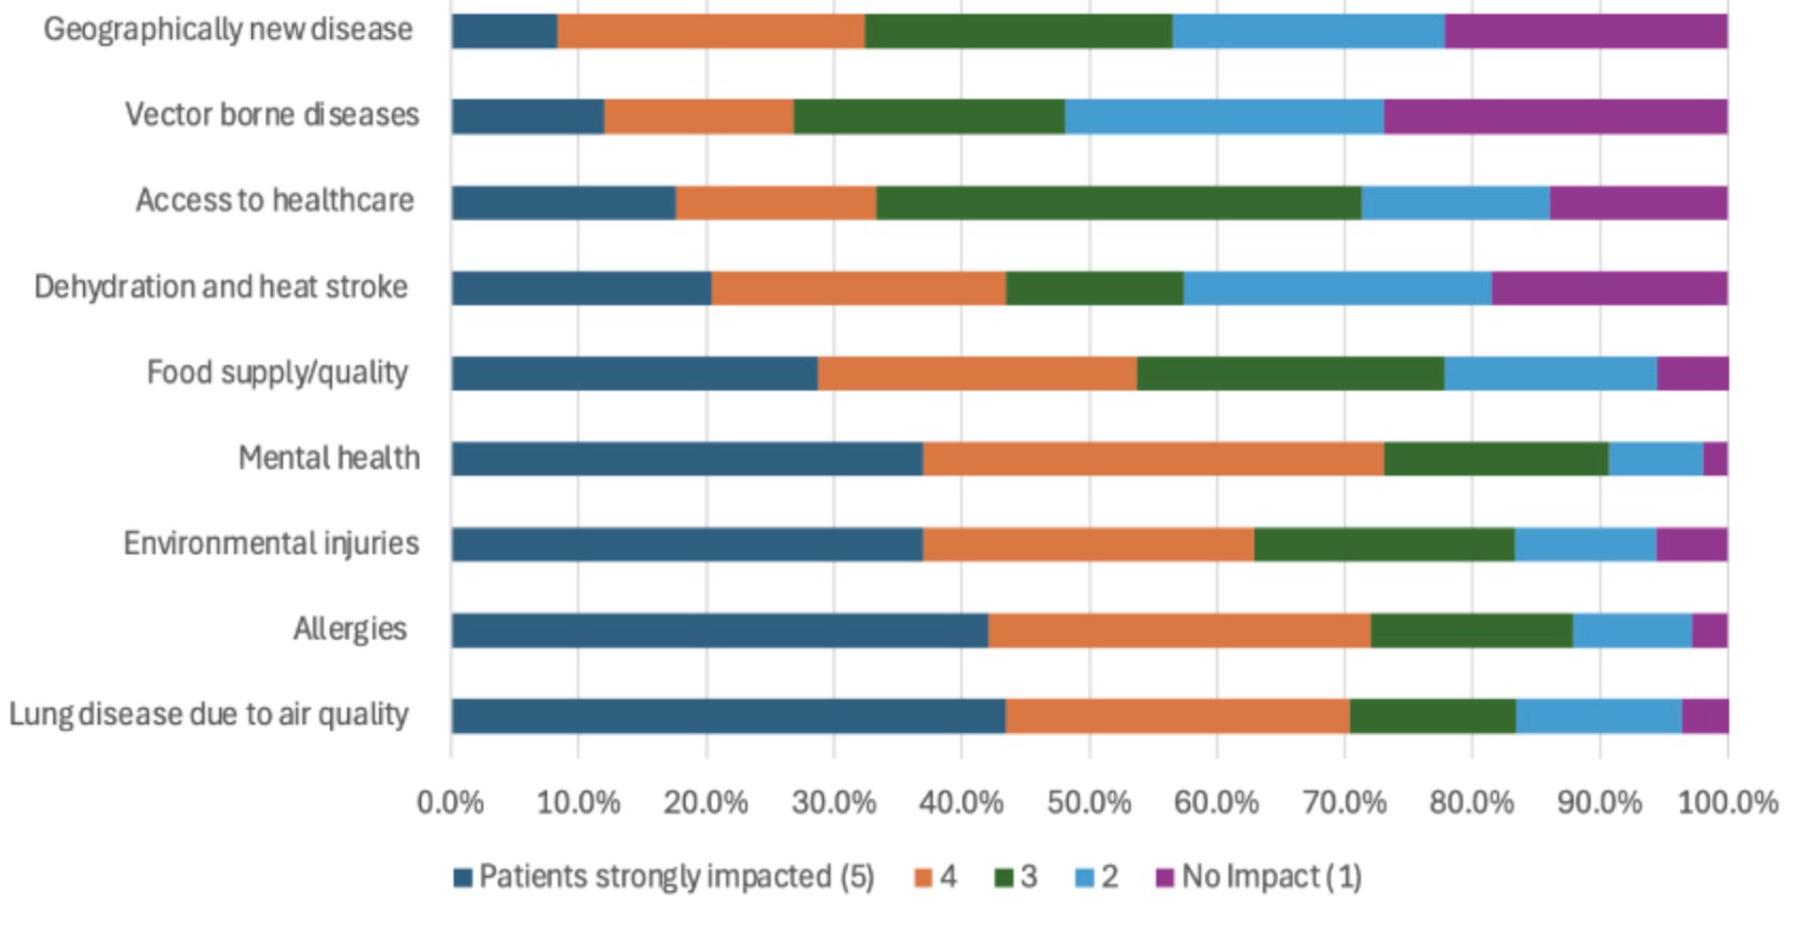 Figure 2: Strength of the impact of various climate factors on patient health according to providers (‘strongly impacted’ at left to ‘no impact’ at right).
Factors affecting climate-related beliefs
There is a significant correlation between how many impacts of climate change on patient health in their communities that providers reported (aggregated, normalized, and averaged), and the aggregated climate change concern metric. Variation in the noticing of climate-related impacts explained more than 26% of the variation in the aggregated climate concern metric between providers, suggesting an internal validity between question sets (Fig3).
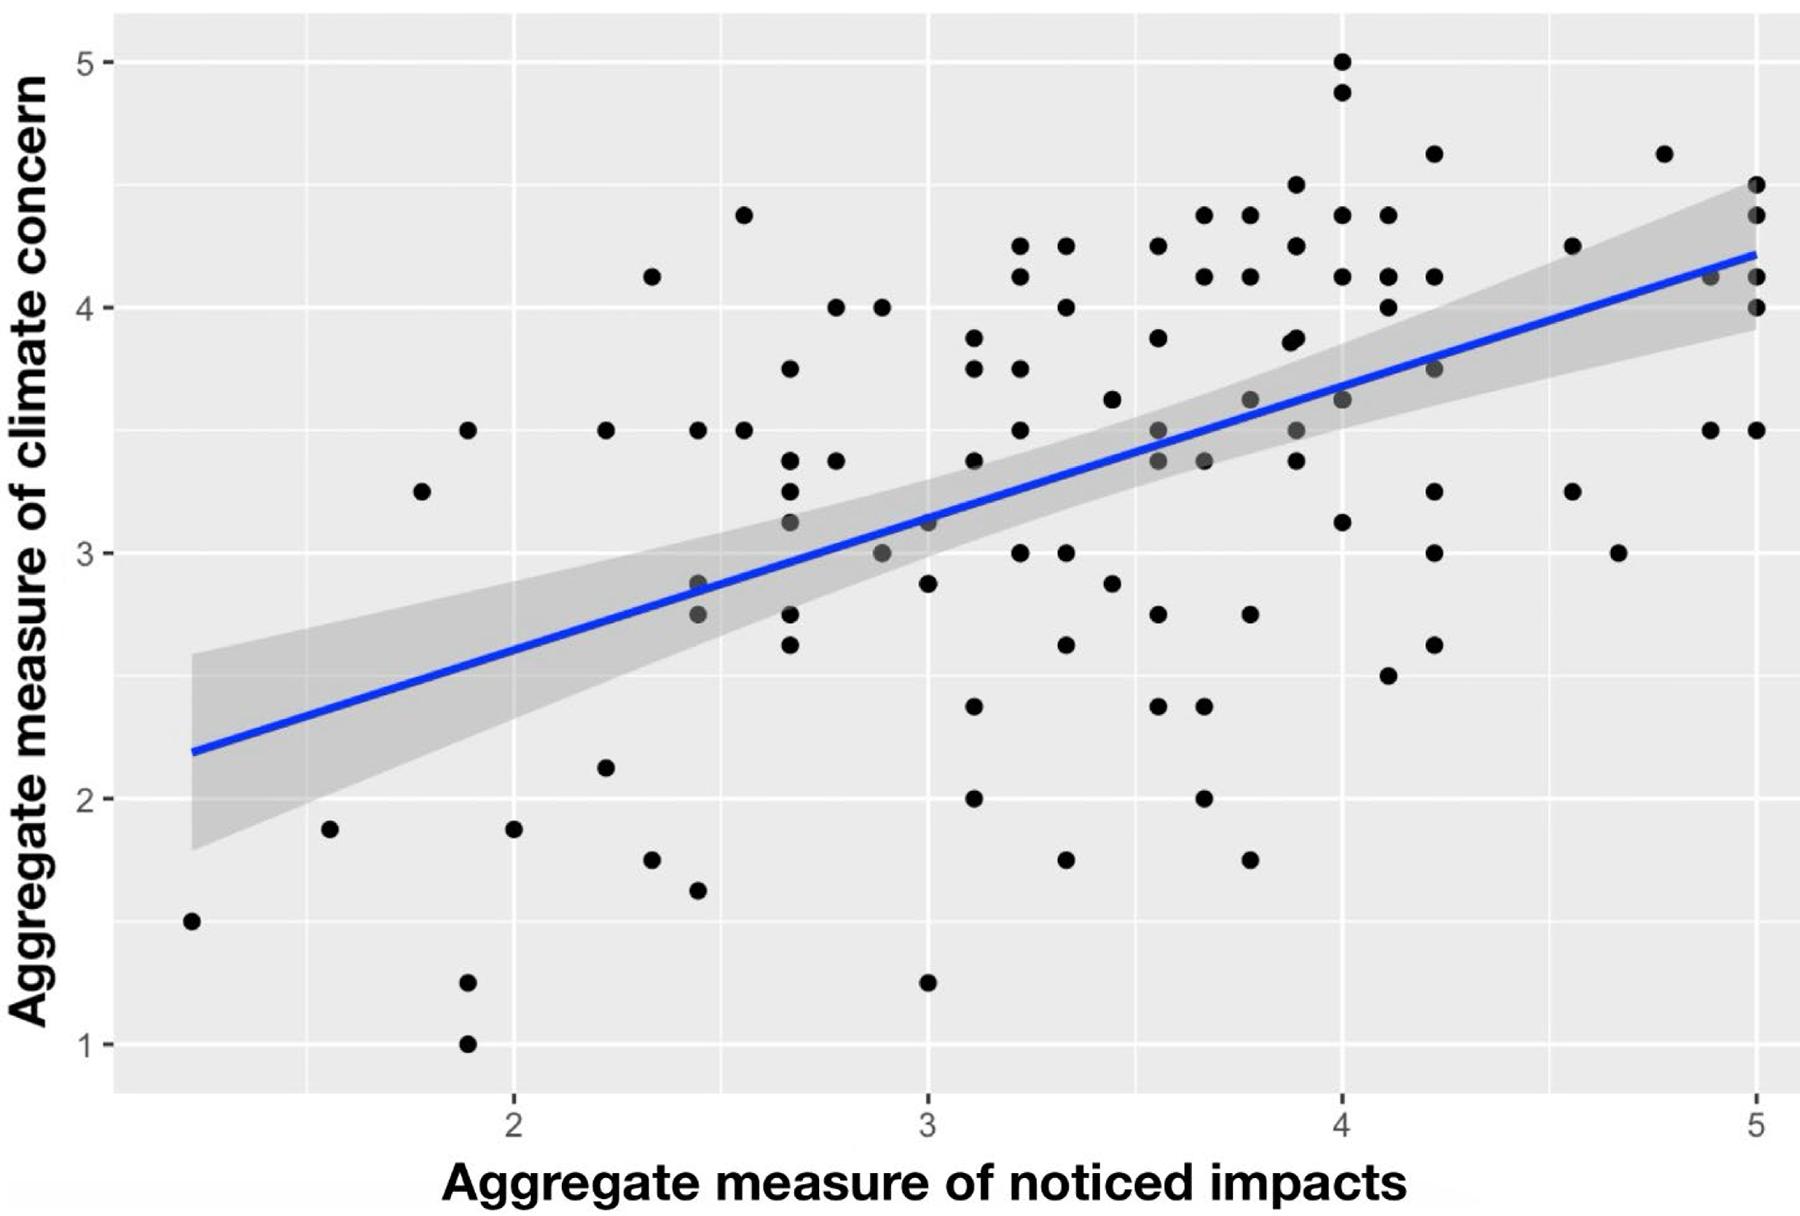 Figure 3: Ordinary least-squares regression model of relationship between aggregated climate awareness and aggregated climate concern among providers. Multiple R2=0.2671, adjusted R2=0.2602.
Correlations between the aggregated climate change concern metric and various demographic factors of responding providers were analyzed through ANOVA analyses (Table 2) and visualized using box-and-whisker plots (Appendix I, FigA5). Gender, age group, state of practice, and length of tenure were all statistically insignificant in explaining variation in climate concern. Professional degrees were significantly explanatory, with longer degree programs being correlated with higher climate change concern (Appendix I, FigA6). There was more than six times the variation in concern about climate change between educational groups than within. Specialty was also significantly correlated to belief metrics in the ANOVA analysis, but low n values for most specialties reduced statistical power (Appendix I, FigA7). Finally, no demographic categories explained a significant amount of variation in the combined noticed impacts metric.
Table 2: F-statistics for all evaluated demographic factors against aggregated notice and belief metrics
| State | Gender | Age | Tenure | Profession | Specialty | Political ID | |
|---|---|---|---|---|---|---|---|
| Average notice F-statistic | 1.52 | 0.68 | 1.52 | 2.07 | 1.17 | 2.02 | 1.99 |
| Average belief F-statistic | 0.95 | 0.53 | 1.92 | 0.59 | 6.37* | 3.01* | 13.93* |
* Statistically significant corollaries, p<0.05
Most significantly, self-identified political affiliation was highly correlated to aggregated climate change concern, with liberalism correlated to the highest levels of belief in climate change’s connection to health care (Fig4). Political affiliation showed 13 times the variation in climate concern between the groups than within them.
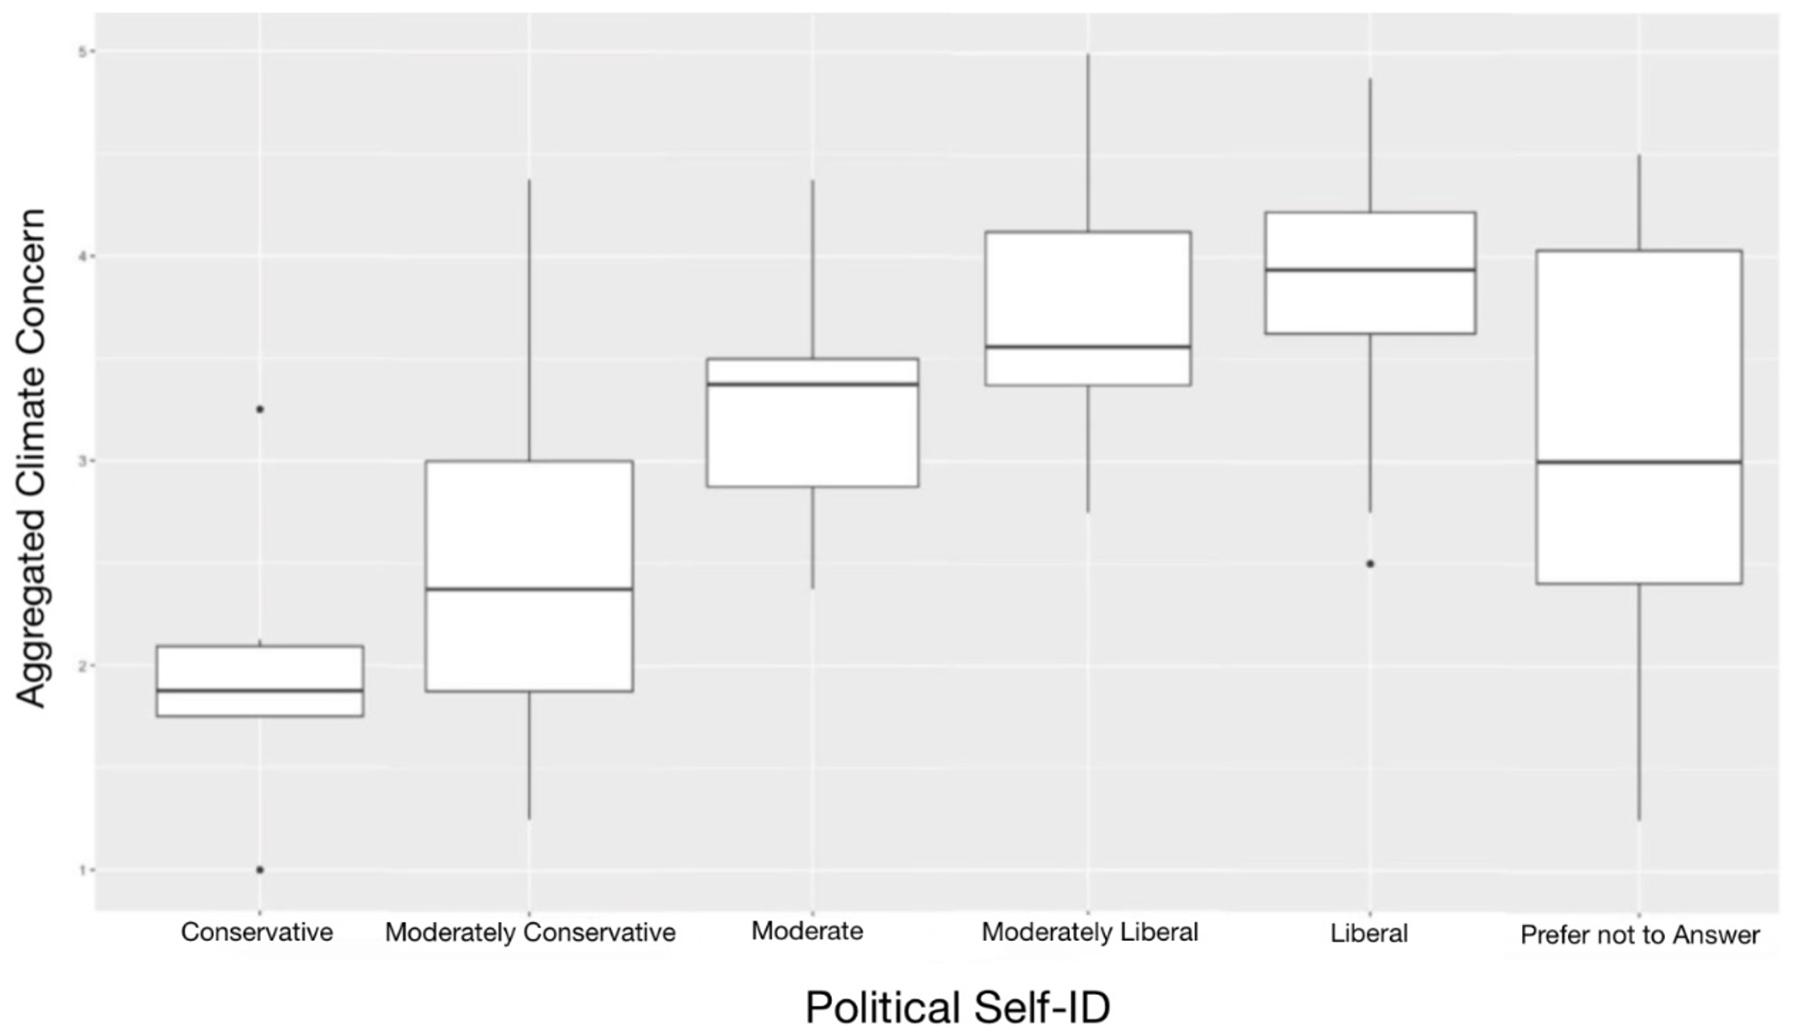 Figure 4: Aggregated climate concern metric against self-identified political affiliation (F(5, 102)=13.93, p<0.001).
The decision tree for the aggregated climate concern metric showed that climate concern was highest among younger, female Alaskan providers with longer tenure, and lowest among female providers over the age of 60 years (Fig5). Within providers aged less than 60 years, males had lower climate concern on average. Among males aged 60 or less years, shorter tenure was related to greater climate concern, whereas among females of the same age group longer tenure was related to greater climate concern. Alaska providers generally showed higher climate concern, and Washingtonian providers generally showed less.
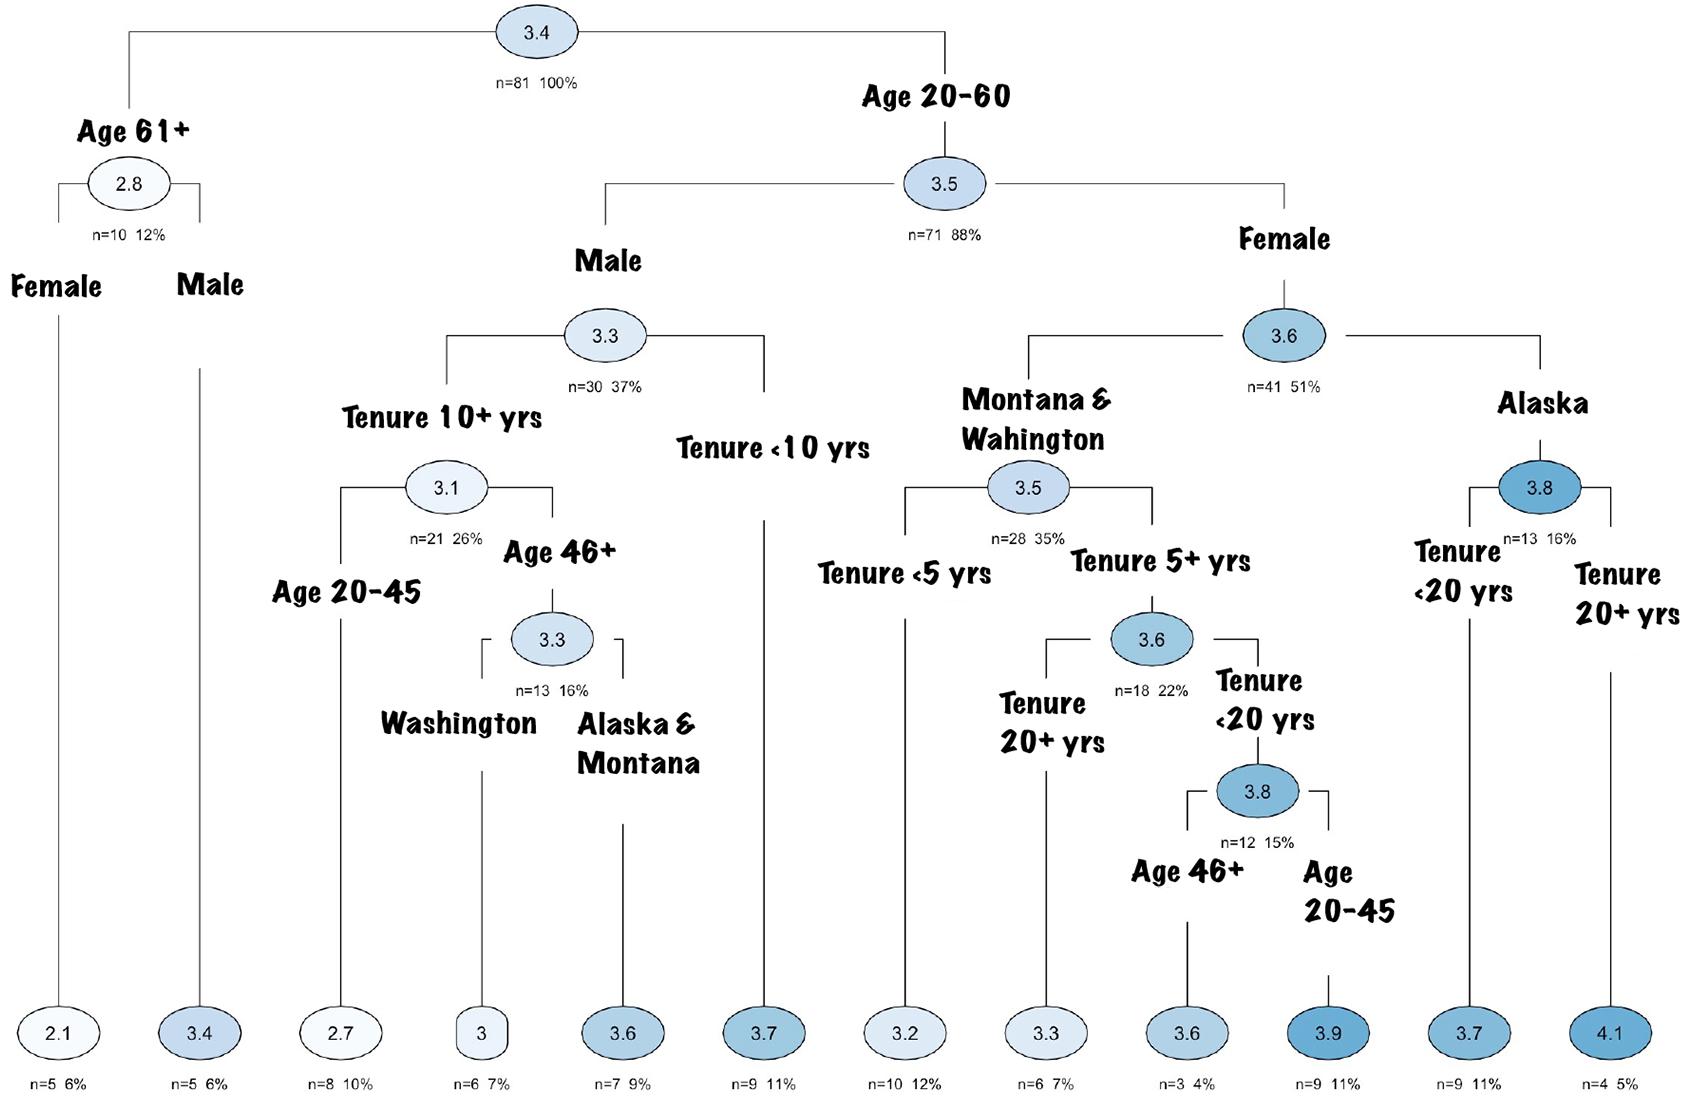 Figure 5: Random forest model decision tree for aggregated climate concern metric using demographic variables. Characteristic of splitting shown at the node, average belief of that subset in shaded oval, and size of group shown as N=x. Tree is read by starting at the top and reading down each branch, with each split being a significant clustering of respondents. Therefore, nodes further down the tree are groups within those shown above.
Reported limitations and desired resources
Providers endorsed several limitations to their ability to incorporate climate change into their practice. Most providers (69.4%) indicated that limited time during encounters was a barrier. Similar pluralities of providers indicated that low patient interest (44.4%) and worries of impacting patient relationships (43.5%) prevented them from engaging in more frequent discussions related to climate change. Finally, 32.4% of providers noted that a lack of personal knowledge was inhibiting them from discussing climate change with patients.
When supplied with a list of possible resources and asked which, if any, would be helpful to them, the majority of providers indicated a desire for at least one. The most requested (57.4%) resource was patient education materials preprinted and available to hand out at the point of care. Similar levels of interest existed for continuing medical education on climate change and health (55.6%), as well as guidance on how to make the workplace more sustainable (54.6%). Many providers (47.2%) indicated interest in having policy statements provided by their professional associations (47.2%), and 13.9% of respondents selected ‘other resources,’ some of whom left a free response suggestion or comment. One such response was ‘broader advocacy and reforms to make health care less of a driver of climate change – as one individual in an enormous system it's hard to feel like I have much agency on this subject.’ Another respondent stated simply ‘specific recommendations for practical … things that can be done.’
Discussion
Most surveyed providers believed that climate change is occurring and that it is affecting, or will affect, their patients’ health. However, relatively few integrated a climate change lens into patient care at the time of data collection. Healthcare providers’ willingness to engage in climate change awareness and preparation is critical for community-level resilience in rural communities in the Northwestern US. Analysis of survey responses identified three barriers to provider engagement with and advocacy for a climate-conscious approach to clinical practice: low general awareness of local climate change, poor understanding of climate’s effect on regional health outcomes, and a lack of confidence to act on that understanding when present. By addressing each of these barriers individually, a more broadly effective system can be developed.
The first two barriers to rural provider engagement in climate change – low general awareness of local climate change and poor understanding of its effect on regional health outcomes – are most directly addressable through education. Roughly one in six providers did not recognize climate change effects within their own communities despite believing in climate change broadly, and another one in six were aware of local climate impacts but did not connect them to patient health outcomes. Both gaps point to a need for continuing education and locally relevant clinical materials that explicitly link regional environmental changes to specific health outcomes23. However, survey respondents were broadly interested in receiving additional education and training on how to address climate change in their practice. Models such as the Climate Change and Human Health ECHO telementoring program, which demonstrated significant improvements in climate health knowledge, confidence, and communication skills among an interprofessional group of providers, offer a scalable format well suited to rural practice settings24.
Finally, the largest share (one in three) of providers reported that they did not address climate change in their clinical practice, despite being aware of its current impact on their patients' health. The barriers they cited – limited time, perceived low patient interest, and worries about damaging provider–patient relationships – are structural and relational in nature. They are also consistent with findings from prior studies15-18,25. In the most extensive physician climate study to date, Kotcher et al similarly found that limited time, along with personal and societal constraints, significantly hindered engagement in climate-related clinical care15. Because these barriers are not knowledge deficits, education alone is unlikely to be sufficient. Addressing them will require organizational responses, such as integrating climate-related health considerations into existing clinical workflows, quality improvement initiatives, and institutional emergency planning that normalize climate-responsive care rather than relying on individual provider initiative26. Past climate research suggests that when institutions provide policy backing and practical resources, providers are more willing to incorporate climate considerations into care and shared decision-making8,10,15,17,18,25.
The observable health impacts of climate change noted by a plurality of surveyed providers were respiratory illnesses related to poor air quality, allergies, environmental injuries, and mental health concerns. This pattern was consistent among respondents in Washington, Alaska, and Montana, suggesting that, despite geographic diversity, rural providers are observing similar climate-related health challenges. These observable health impacts also follow patterns seen in previous provider studies15-18. Less commonly noted health impacts varied regionally, though more research needs to be done to validate these findings and understand how these climate-related health impacts evolve over time and distance.
A sizable minority of providers surveyed reported their political leanings as conservative (6.7%) or moderately conservative (12.0%). This is significant, as self-identified political affiliation was the strongest predictor of aggregated climate concern, with conservative providers reporting lower health impact concerns related to climate change. These findings mirror broader US data showing that climate belief systems and trust in climate science are structured along partisan lines, including among highly educated groups such as health professionals27,28. Notably, political affiliation predicted climate concern (F(5, 102)=13.93, p<0.001) about seven times more strongly than it predicted noticing climate-related health impacts (F(5, 102)=1.991, p=0.0862). In this light, it appears that political affiliation played a far greater role in shaping how providers conceptualized climate change as a health issue than in shaping what they actually reported observing in their patients. This distinction has important implications for how climate-health engagement is approached in politically diverse rural settings. Efforts that lead with shared clinical observations and the practical management of specific exposures such as wildfire smoke, heat, or vector-borne illness may find traction where framings built around climate change as an ideological or global narrative would not. In this sense, the finding is less a barrier to overcome than a signal about where productive common ground may lie.
Prior studies have established a consistent relationship between level of educational attainment and belief in climate change, as well as degree of concern and sense of responsibility29,30. This relationship has been shown to hold true between levels of postgraduate education broadly, though no reviewed literature established the relationship among medical professional degrees specifically31. The strong relationship between profession and aggregated climate concern seen in the study population suggests that this relationship holds true among medical providers. Due to rural areas having a higher and growing proportion of advanced practice providers, this finding is particularly relevant32.
Strengths and limitations
Methodological strengths include electronic data collection and anonymous, encrypted survey administration, enabling a multi-state geographic reach with regional comparisons, and a greater likelihood of sincere responses without conformation or social desirability biases. The short collection window enhances comparability of responses as it limits the amount of outside influence that may have changed provider opinion over the course of the study. Most questions appeared on a single page, allowing answer changes, with two questions being shown on a separate page, to reduce reflexive bias. Before dispersal, the survey was reviewed by a former rural family medicine physician and the University of Washington School of Medicine Dean of Rural Programs, whose readability feedback was implemented.
Limitations include self-selection and non-response biases, since providers with strong views surrounding climate change may be more inclined to participate or abstain. The minimal number of open-response questions may limit nuance and depth. In addition, because the total number of providers who received the survey cannot be determined and the size of the rural provider workforce in the study states is unknown, a response rate cannot be calculated. Without a known denominator, the representativeness of the sample relative to the broader rural provider population cannot be assessed, and non-response bias remains possible. Recruiting through academically affiliated clinics may overrepresent a population of providers more aware of current research; however many of the providers surveyed had no direct affiliation to an academic institution. Given the statistical significance of political affiliation in the analysis, the skewed nature of the sample population towards liberal self-identification is a limitation to statistical interpretation. Consideration of providers’ surroundings may affect their interpretation of and response to questions. Additionally, grouping MDs and DOs could shroud professional differences. It is possible that regional differences in survey responses could be reflecting differences in beliefs between provider types, as provider-type ratios vary between regions. Survey questions were not formally internally validated prior to survey distribution. The questions not drawn from previous related research were validated for clarity and rationality by two physicians; however, no formal statistical validity testing was performed on these items.
Conclusion
Providers’ willingness to engage in climate change awareness and preparation is critical for community-level resilience in rural communities. Our findings suggest that provider engagement drops off at three points: recognizing local climate impacts, understanding associated health risks, and feeling confident addressing these issues in practice. Targeted education, clear clinical tools, and institutional backing may help bridge these gaps and normalize climate-responsive care. Broader studies across rural healthcare systems are needed to confirm these findings and guide the development of effective, scalable interventions.
Funding
This research received no specific grant from any funding agency in the public, commercial, or not-for-profit sectors.
Conflicts of interest
The authors declare no conflicts of interest, financial, personal, or otherwise.
AI disclosure statement
The authors declare that no generative AI technologies were used in any aspect of the research performed or the manuscript produced.
References
appendix I:
Appendix I
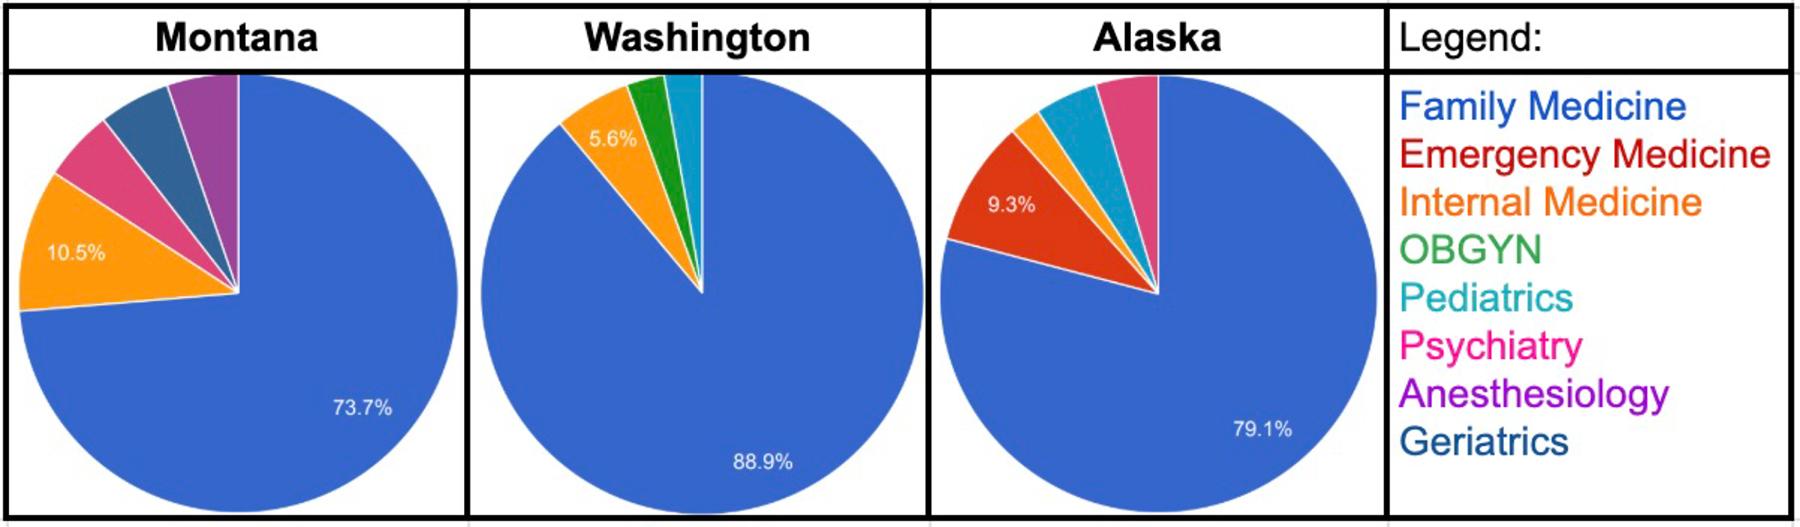
Figure A1: Profession breakdown by state, not including non-responses (N=106).
Figure A2: Specialty breakdown by state, not including non-responses (N=100).
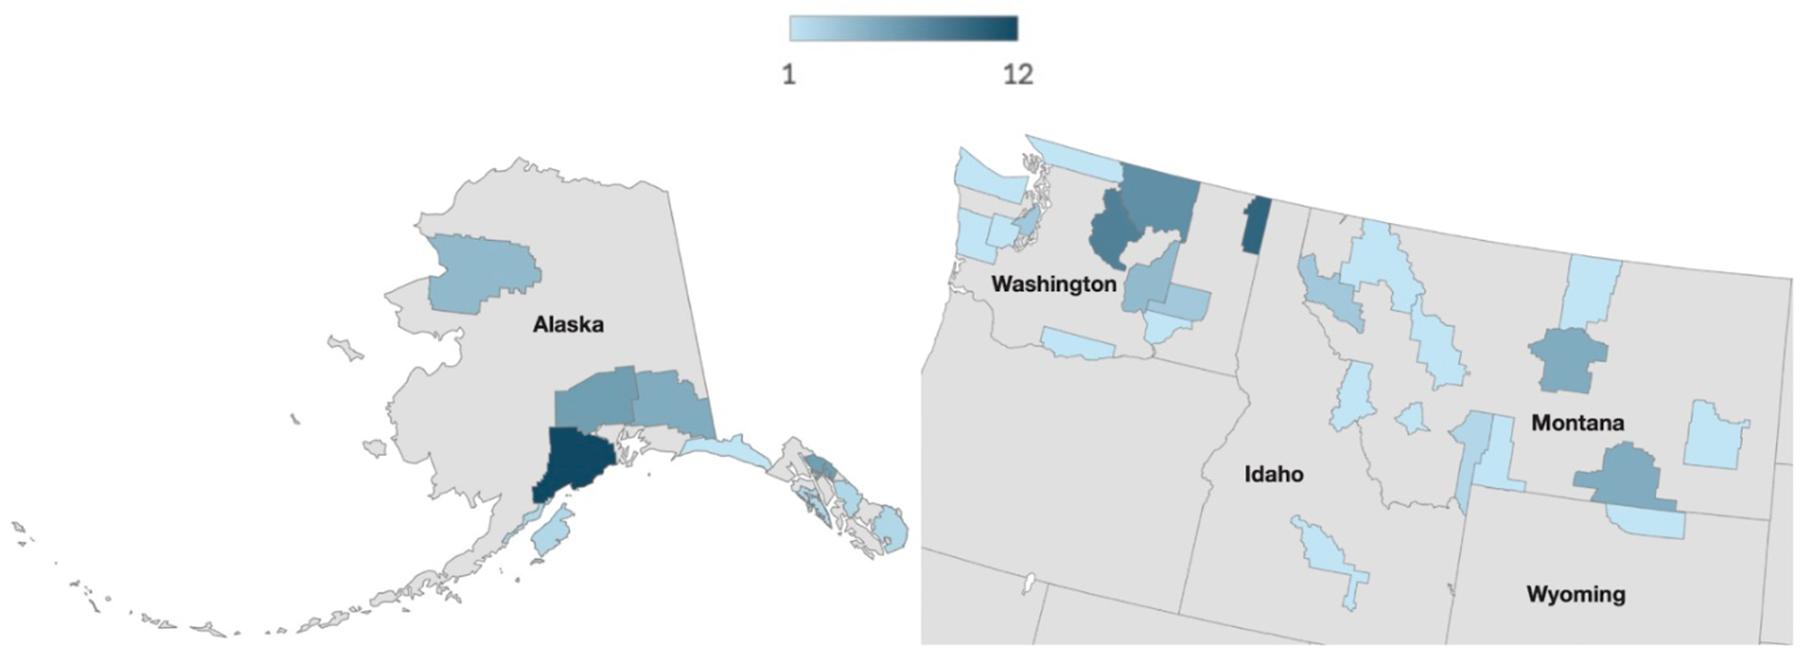
Figure A3: Heat map of survey responses per county/boroughs of reported primary employment, with US state names labeled, and the State of Alaska represented non-geographically for ease of presentation.
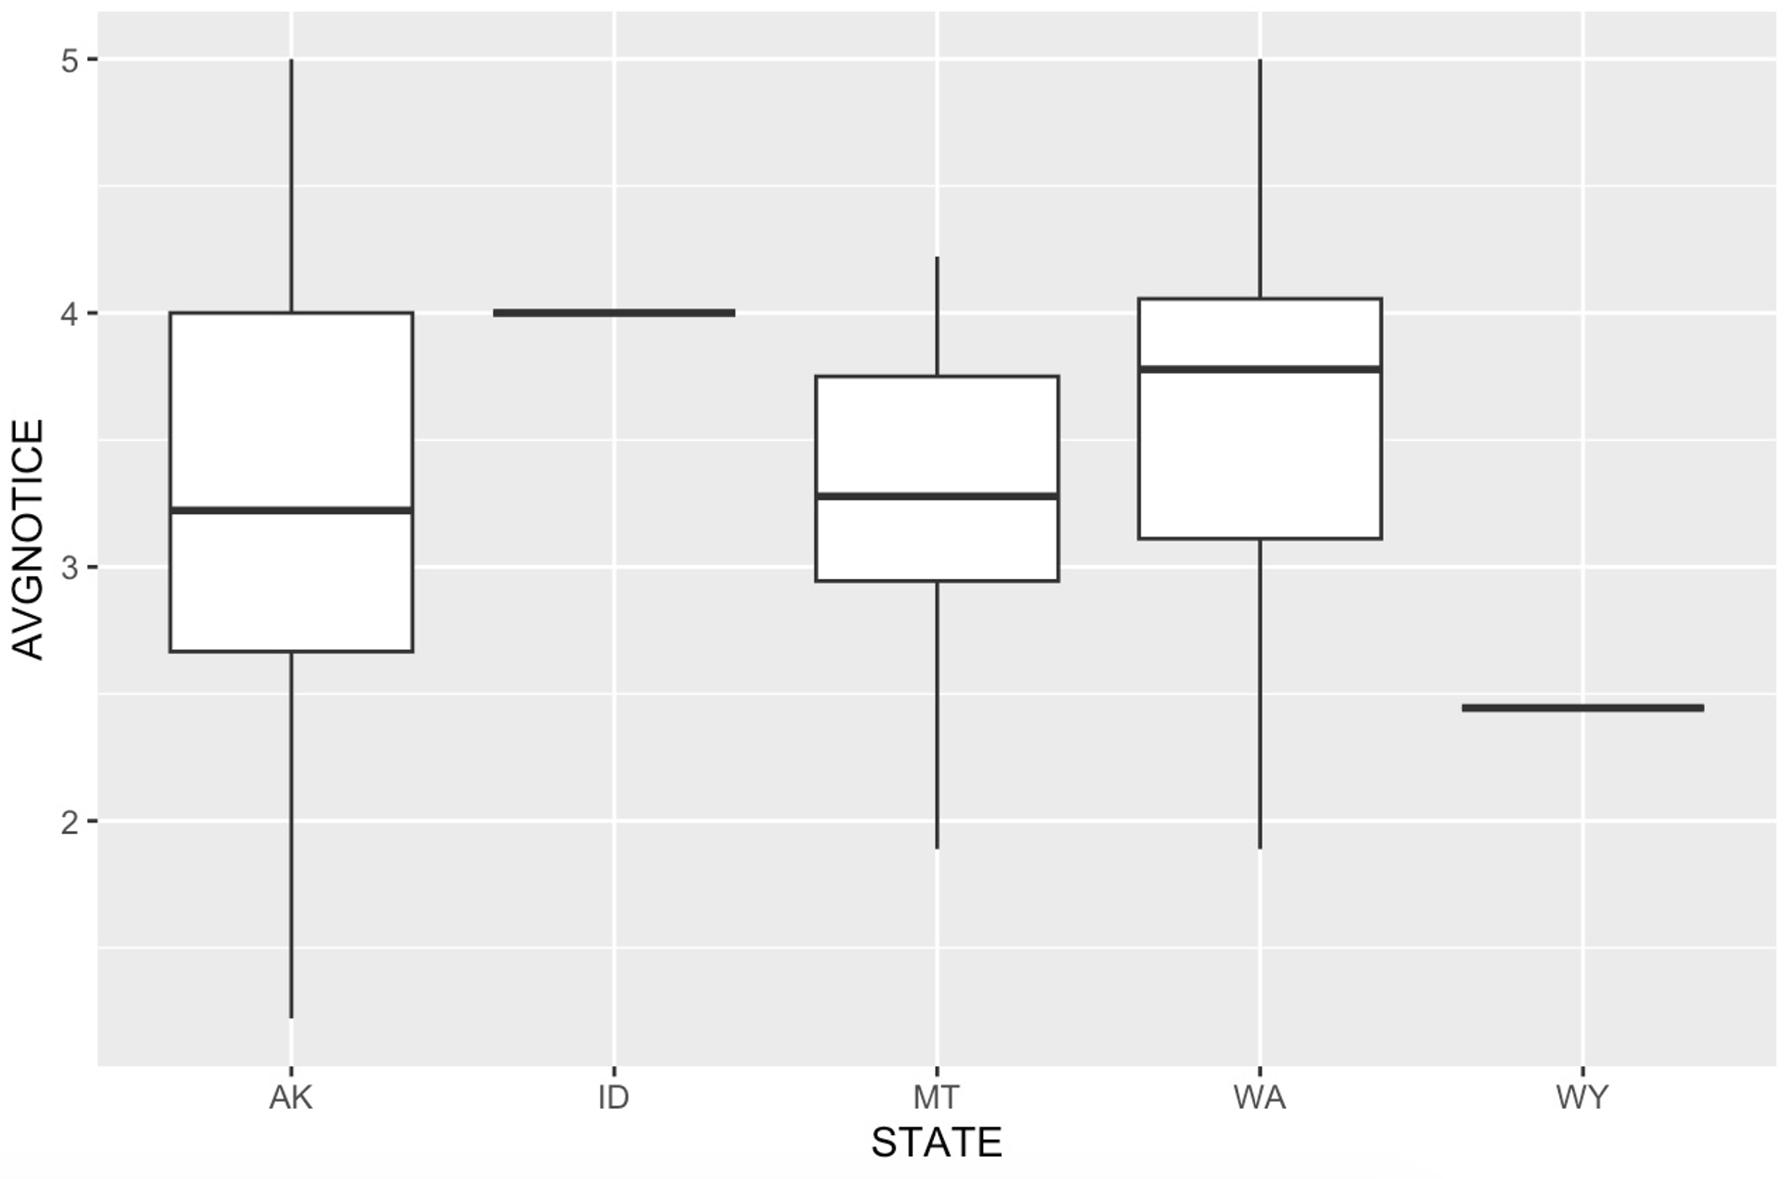
Figure A4: Aggregated climate effects noticed (AVGNOTICE) by state (F(4, 103)=1.519, p=0.202). (AK, Alaska. ID, Idaho. MT, Montana. WA, Washington. WY, Wyoming.)
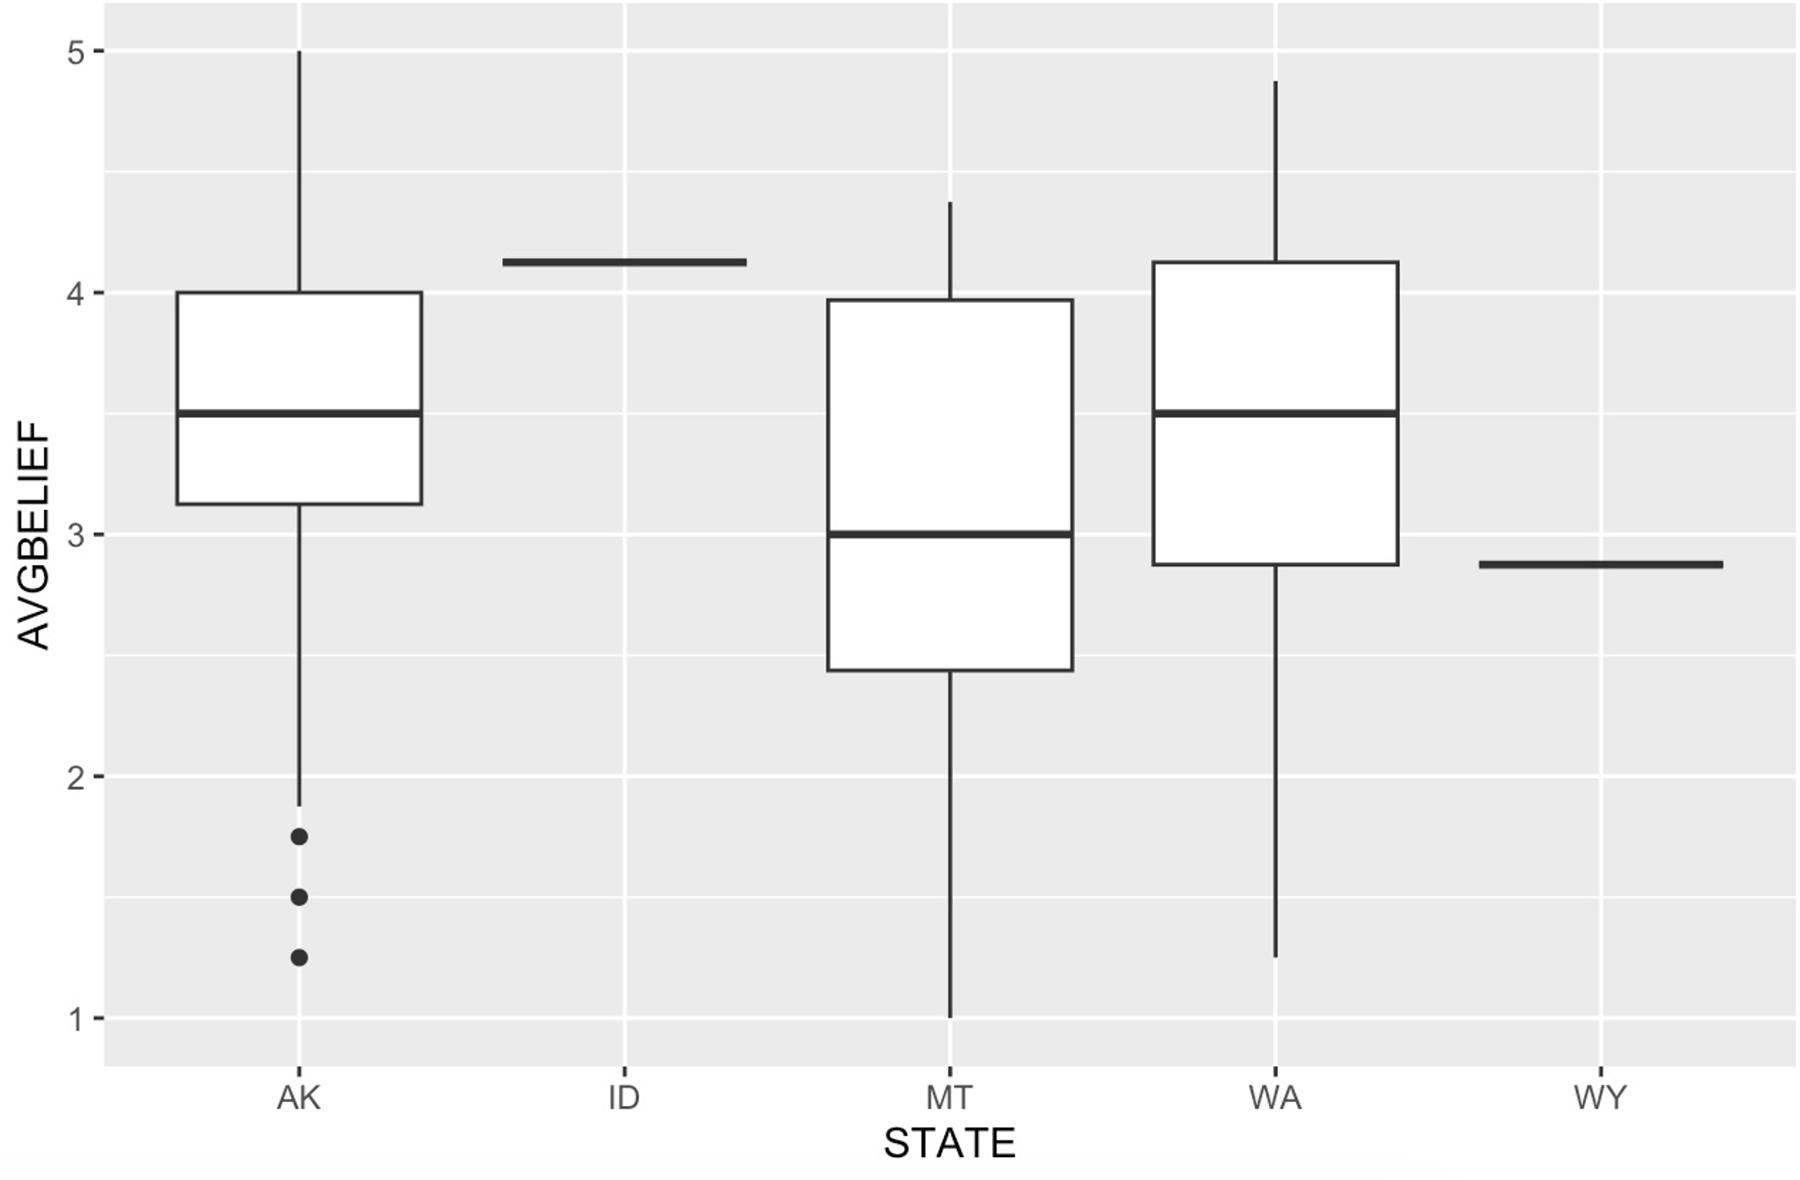
Figure A5: Aggregated climate concern metric (AVGBELIEF) by state (F(4, 103)=0.954, p=0.436). (AK, Alaska. ID, Idaho. MT, Montana. WA, Washington. WY, Wyoming.)
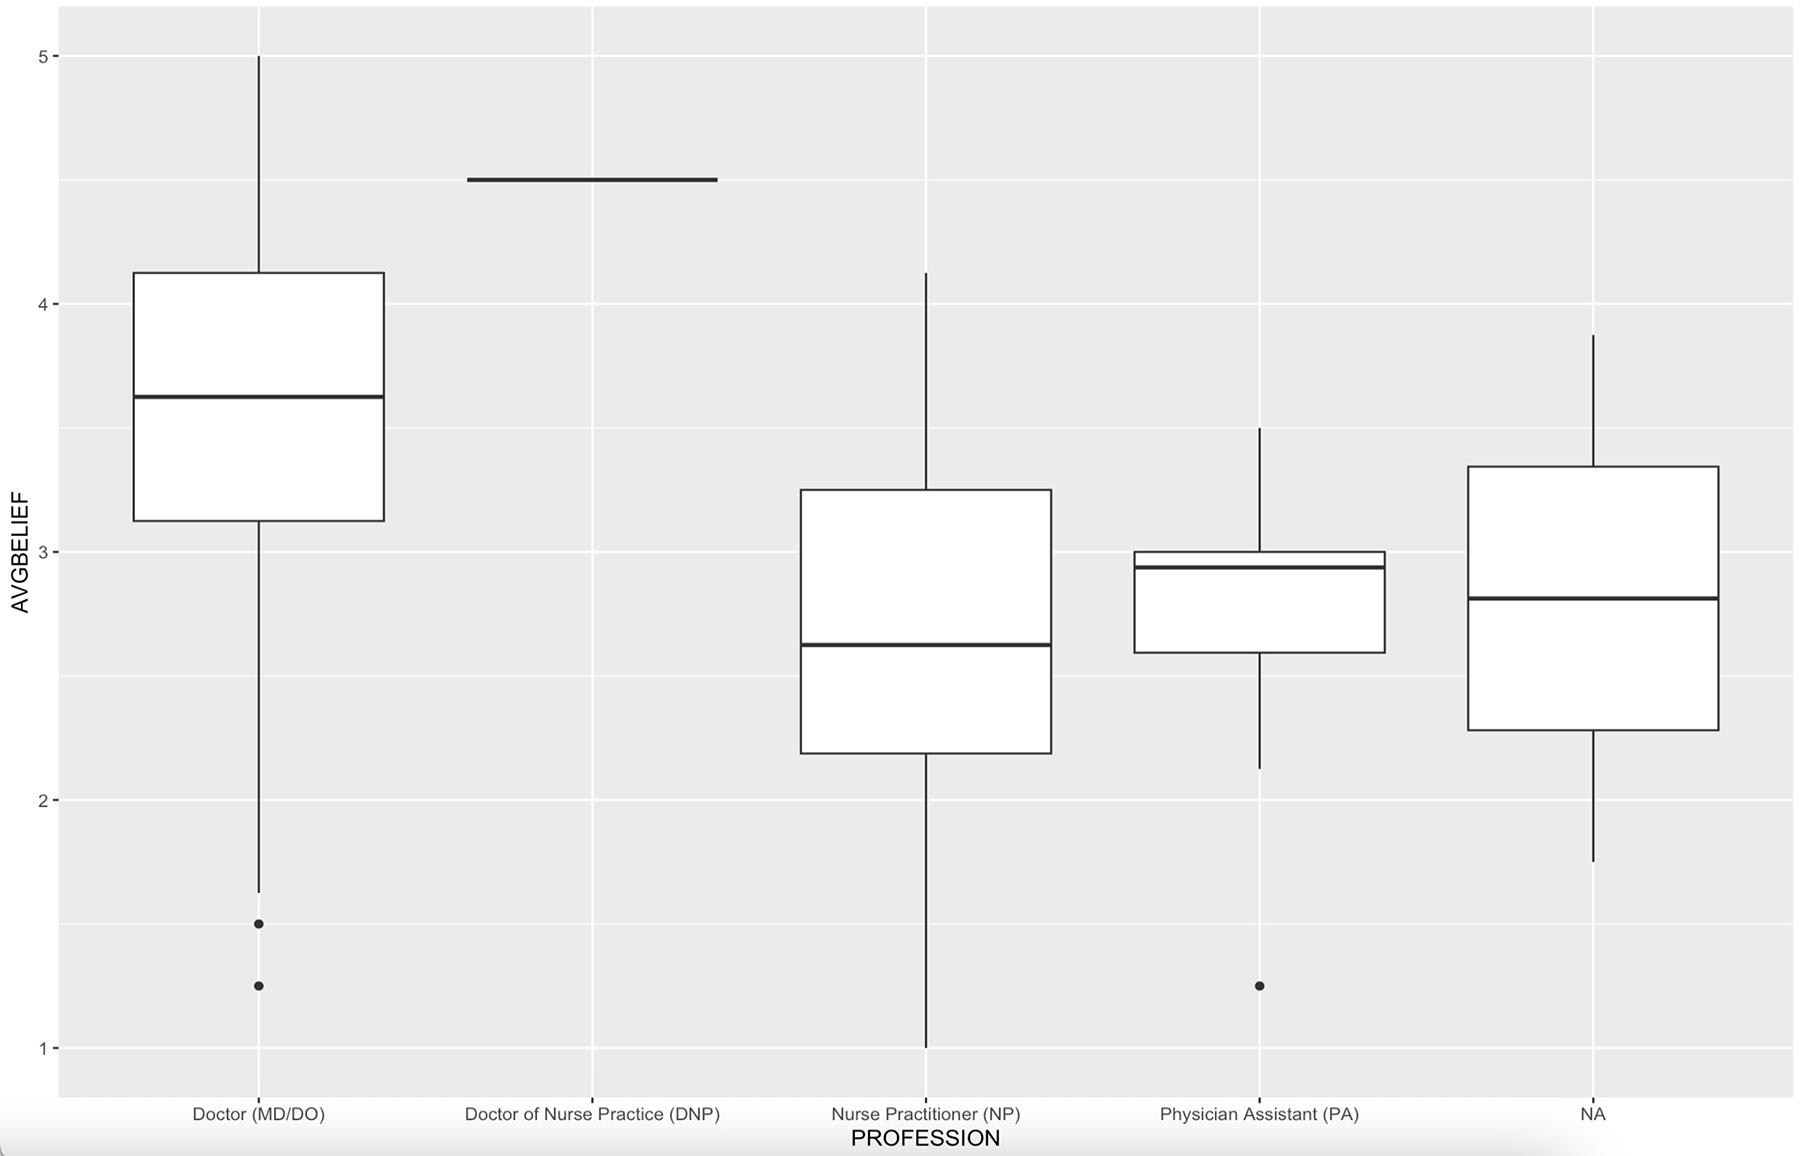
Figure A6: Aggregated climate concern metric (AVGBELIEF) against education level (PROFESSION) (F(3, 102)=6.373, p<0.001). (NA, not available)
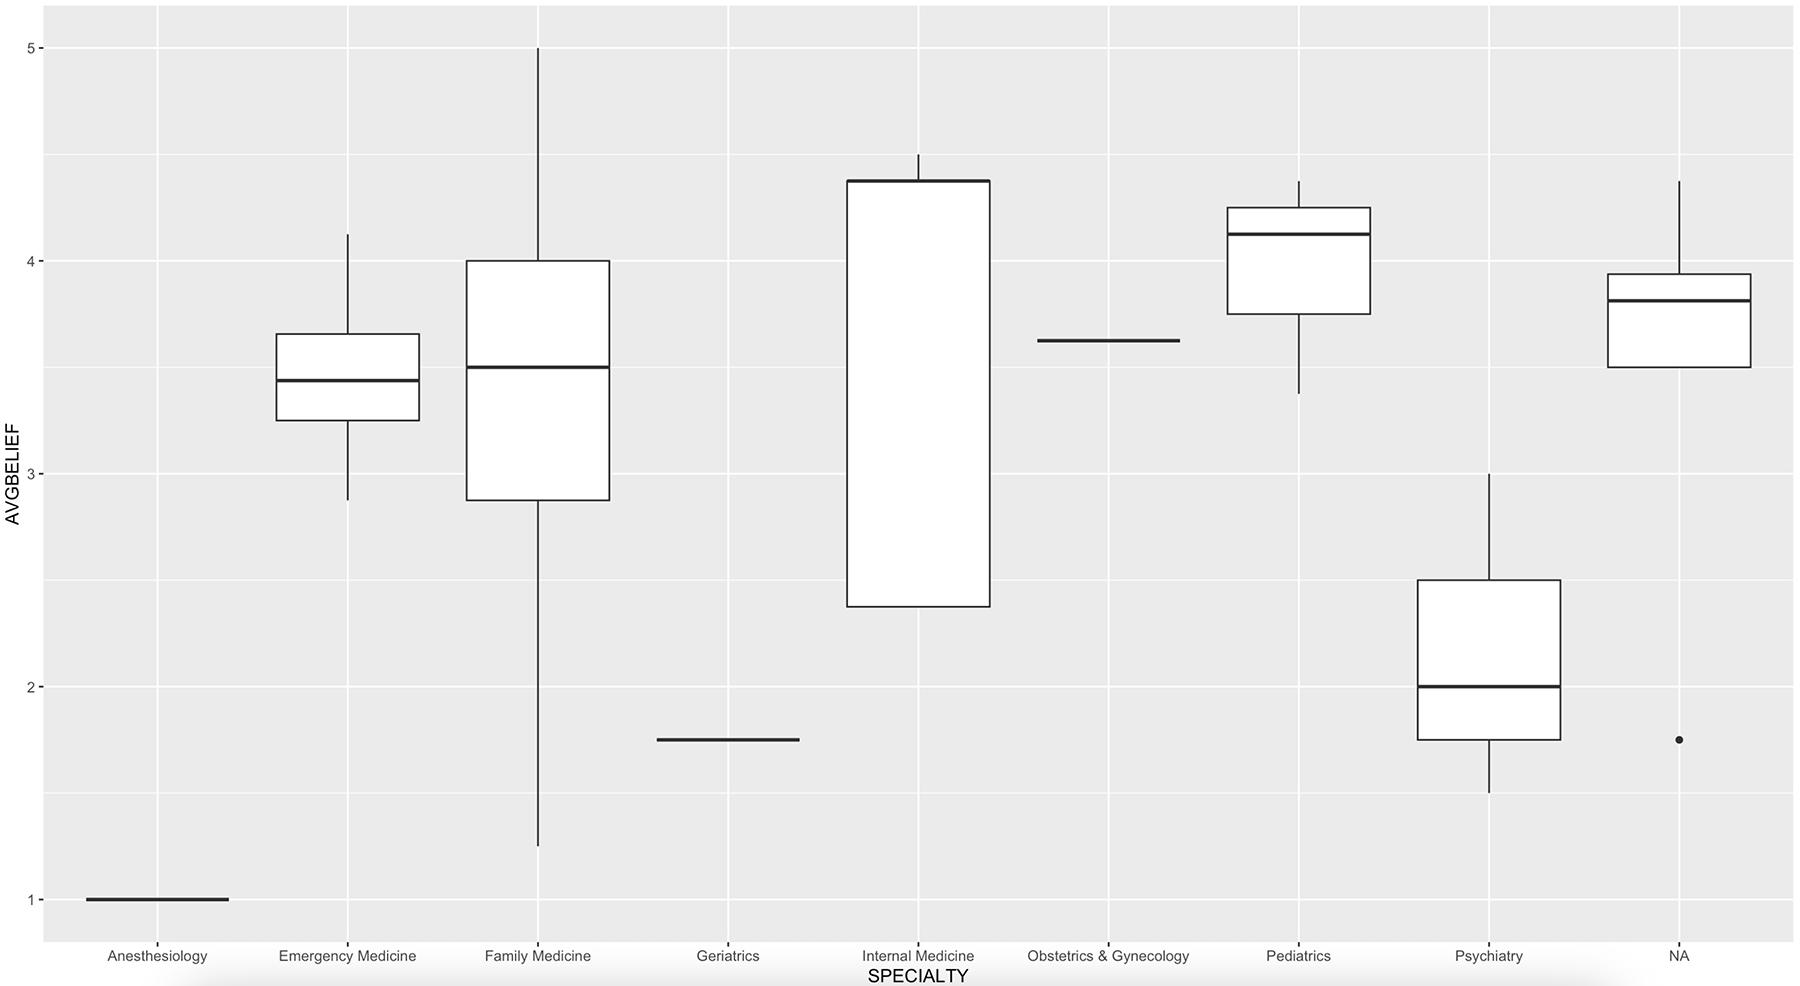
Figure A7: Aggregated climate concern metric (AVGBELIEF) against specialty (F(7, 92)=3.013, p=0.00677). (NA, not available)
Supplementary material is available on the live site https://www.rrh.org.au/journal/article/10911/#supplementary
You might also be interested in:
2014 - Investigating factors of self-care orientation and self-medication use in a Greek rural area