


Introduction
Informal employment represents the predominant form of employment globally, particularly in low- and middle-income countries. The International Labour Organization defines informal employment as ‘working arrangements that are in practice or by law not subject to national labor legislation, income taxation, or entitlement to social protection or other employment guarantees’1. According to International Labour Organization Modelled Estimates, informal employment makes up around 57.7% of worldwide employment and 65.6% of the occupied workforce in Asia and the Pacific2.
Informal workers may face higher occupational-related risks than formal workers, owing to a lack of formal legal protections3, which may lead to their working in hazardous workplaces with limited personal safety equipment4. Due to their exposure and susceptibility to health-threatening situations, informal workers have been highlighted as a key population for improving health equity5. A global analysis study conducted between 2011 and 2021 found a significant negative relationship between the size of informal workforce and population health outcomes6. According to WHO, monitoring health inequity is crucial for providing information on who is falling behind and informing policymakers on how to eliminate gaps and enhance health outcomes for all populations7.
A recent meta-analysis of research from seven countries in four WHO regions (Africa, America, Eastern Mediterranean, and Western Pacific) found that informal workers were less likely to use healthcare facilities8. Financial difficulties, a shortage of healthcare facilities, and poor quality healthcare services were frequently cited as barriers to accessing healthcare facilities among informal workers9-11. With financial difficulties, the lack of legally binding social protection may limit informal workers' access to health care.
Worldwide, communities living in underdeveloped areas continued to face healthcare access challenges, such as limited healthcare and transportation services, with economically disadvantaged people being particularly vulnerable12. Studies conducted in China revealed inequality in the geographic distribution of health resources, resulting in higher levels of health service utilization in the Eastern developed areas than in the Western underdeveloped areas13,14. Primary care was primarily used by the poorer population in Western underdeveloped areas, while hospitals were primarily used by the wealthier population in Eastern developed areas, with hospitals retaining the majority of health personnel and beds despite China's significantly larger primary care facilities13,14. Therefore, living in underdeveloped areas with a lack of healthcare facilities and poor-quality healthcare services may limit informal workers' access to health care.
As a country in the Western Pacific WHO region, Indonesia has a higher rate of informal employment, with 57.95% of Indonesian workers working informally in August 202415. Although the 2010 and 2019 National Labor Surveys (SAKERNAS) reveal a decreasing wage gap between formal and informal workers16, informal workers may remain more vulnerable. National employment laws provide little legal protection or social security for informal workers17. Along with Indonesia's universal health coverage (UHC) legislation, which requires all Indonesians to participate in National Health Insurance (Jaminan Kesehatan Nasional, JKN), formal employees are usually registered for the premium by their employers18,19. Informal workers are encouraged to register voluntarily. However, informal workers with irregular incomes struggle to pay premiums on a regular basis18,19.
Following the Alma-Ata Declaration of 1978, the Government of Indonesia developed primary health care as one of the first-level health facilities (fasilitas kesehatan tingkat pertama, FKTP) across the country, with JKN covering the health services provided by primary health care. On the other hand, higher-level JKN-accepting health facilities – such as hospitals, final referral hospitals with complete facilities, and medical specialists with inpatient care and specialist consultation – remain scarce20. Similarly to previous research in China, which indicated that primary care was predominantly used by the poorer population in underdeveloped areas, people in underdeveloped areas in Indonesia primarily used primary health care since health services are covered by JKN21,22.
According to Presidential Regulation No. 63/2020 on Determination of Underdeveloped Regions 2020–2024, there are 62 underdeveloped districts ranging from Western to Eastern Indonesia (Fig1). With a shortage of higher-level JKN-accepting health facilities in Indonesia’s underdeveloped districts, informal workers without health insurance may face double barriers to getting outpatient and inpatient treatment.
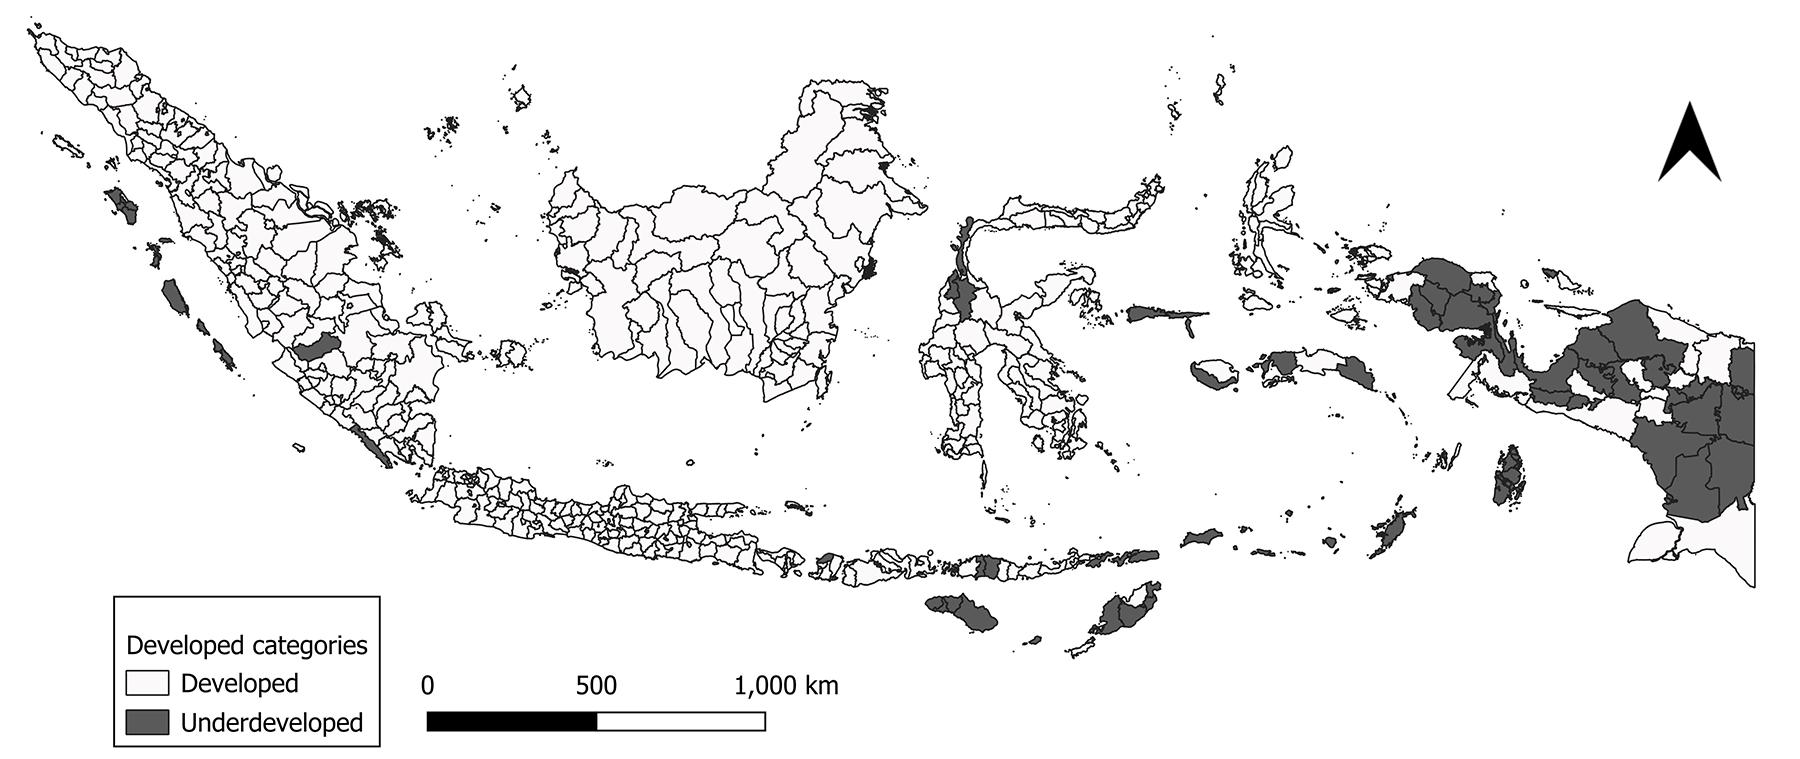 Figure 1: Underdeveloped districts in Indonesia, in accordance with Presidential Regulation No. 63/2020 on Determination of Underdeveloped Regions 2020–2024.
Conceptual review
The Andersen healthcare utilization model is a conceptual framework that examines individual and societal determinants of health service utilization23. Individual determinants include predisposing, enabling, and need factors. Studies in healthcare utilization limit the population to those with poor health status primarily because need factors, which are central to theoretical frameworks like Andersen’s behavioral model, are the strongest determinants of utilization24,25.
The societal determinants of health service utilization are divided into two main dimensions: resources and organization23. Resources include the amount and distribution of labor and capital, as well as the geographical distribution of healthcare facilities23. Furthermore, the organization indicates the level of access to the health services system and the mechanism for post-treatment services23. Therefore, a shortage of higher-level JKN-accepting health facilities in Indonesia’s underdeveloped districts, which serve as a resource and a vital component of the post-treatment service system, may lower healthcare utilization.
The Commission on Social Determinants of Health (CSDH) argues that health inequities arise from macrosocial contexts operating at global, national, and local levels, such as health systems, social and political conditions, as well as globalization, which unequally distribute health risks and resources across population groups26. These contexts, when combined with each individual's socioeconomic conditions, result in social hierarchies and contribute to health inequities26. Within the CSDH framework, the interplay between the societal and individual determinants of the Andersen healthcare utilization model variables leads to disparity in healthcare utilization. National employment law, which provides little legal protection or social security for informal workers, as well as a lack of higher-level JKN-accepting health facilities in Indonesia's underdeveloped districts, may limit informal workers without health insurance from accessing healthcare services in comparison to formal workers. Therefore, this study aims to analyze disparities in healthcare utilization between formal and informal workers in Indonesia, and to explore how geographic location and health insurance coverage shape outpatient and inpatient treatment utilization.
This study provides a multilevel modelling approach to monitor disparities in healthcare utilization between formal and informal workers, specific to the Indonesian context, with separate analyses for developed and underdeveloped districts. Separate analysis by geographic location may uncover critical developed and underdeveloped differences, potentially masking a structural inequality trap in which development unwittingly widens the disparities between formal and informal workers in healthcare utilization.
In this study, employment status (formal v informal) is treated as the primary exposure of interest to highlight how informal workers access healthcare services, given national employment laws offer little legal protection or social security to informal workers. Furthermore, this study not only examines differences in healthcare utilization between formal and informal workers, but also explicitly models the interaction between employment status and health insurance ownership. This technique allows for an examination of whether health insurance mediates or amplifies employment-based disparities in healthcare utilization, shedding light on the aspect of informality that discourages workers from accessing healthcare services.
Methods
Data and participants
This study uses a combination of individual and district-level data. The individual dataset used in the analysis is from the 2024 National Socioeconomic Survey (SUSENAS). The 2024 SUSENAS employed a two-stage stratified sampling design, with a total sample size of 345,000 households (excluding institutional households). The survey used the 2020 Population Census as the master sampling frame.
The district-level data was obtained from the 2024 Village Data Census (PODES). PODES describes infrastructure, social, and economic development at the village level. The 2024 PODES includes 84,276 urban and rural villages organized into 514 districts. Out of 514 districts, 62 are classified as underdeveloped districts under Presidential Regulation No. 63/2020 on Determination of Underdeveloped Regions 2020–2024.
The eligible unit of analysis includes 97,042 working-age populations aged 15 years and over who reported poor self-perceived health status and were unable to work or perform other daily activities (unweighted), distributed across 345,000 households in 514 districts. Out of 97,042 working-age population, around 7210 resided in remote districts, while 89,832 lived in non-remote districts. Self-reported health status is a simple self-reported measure of perceived health, widely used in health and social research and recognized by the WHO27. It allows individuals to rate their current health status on a five-point Likert scale ranging from very good to very bad. Previous research has shown that self-rated health status correlates with objective health status in the general population27. Since SUSENAS does not use a five-point Likert scale for the self-perceived health question, this study uses a yes/no question about the ability to perform daily activities to grade perceived health status as either very bad or very good, based-on the response immediately following the question on self-perceived health.
Measures
This study adopts the individual and societal determinants of the Andersen healthcare utilization model to examine outpatient and inpatient treatment utilization, including predisposing factors (employment status, age, sex, educational attainment, and marital status) and enabling factors (health insurance, household expenditure per capita, and the percentage of urban and rural villages with healthcare facilities at the district level). Our analysis is restricted to those with poor self-rated health status, to minimize confounding and selection bias, as well as improve internal validity28,29 (Table 1).
Table 1: Definition of dependent variables, variables of interest, and confounding study variables30-32
| Variable category | Variable | Operational definition | Measurement | Data source |
|---|---|---|---|---|
| Dependent | Outpatient treatment utilization | Having had outpatient treatment within the last four weeks before the survey | Categorical scale: 1. yes; 0. otherwise | SUSENAS (1105) Have you had any outpatient treatment during the last month? |
| Inpatient treatment utilization | Having received inpatient treatment within the past 12 months previous to the survey. | Categorical scale: 1. yes; 0. otherwise | SUSENAS (1201) Have you experienced any inpatient treatment in the recent year? | |
| Individual level | Employment status | Status in employment based on the respondent’s main job during the last week prior to the survey | Categorical scale: 1. formal; 2. informal† | SUSENAS (706) I would now like to ask about the job where you worked the most hours last week (707) How would you describe your specific working relationship with your main job? |
| Age | Length of time a respondent has lived since the date of birth to the date of enumeration, expressed in completed years | Continuous scale (years) | SUSENAS (406) When were you born? (407) How old are you now (in years)? | |
| Sex | A respondent’s biological state or identity, classified into male or female categories, based on physical appearance and/or population documents. | Categorical scale: 1. male; 2. female | SUSENAS (405) Are you male or female? | |
| Educational attainment | Highest level of formal education that a person has successfully completed (graduated), as evidenced by a valid diploma, certificate, or certificate of completion of studies, or the equivalent, regardless of whether the education was completed at the time of the survey or in the past | Categorical scale¶: 1. low; 2. high | SUSENAS (612) What is the highest level of education you are currently/ever attained? | |
| Marital status | Respondent’s marital status according to the laws/regulations in force in Indonesia, both state law and religious law | Categorical scale: 1. never-married; 2. currently married; 3. divorced/widowed | SUSENAS (404) What is your marital status? | |
| Health insurance | Ownership and type of financial program/protection used by household members to access health services when sick or in need of health services, whether mandatory (from the government/work) or voluntary | Categorical scale: 1. insured§; 2. uninsured | SUSENAS (1101) What type of health insurance do you have? | |
| Household expenditure per capita | Monetary value of all goods and services consumed (used) by a household during a reference period of 1 month, whether purchased with money, obtained from own-use production, or received as gifts or assistance, allocated to each member of the household | Categorical scale‡: 1. The bottom 40%; 2. middle 40%; 3. top 20% | The data are accessible in SUSENAS' raw dataset†† | |
| District level | Percentage of villages with outpatient facilities at the district level | Percentage of urban and rural villages having FKTP providers (PHC and clinics¶¶, with and without inpatient care facilities) at the district level | Continuous scale: percentage | PODES (704) Presence of health facilities in urban and rural villages (c) PHC with inpatient facilities (d) PHC without inpatient facilities (f) clinics |
| Percentage of villages with inpatient facilities at the district level | Percentage of urban and rural villages with hospitals§§ and PHC with inpatient facilities (higher-level healthcare facilities) at the district level | Continuous scale: percentage | PODES (704) Presence of health facilities in urban and rural villages (a) hospital (c) PHC with inpatient facilities |
† Informal workers in this variable are those holding informal jobs include own-account workers, employers with temporary workers / contributing family workers / unpaid family workers, workers in unrecognized or unregulated employment relationships, and contributing/unpaid family workers, in compliance with International Labour Organization recommendation No. 204 of 2015.
¶ Education level is classified as low (below high school), and high (high school and university), based on the mean years of schooling in 2024, which is 8.85 years30 and corresponds to the high school attainment.
§ Insurance indicators include coverage by JKN subsidies, JKN premiums, regional government health program, private health insurance membership, company health insurance membership, and two or more health insurance memberships.
‡ Categories adhere to World Bank criteria31.
†† The Office for National Statistics (Badan Pusat Statistik) calculates household expenditure using the basic need approach, which includes total expenditure on food and non-food items, calculated using the household consumption module of the 2024 SUSENAS.
¶¶ Since the implementation of universal health coverage, private clinics have become more pro-poor, accepting JKN32
§§ We are unable to differentiate between public and private hospitals due to data limitations given by SUSENAS. All public hospitals are required to give services to JKN beneficiaries, however only a few private hospitals accept JKN.
FKTP, fasilitas kesehatan tingkat pertama (first-level health services). JKN, Jaminan Kesehatan Nasional (National Health Insurance). PHC, primary health care. PODES, Village Data Census. SUSENAS, National Socioeconomic Survey.
Statistical analysis
All statistical analyses were carried out using Stata MP v17 (StataCorp; https://www.stata.com) and R software v4.5.1 (R Foundation for Statistical Computing; https://www.r-project.org). To complement the description of variance in healthcare facilities between districts, we used open-source software QGIS 3.44.2 Solothurn (QGIS; https://qgis.org) to present the percentage of urban and rural villages in each district with outpatient and inpatient facilities from 514 Indonesian districts.
This study employed a multilevel binary logistic regression modelling analysis to account for the nested structure of the data. Multilevel binary logistic regression models were calculated separately for developed and underdeveloped districts. A separate analysis was conducted to explore the extent to which developed and underdeveloped differences influence healthcare utilization.
We first collapsed the 2024 PODES village-level data into district-level aggregates, calculating the percentage of urban and rural villages equipped with healthcare facilities within each district that were classified as developed and underdeveloped based on the official geographic typology provided in the dataset. These district-level aggregates were then integrated with individual-level 2024 SUSENAS data, using district identifiers as the primary linkage key.
We employed a multilevel binary logistic regression model incorporating individual-level sampling weights to ensure nationally representative estimates. District-level characteristics derived from PODES were assigned to each individual-level observation in SUSENAS, while the estimation applied individual sampling weights from SUSENAS.
The data were organized in a two-level hierarchical structure33, with individual-level variables at level 1 and district-level variables at level 2. The model’s significance was tested by developing the three models sequentially. The following methods were used to assess the model’s significance:
- Model 0 (null model) evaluated the intraclass correlation coefficient (ICC) without explanatory variables to show how much the variation cluster at district level contributed to variation in the outcome variable. Model 0 employed the following equation:

Higher ICC value implies higher variability in the outcome variable across districts. An ICC of more than 10% indicates the need for multilevel modelling34.
- In model 1, only individual-level variables were included as explanatory factors. The significant χ2 test indicated the model’s goodness of fit. Model 1 employed the following equation:

- Model 2 was created by adding district-level variables to the preceding model. The significant χ2 test indicated the model’s goodness of fit. Model 2 employed the following equation:

For all models:
- Yij denotes a binary dependent variable indicating the outcome for individual i residing in district j
- β (vector of level 1 and level 2 coefficients) represents coefficients of individual-level covariates, including the intercept
- uj is the district-level random intercept
- γ (vector of level 2 coefficients) represents the fixed effects of district-level covariates
- Pij denotes the probability that individual i living in district j utilizes outpatient or inpatient treatment
- formalij is a binary indicator of employment status (1 = formal, 0 = informal)
- insuranceij is a binary indicator of health insurance ownership (1 = insured, 0 = uninsured)
- formalij × insuranceij represents the interaction term capturing effect modification of employment status by insurance coverage
-
 is a vector of individual-level covariates
 -
 is a vector of district-level variables.
The coefficient of the interaction term represents the differential association of employment status with healthcare utilization between insured and uninsured workers. A statistically significant interaction indicates that the effect of being formally (versus informally) employed on healthcare utilization varies depending on health insurance coverage. Predicted probabilities derived from the interaction model were used to facilitate interpretation of the combined effects of employment status and insurance coverage.
Ethics approval
This study used fully anonymized datasets from the 2024 SUSENAS and the 2024 PODES provided by Statistics Indonesia (BPS) under data-sharing agreements (letters 23/LADU/0000/12/2024 and 46/LADU/0000/01/2025). There was no direct interaction with participants and no access to identifiable information. Therefore, formal ethics approval was not required. The data-sharing agreements prohibit public access to the datasets without permission from BPS.
Results
Table 2 shows that informal workers make up a higher percentage in underdeveloped districts (80.44%) compared to developed districts (62.32%). The mean percentage of villages with FKTP services is lower in underdeveloped districts (14.86%) than in developed districts (62.32%). The mean percentage of villages with inpatient facilities is lower in underdeveloped districts (9.33%) than in developed districts (12.27%).
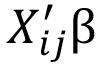
Figure 2 depicts how FKTP has reached all districts. However, in some parts of Indonesia, there are still a few districts with FKTP coverage of barely 10% or less.
Figure 3 illustrates that hospitals and primary health care with inpatient facilities are still scarce in many districts.
Table 2: Basic demographic characteristics of study data
| Variable | Characteristics | District category | ||
|---|---|---|---|---|
|
Underdeveloped N unweighted (% weighted) |
Developed N unweighted (% weighted) |
|||
| Employment status | Formal | 1410 (19.56) | 33,849 (37.68) | |
| Informal | 5800 (80.44) | 55,983 (62.32) | ||
| Sex | Male | 3315 (46.35) | 40,486 (45.46) | |
| Female | 3895 (53.65) | 49,346 (54.54) | ||
| Educational attainment | Low | 5583 (75.33) | 62,892 (69.17) | |
| High | 1627 (24.67) | 26,940 (30.83) | ||
| Marital status | Never married | 1204 (18.19) | 13,232 (15.91) | |
| Currently married | 4798 (67.76) | 61,161 (68.97) | ||
| Divorced/widowed | 1208 (14.05) | 15,439 (15.12) | ||
| Health insurance | Insured | 6245 (85.65) | 74,208 (80.35) | |
| Uninsured | 965 (14.35) | 15,624 (19.65) | ||
| Household expenditure per capita | Bottom 40% | 3667 (54.24) | 32,352 (40.45) | |
| Middle 40% | 2603 (34.73) | 38,759 (39.88) | ||
| Top 20% | 940 (11.03) | 18,721 (19.66) | ||
| Age | (mean) | 47.02 | 48.16 | |
| Percentage of villages with outpatient facilities at district level | (mean) | 14.86 | 62.32 | |
| Percentage of villages with inpatient facilities at district level | (mean) | 9.33 | 12.27 | |
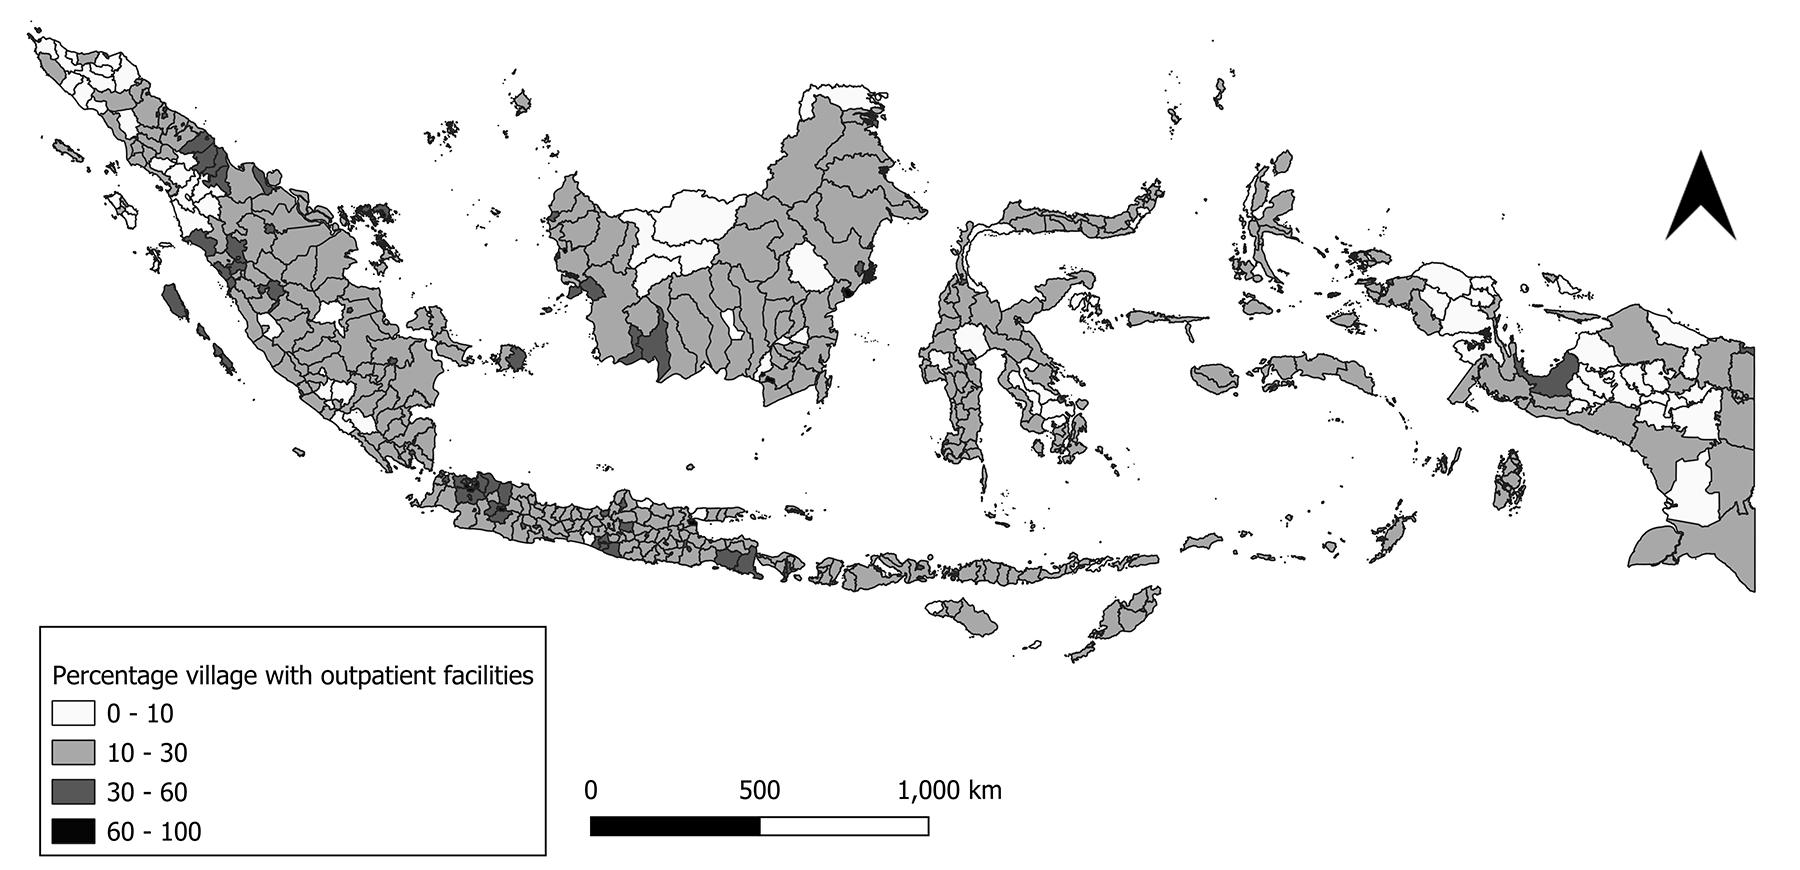 Figure 2: Percentage of urban and rural villages with first-level health facilities (FKTP) at the district level. (Source: 2024 Village Data Census (PODES; authors’ calculation))
 Figure 3: Percentage of urban and rural villages with inpatient facilities at the district level. (Source: 2024 Village Data Census (PODES; authors’ calculation))
The model’s significance for outpatient treatment utilization in underdeveloped districts was tested by developing the three models sequentially (see Table 3).
- Model 0 reported an ICC of 25.61% without allowing for explanatory variables to be inserted into the model (null model), indicating high variability in outpatient utilization across districts.
- Only level 1 (individual-level) variables were included as explanatory variables in model 1. For model 1, χ2 is 9541.1, which is significant.
- Model 2 resulted from level 2 (district-level) variables added to the model. For model 2, χ2 is 2.28, which is significant.
For model 2, formal workers are about 1.5 times (adjusted odds ratio (aOR) 1.51, 95% confidence interval (CI) 1.43–1.60) more likely to access outpatient treatment than informal workers. Within the conceptual framework of an interactive logistic model, the influence of formal employment on healthcare utilization among insured workers is conditional, calculated as the total of the main effects of formal employment status, insurance, and their interaction term. Applying the model estimates, having health insurance increases the odds of formal employment to outpatient utilization by 2.05 times – computed as a multiple of its main effect of formal employment (aOR 1.51), the main effect of insurance (aOR 1.49), and their interaction term (aOR 0.91) – which is higher than informal employment without health insurance. The odds of formal employment without health insurance for outpatient utilization increase by 1.51 times – calculated as a multiple of the main effect of formal employment (aOR 1.51), the main effect of not having health insurance (aOR 1.00), and their interaction term (aOR 1.00) – compared to informal employment without health insurance. The odds of informal employment for outpatient utilization increase by 1.49 times when there is health insurance – calculated as a multiple of the main effect of informal employment (aOR 1.00), the main effect of insurance (aOR 1.49), and their interaction term (aOR 1.00) – compared to informal employment without health insurance. It is important to note that this combined estimate is not an independently estimated coefficient; rather, it is calculated to illustrate the overall association in the context of the model’s non-linear structure.
The model’s significance for inpatient treatment utilization in underdeveloped districts was tested by developing the three models sequentially (Table 3).
- Model 0 reported an ICC of 38.26% without allowing for explanatory variables to be inserted into the model (null model), indicating very high variability in inpatient utilization across districts.
- Only level 1 (individual-level) variables were included as explanatory variables in model 1. For model 1, χ2 is 7525.9, which is significant.
- Model 2 resulted from level 2 (district-level) variables added to the model. At model 2, χ2 is 12.754, which is significant.
For model 2, formal workers are about 1.08 times (aOR 1.08, 95%CI 0.92–1.28) more likely to access inpatient treatment than informal workers. Within the conceptual framework of an interactive logistic model, being insured increases the odds of formal employment to inpatient utilization by 5.81 times – computed as a multiple of its main effect of formal employment (aOR 1.08), the main effect of insurance (aOR 4.27), and their interaction term (aOR 1.26) – which is higher than informal employment without health insurance. The odds of formal employment without health insurance to inpatient utilization increase by 1.08 times – calculated as a multiple of the main effect of formal employment (aOR 1.08), the main effect of not having health insurance (aOR 1.00), and their interaction term (aOR 1.00) – compared to informal employment without health insurance. The odds of informal employment to inpatient utilization increase by 4.27 times when having health insurance – calculated as a multiple of the main effect of informal employment (aOR 1.00), the main effect of insurance (aOR 4.27), and their interaction term (aOR 1.00) – compared to informal employment without health insurance.
The model’s significance for outpatient treatment utilization in developed districts was tested by developing the three models sequentially (Table 4).
- Model 0 reported an ICC of 10.18% without allowing for explanatory variables to be inserted into the model (the null model), indicating very low variability in outpatient utilization across districts. Although the ICC value is extremely low and nearly negligible, it suggests the need for multilevel modeling.
- Only level 1 (individual-level) variables were included as explanatory variables in model 1. For model 1, χ2 is 188,263, which is significant.
- Model 2 resulted from level 2 (district-level) variables added to the model. For model 2, χ2 is 27.09, which is significant.
For model 2, the aOR for formal employment (versus informal employment as the reference) is 1.00 (95%CI 0.99–1.00), indicating no statistically significant association between formal employment status and outpatient healthcare utilization. Within the conceptual framework of an interactive logistic model, having health insurance increases the odds of formal employment to outpatient utilization by 1.44 times – computed as a multiple of its main effect of formal employment (aOR 1.00), the main effect of insurance (aOR 1.40), and their interaction term (aOR 1.03) – which is higher than informal employment without health insurance. The odds of formal employment without health insurance on outpatient utilization were 1.00 – calculated as a multiple of the main effects of formal employment (aOR 1.00), not having health insurance (aOR 1.00), and their interaction term (aOR 1.00) – versus informal employment without health insurance. The odds of informal employment to outpatient utilization increase by 1.40 times when having health insurance – calculated as a multiple of the main effect of informal employment (aOR 1.00), the main effect of insurance (aOR 1.40), and their interaction term (aOR 1.00) – compared to informal employment without health insurance.
The model’s significance for inpatient treatment utilization in developed districts was tested by developing the three models sequentially (Table 4).
- Model 0 reported an ICC of 15.77% without allowing for explanatory variables to be inserted into the model (the null model), indicating low variability in inpatient utilization across districts. Although the ICC value is low, it suggests the need for multilevel modeling.
- Only level 1 (individual-level) variables were included as explanatory variables in model 1. For model 1, χ2 is 270,396, which is significant.
- Model 2 resulted from level 2 (district-level) variables added to the model. For model 2, χ2 is 11.34, which is significant.
For model 2, formal employment status is associated with lower odds of inpatient utilization (aOR 0.92, 95%CI 0.91–0.94) compared to their informally employed counterparts. Within the conceptual framework of an interactive logistic model, having health insurance increases the odds of formal employment to inpatient utilization by 3.04 times – computed as a multiple of its main effect of formal employment (aOR 0.92), the main effect of insurance (aOR 2.92), and their interaction term (aOR 1.13) – which is higher than informal employment without health insurance. The odds of formal employment without health insurance on inpatient utilization were 0.92 times lower – calculated as a multiple of the main effects of formal employment (aOR 0.92), not having health insurance (aOR 1.00), and their interaction term (aOR 1.00) – than informal employment without health insurance. The odds of informal employment to inpatient utilization increase by 2.92 times when having health insurance – calculated as a multiple of the main effect of informal employment (aOR 1.00), the main effect of insurance (aOR 2.92), and their interaction term (aOR 1.00) – compared to informal employment without health insurance.
Table 3: Multilevel logistic regression: odds ratio of outpatient and inpatient treatment utilization in underdeveloped districts of Indonesia
| Variable | Characteristics | Outpatient | Inpatient | ||||||||
|---|---|---|---|---|---|---|---|---|---|---|---|
|
Model 0 |
Model 1 aOR (95%CI) |
Model 2 aOR (95%CI) |
Model 0 |
Model 1 aOR (95%CI) |
Model 2 aOR (95%CI) |
||||||
| Employment status | Formal | 1.51*** | 1.43–1.59 | 1.51*** | 1.43–1.60 | 1.08*** | 0.91–1.28 | 1.08*** | 0.92–1.28 | ||
| Informal | 1.00 | 1.00 | 1.00 | 1.00 | |||||||
| Employment status x health insurance | Formal and insurance | 0.91*** | 0.86–0.96 | 0.91*** | 0.86–0.96 | 1.26*** | 1.06–1.49 | 1.26*** | 1.06–1.49 | ||
| Formal and no insurance; informal and insurance; or informal and no insurance | 1.00 | 1.00 | 1.00 | 1.00 | |||||||
| Sex | Male | 0.95*** | 0.94–0.9 | 0.95*** | 0.93–0.96 | 0.68*** | 0.66–0.99 | 0.68*** | 0.66–0.70 | ||
| Female | 1.00 | 1.00 | 1.00 | 1.00 | |||||||
| Age | 1.01*** | 1.01–1.01 | 1.01*** | 1.01–1.01 | 0.99*** | 0.99–0.99 | 0.99*** | 0.99–0.99 | |||
| Educational Attainment | Low | 1.00 | 1.00 | 1.00 | 1.00 | ||||||
| High | 1.19*** | 1.18–1.22 | 1.20*** | 1.18–1.22 | 1.23*** | 1.19–1.27 | 1.23*** | 1.19–1.27 | |||
| Marital status | Never married | 1.00 | 1.00 | 1.00 | 1.00 | ||||||
| Currently married | 1.81*** | 1.76–1.86 | 1.81*** | 1.77–1.86 | 1.83*** | 1.75–1.92 | 1.83*** | 1.75–1.92 | |||
| Divorced/widowed | 1.88*** | 1.81–1.94 | 1.88*** | 1.81–1.94 | 2.16*** | 2.03–2.30 | 2.16*** | 2.03–2.30 | |||
| Health insurance | Insured | 1.49*** | 1.46–1.53 | 1.50*** | 1.46–1.53 | 4.27*** | 3.97–4.58 | 4.27*** | 3.97–4.59 | ||
| Uninsured | 1.00 | 1.00 | 1.00 | 1.00 | |||||||
| Household expenditure per capita | Bottom 40% | 1.00 | 1.00 | 1.00 | 1.00 | ||||||
| Middle 40% | 1.04*** | 1.02–1.05 | 1.04*** | 1.02–1.05 | 1.49*** | 1.45–1.54 | 1.49*** | 1.45–1.54 | |||
| Top 20% | 1.17*** | 1.14–1.19 | 1.17*** | 1.14–1.20 | 1.39*** | 1.34–1.46 | 1.40*** | 1.34–1.46 | |||
| Percentage of villages with healthcare facilities at district level | 1.02*** | 0.99–1.04 | 1.05*** | 1.02–1.08 | |||||||
| –2log likelihood | 476,120 | 466,579 | 466,577 | 193,146 | 185,620 | 185,607 | |||||
| χ2p;q | 9541.1*** | 2.28* | 7525.9*** | 12.754*** | |||||||
| ICC | 25.61 | 38.26 | |||||||||
*p<0.1, **p<0.05, ***p<0.01.
aOR, adjusted odds ratio. CI, confidence interval.
Table 4: Multilevel logistic regression: odds ratio of outpatient and inpatient treatment utilization in developed districts of Indonesia
| Variable | Characteristics | Outpatient | Inpatient | ||||||||
|---|---|---|---|---|---|---|---|---|---|---|---|
|
Model 0 |
Model 1 aOR (95%CI) |
Model 2 aOR (95%CI) |
Model 0 |
Model 1 aOR (95%CI) |
Model 2 aOR (95%CI) |
||||||
| Employment status | Formal | 1.00*** | 0.99–1.00 | 1.00*** | 0.99–1.00 | 0.92*** | 0.91–0.94 | 0.92*** | 0.91–0.94 | ||
| Informal | 1.00 | 1.00 | 1.00 | 1.00 | |||||||
| Employment status x health insurance | Formal and insurance | 1.04*** | 1.02–1.04 | 1.03*** | 1.03–1.04 | 1.13*** | 1.12–1.15 | 1.13*** | 1.12–1.15 | ||
| Formal and no insurance; informal and insurance; or informal and no insurance | 1.00 | 1.00 | 1.00 | 1.00 | |||||||
| Sex | Male | 0.86*** | 0.86–0.87 | 0.86*** | 0.85–0.87 | 0.92*** | 0.92–0.93 | 0.92*** | 0.91–0.93 | ||
| Female | 1.00 | 1.00 | 1.00 | 1.00 | |||||||
| Age | 1.01*** | 1.01–1.01 | 1.01*** | 1.01–1.01 | 1.01*** | 1.01–1.01 | 1.01*** | 1.01–1.01 | |||
| Educational attainment | Low | 1.00 | 1.00 | 1.00 | 1.00 | ||||||
| High | 1.04*** | 1.03–1.04 | 1.02*** | 1.01–1.02 | 1.10*** | 1.09–1.10 | 1.10*** | 1.09–1.10 | |||
| Marital status | Never married | 1.00 | 1.00 | 1.00 | 1.00 | ||||||
| Currently married | 1.06*** | 1.06–1.06 | 1.06*** | 1.05–1.06 | 1.10*** | 1.10–1.20 | 1.11*** | 1.10–1.12 | |||
| Divorced/widowed | 1.02*** | 1.01–1.02 | 1.02*** | 1.01–1.02 | 0.89*** | 0.88–0.90 | 0.90*** | 0.89–0.91 | |||
| Health insurance | Yes | 1.39*** | 1.39–1.40 | 1.40*** | 1.40–1.40 | 2.90*** | 2.90–2.90 | 2.92*** | 2.90–2.94 | ||
| No | 1.00 | 1.00 | 1.00 | 1.00 | |||||||
| Household expenditure per capita | Bottom 40% | 1.00 | 1.00 | 1.00 | 1.00 | ||||||
| Middle 40% | 1.17*** | 1.17–1.18 | 1.17*** | 1.17–1.18 | 1.46*** | 1.45–1.46 | 1.45*** | 1.45–1.46 | |||
| Top 20% | 1.35*** | 1.34–1.35 | 1.35*** | 1.34–1.35 | 2.19*** | 2.18–2.20 | 2.20*** | 2.19–2.21 | |||
| Percentage of villages with healthcare facilities at district level | 1.01*** | 1.00–1.00 | 1.00*** | 1.00–1.00 | |||||||
| –2log likelihood | 17,137,537 | 16,949,274 | 16,949,274 | 8,530,814 | 8,260,418 | 8,260,406 | |||||
|
χ2p;q |
188,263*** | 27.09*** | 270,396*** | 11.34*** | |||||||
| ICC | 10.18 | 15.77 | |||||||||
*p<0.1, **p<0.05, ***p<0.01.
aOR, adjusted odds ratio. CI, confidence interval.
Discussion
Our study finds significant disparities in outpatient and inpatient treatment utilization based on employment status only in underdeveloped districts, with formal workers having higher utilization than informal workers. In underdeveloped districts, the ICC values for outpatient and inpatient treatment utilization are high, implying that supply-side factors in underdeveloped districts unintentionally contribute to outpatient and inpatient treatment utilization, creating a structural inequality trap. Our findings indicate that the benefit of the having outpatient and inpatient facilities for healthcare utilization in each village was less pronounced. However, the high ICC indicates that unmeasured district-level factors beyond simple facility presence still explain a substantial portion of the variation in service use. Poor roads, long travel times, and limited transport modes restricted access to healthcare facilities in underdeveloped areas35,36.
The most revealing insights emerge from the interaction between employment status and health insurance in underdeveloped districts. Although the nature of work causes disparities in healthcare utilization between formal and informal workers, health insurance ownership increases healthcare utilization coverage among informal workers more than for formal workers who do not have health insurance. Thus, our findings indicate that the benefit of informal employment for healthcare utilization is strongly mediated by health insurance coverage.
Within the Andersen healthcare utilization model, a lack of inpatient facilities, which serve as a resource and a critical component of the post-treatment service system, may reduce outpatient and inpatient treatment utilization among those without health insurance. Health insurance can provide social protection, particularly to individuals in the lowest wealth quintile residing in underdeveloped districts, but its effectiveness is reduced due to supply constraints22,37. The descriptive analysis reveals that the percentage of informal workers is very high in underdeveloped districts; thus, we recommend investing in infrastructure to improve access to inpatient facilities accepting JKN benefits and encouraging informal workers to enroll in health insurance, thereby reducing healthcare disparities between formal and informal workers.
In relation to low ICC values, our study demonstrates that the variability in developed districts only has a minor impact on healthcare utilization. Formal and informal workers use health care at similar rates, with formal workers using inpatient facilities slightly less than informal workers. The association between employment status and healthcare utilization is more subdued, and it works mostly in tandem with health insurance, resulting in higher utilization among both formal and informal workers with health insurance than those without. This indicates the pathway to outpatient and inpatient treatment is not through employment alone, but is facilitated by health insurance in developed districts. Employment status is not a direct driver of healthcare utilization in developed districts.
The findings of our study strengthen the CSDH framework. The disparity in healthcare utilization between formal and informal workers is heavily modulated by geographic context (living in underdeveloped districts) and is deeply intertwined with health insurance status.
Limitations
This study is based on a nationally representative household survey (SUSENAS), which can be generalized to the national level. However, the data collected from household surveys only include the non-institutionalized population. Our findings may not be generalizable to the institutionalized population, which is considered to have different social networks influencing health-seeking behavior. A qualitative study found that social networks, which included family members, close neighbors and coworkers, had a significant impact on informal workers’ decision to join JKN38. We also acknowledge the role of income in access to health care. However, SUSENAS does not provide data on wage; therefore, we use household expenditure per capita, which implies socioeconomic class, as a confounding variable. Additionally, outpatient and inpatient treatment utilization is self-reported, which may lead to recall bias. Finally, PODES data only reports on the presence of facilities in each village. This does not fully capture the spatial aspects of these facilities, such as distance and transportation modes, which are essential for a comprehensive assessment of their utilization.
Conclusion
In Indonesia, employment status is not a uniform determinant of inequity in healthcare utilization because its impact is highly contingent on geographic context. Our study reveals that significant disparities between formal and informal workers in outpatient and inpatient utilization exist only in underdeveloped districts. In these areas, formal workers maintain higher utilization rates, while supply-side limitations unintentionally contribute to a structural inequality trap. The interplay between employment status and health insurance in underdeveloped districts suggests that health insurance coverage strongly benefits informal workers in accessing health care. However, in developed districts, this dichotomy disappears as both formal and informal workers access health care at similar rates. Employment status is not a direct driver of utilization in developed areas, where the pathway to treatment is instead facilitated by health insurance.
These findings move beyond a simple formal-versus-informal dichotomy to illustrate the multi-layered pathways linking labor market position to health system engagement across diverse districts. Thus, our findings support the CSDH framework, in which the disparity in healthcare utilization between formal and informal workers is highly influenced by geographic context (living in underdeveloped districts) and is inextricably linked to health insurance status.
Our analysis recommends several macro-level interventions. First, we call for inclusive development planning for underdeveloped districts that considers the spatial aspects of healthcare facilities, especially since the ratio of informal workers in these areas is extremely high. Second, we advocate for a stronger social protection system for informal workers. We discover that the benefits of informal employment in underdeveloped districts are significantly bolstered by health insurance coverage, making it a critical tool to mitigate the healthcare utilization disparities between formal and informal workers in underdeveloped districts.
Given the limitations of our study, we recommend directions for future research. We did not examine causality in our study because it is designed to monitor the access gap in healthcare utilization by employment status. Therefore, future research can use mixed-methods studies that integrate cohort and qualitative data to establish causality and analyze the reasons behind observed disparities. Policy-oriented research is strongly recommended to assess the effectiveness of specific actions or policies in improving supply-side development in underdeveloped districts.
Funding
The authors received no specific funding for this study.
Conflicts of interest
The authors declare that they have no conflicts of interest.
AI disclosure statement
Artificial intelligence tools, including ChatGPT (OpenAI), were used solely to improve grammar, spelling, and clarity of expression. AI tools were not used for study design, hypothesis formulation, data analysis, statistical modelling, interpretation of findings, coding, or generation of results. All AI-assisted revisions were critically reviewed and verified by the authors, who take full responsibility for the accuracy and integrity of the manuscript.
References
You might also be interested in:
2015 - Indonesian medical students' preferences associated with the intention toward rural practice
2011 - Earthquake, tsunami, radiation leak, and crisis in rural health in Japan