

Introduction
Regular participation in physical activity programs is constantly pointed out as essential for children’s physical fitness development1,2. Physical fitness is an important health determinant related to several physiological functions3. Health benefits derived from increased physical fitness include body mass regulation and reduced risks of chronic health diseases such as hypertension, type 2 diabetes, hypercholesterolaemia and cardiovascular disease4-6. Under supervised physical activity, children can enhance their physical capacities (strength, speed, agility, flexibility) and at the same time learn and improve fundamental motor skills such as running, jumping, throwing, catching and balancing. All these movements provide the basis for athletic skills acquisition and influence sports participation over adolescence and into adulthood. Importantly, several epidemiological studies confirmed the association between physical activity, physical fitness and adiposity in school-aged children and youth4,7,8, while longitudinal studies reported an inverse relationship between body mass index (BMI) and physical fitness9,10.
Physical fitness development in children is considerably faster in girls compared to boys, mainly due to the earlier onset of maturation11. On the other hand, boys tend to be more active than girls, a fact that may explain gender-specific fitness improvement after training interventions12. However, recent research has shown that performance in fitness tests and in particular in weight-bearing activities is reduced for all children from an early age, irrespective of sex13,14.
Obesity has become one of the major health risks in childhood, reaching alarming magnitude and significantly affecting physical, psychological and clinical parameters, which can progress into adulthood15. Obesity in childhood and adolescence has been associated with urban life characteristics such as an increased rate of sedentary behavior in addition to a decline in physical activity levels and a decrease in physical education class participation. However, evidence suggests that adverse socioeconomic conditions, often found in rural areas, and poor dietary habits combined with limited awareness of health issues, also lead to an increased prevalence of childhood obesity3,16. Previous research suggests that children living in rural compared to urban areas demonstrate better performance in several measures3,17,18. However, evidence is still inconclusive, since it was recently found that children participating in sport clubs demonstrate higher fitness indices, over a 4-year period, as compared to their non-participating peers, irrespective of living area (urban or rural)3.
In a recent study conducted in rural areas, it was found that overweight and obese children represented more than 40% of the total population examined19. Interestingly, in that study, physical fitness level was higher compared to that observed in urban areas19 and in particular in cardiovascular fitness, strength and agility measures. It is generally accepted that children’s participation in sports and physical activity is also related to socioeconomic features of the living area. To the best of othe authors’ knowledge, no studies have examined the physical fitness levels and the relationship between physical activity and obesity in remote and isolated Greek islands.
Therefore, the aim of this study was twofold: first, to assess the prevalence of childhood obesity in 18 remote and isolated Greek islands, and second, to examine the association between BMI and physical fitness indices in children aged 5–12 years. Moreover, sex- and age-specific physical fitness percentiles are presented that can provide useful information to policymakers in designing health-related strategies aiming to treat and prevent obesity in youth.
Methods
Participants
According to the recently published European Commission guidelines describing poverty and social exclusion in rural areas20, the 18 most remote and isolated islands of the Aegean Sea in Greece were selected to address the aim of the study. Every island fulfilling the following criteria that determine rurality of a remote island was considered a unit: distance from continental Greece, an agriculture-based economy, aging population, lower education attainment, low levels of physical activity and lack of accessibility to social services. All selected islands responded positively to the assessment plan. In total, 463 children (244 boys and 219 girls), aged 5–12 years, volunteered to participate in this study.
From the 662 children attending the 25 public schools, 463 children (~70%) participated in the study, after providing a medical certificate. All children participated in school based only physical education classes, twice a week, for 45 min each time. Characteristics of the participants are presented in Table 1. After a detailed briefing about the experimental procedure and the potential risks involved in the study, a written parental consent was provided for all participants.
Anthropometric and physical performance testing
A cross-sectional analysis was conducted in order to evaluate the effect of BMI on physical fitness measures. Anthropometric and body composition measurements were carried out in a separate session, 1 week before the physical fitness testing. In this session, anthropometric measurements were taken, and participants were familiarized with the testing procedures. Body weight and height were measured to the nearest 0.1 kg and 0.5 cm, respectively. BMI was calculated by dividing weight (kg) by the square of height (m). Age and gender BMI cut-off points were determined according to World Health Organisation (WHO) norms for underweight, normal, overweight and obese children21. In order to examine the integrated influence of overweight and obesity status on fitness measures, underweight children were merged with normal weight, and overweight children were merged with obese to form S1 and S2 groups, respectively.
A week later, in the main testing session, children underwent a series of physical fitness tests consisting of 20 m sprint, standing long jump, 1 kg medicine ball throw, agility T-test and sit-and-reach test. All tests were performed in the school settings and under the guidance of qualified physical education teachers. A standardized 10 min warm-up (consisting of 5 min jogging at children’s own pace and 5 min of dynamic stretching) preceded the session. All measurements were taken twice, and the best result was recorded for further analysis. Verbal encouragement was given throughout the test in order for the children to achieve optimal performance.
Sprint speed
Sprint speed was determined by a timed 20 m sprint. The starting position was standardized for all. The trial started in a two-point crouched position with the preferred foot on the starting line and the other foot in line with the heel of the preferred foot. One cone was placed at a 20 m distance. All children were instructed to run as fast as possible. The total time taken to run the 20 m sprint was manually recorded using a digital stopwatch. Two trials were performed, interspersed by a 3 min rest and the best performance was recorded for further analysis. Interclass correlation coefficient (ICC) was 0.96.
Upper limb power (1 kg ball throw)
Upper body power was assessed using the test of a 1 kg medicine ball throw. While seated, children were required to pull the medicine ball behind their head with both hands and forcefully throw it forward over the maximum possible distance. Two efforts were allowed, and the best result was recorded for further analysis. Distance was measured to the nearest 0.1 m from the landing point. The medicine ball throw showed an ICC of 0.97.
Lower limb power (standing long jump)
Lower limb muscle power was assessed with a standing long jump test. For each trial of the standing long jump, children were instructed to initially stand on a standardized starting point and to bend their knees (with depth of flexion self-selected) and bring their arms behind their body. Then, with a powerful drive, they extended their legs, while swinging their arms forward, jumped as far as possible and landed with both feet. The distance from the starting point to the landing point at heel contact was used for statistical analysis. The best value of two jumps separated by 10 s of rest was recorded for further analysis. All trials were measured to the nearest 0.01 m. ICC was 0.93.
Agility T-test
T-test measured children’s ability to accelerate and decelerate forward and backward and accurately change direction laterally. Four cones were placed at the beginning, after 9.1 m (10 yards) distance and after 4.6 m (5 yards) to the right and to the left, respectively, at a 90° angle. Children were instructed to accelerate forward as quickly as possible along the 9.1 m distance, shuffle sideways (total distance of 18.3 m) and then run backwards (9.1 m) to the starting cone, covering a total T-shaped distance of 36.5 m (40 yards). A manual stopwatch was used to determine participants’ times. Two attempts were given interspersed by 3 min of rest and the best time was used for further analysis. ICC was 0.94.
Sit-and-reach test
The sit and reach test was used to assess hamstring muscles and lower back flexibility. Children took a seated position with legs stretched out and feet were placed flat against a standardized sit-and-reach box and reached forward with both hands as far as possible, not allowing knees to flex. No ballistic movements were allowed and both hands were parallel along the measuring line on the sit-and-reach box (foot-line at 22 cm). The measuring position was maintained for at least 2 s. ICC was 0.91.
Statistical analysis
All data were analyzed using the Statistical Package for the Social Sciences for Windows v19 (IBM; http://www.spss.com). Data are presented as means and standard deviations (SD) and were analyzed for normality with the Kolmogorov–Smirnov test. Logarithmic transformation was adapted in order to meet the normality assumptions for sit-and-reach and agility testing. ANOVA was used to evaluate differences between gender and age categories (5–6, 7–8, 9–10 and 11–12 years), for anthropometric (height, body mass, BMI) and physical fitness parameters. Similarly, ANOVA was used to evaluate differences between genders and BMI categories (underweight, normal, overweight and obese) for all the selected physical fitness measures respectively. ANOVA 2×2 was used to examine possible gender differences between underweight–normal (S1 group) and overweight–obese groups (S2 group). Significant main effects were assessed by Bonferroni post-hoc tests (p=0.0033) to examine the within-groups differences. Pearson r was used to determine correlations between BMI and physical fitness measures. Main effects and interactions were estimated by calculating partial eta squared (η2) values. According to Richardson22, η2 is classified as small (0.01–0.059), moderate (0.06–0.137) and large (≥0.138). Test–retest reliability for all the dependent variables was determined by calculating the ICC23 using a two-way mixed model. For each analysis statistical significance was set at p=0.05.
Ethics approval
Local authorities were informed for the purpose of the study 3 months in advance. This study was approved by the Review Board of First Orthopaedic Clinic, Medical School, National and Kapodistrian University of Athens, and all procedures were in accordance with the Helsinki Declaration of 1975, as revised in 1996.
Results
Anthropometric characteristics
A significant main effect of age was obtained after ANOVA analysis for height (F=117.78, p=0.000, n2=0.533), body mass (F=93.96, p=0.000, n2=0.385) and BMI (F=19.96, p=0.000, n2=0.117). Post-hoc differences for boys and girls were observed across age groups for height from 7 to 12 years, weight from 9 to 12 years, while BMI showed differences between 9 to 12 years only for the boys (p=0.05; Table 1).
The prevalences of underweight, normal weight, overweight and obese boys were 27.4%, 24.6%, 24.2% and 23.8%, respectively, and for girls 30%, 34.7%, 25.1% and 13.2%, respectively. The prevalence of overweight and obese children increased progressively with age in both genders with no differences between them (F=251.16, p=0.000, n2=0.623; Table 1).
Table 1: Participant anthropometric characteristics (mean, SD, 95%CI)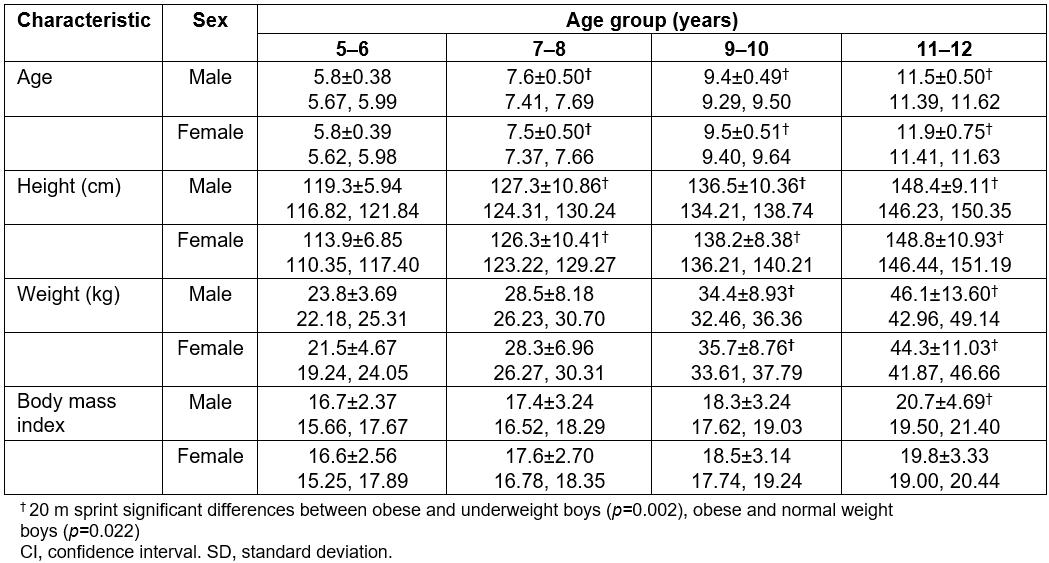
Physical fitness measures in relation to BMI categories
ANOVA revealed significant BMI group main effect for sprint speed (F=6.21, p=0.000, n2=0.041) and standing long jump (F=11.369, p=0.000, n2=0.074), indicating lower performances with increasing BMI values. Moreover, a significant gender main effect was found for sprint speed (F=5.867, p=0.016, n2=0.013) and long jump (F=9.849, P=0.0024, n2=0.022), indicating that boys outperformed girls in both tests. On the other hand, girls outperformed boys in the sit-and-reach test (F=15.372, p=0.000, n2=0.034). However, due to the Bonferroni correction (p=0.0033), no post-hoc differences were obtained. All physical fitness measures between BMI groups are presented in Table 2.
Table 2: Physical fitness performance in different body mass index groups (mean, SD, 95%CI)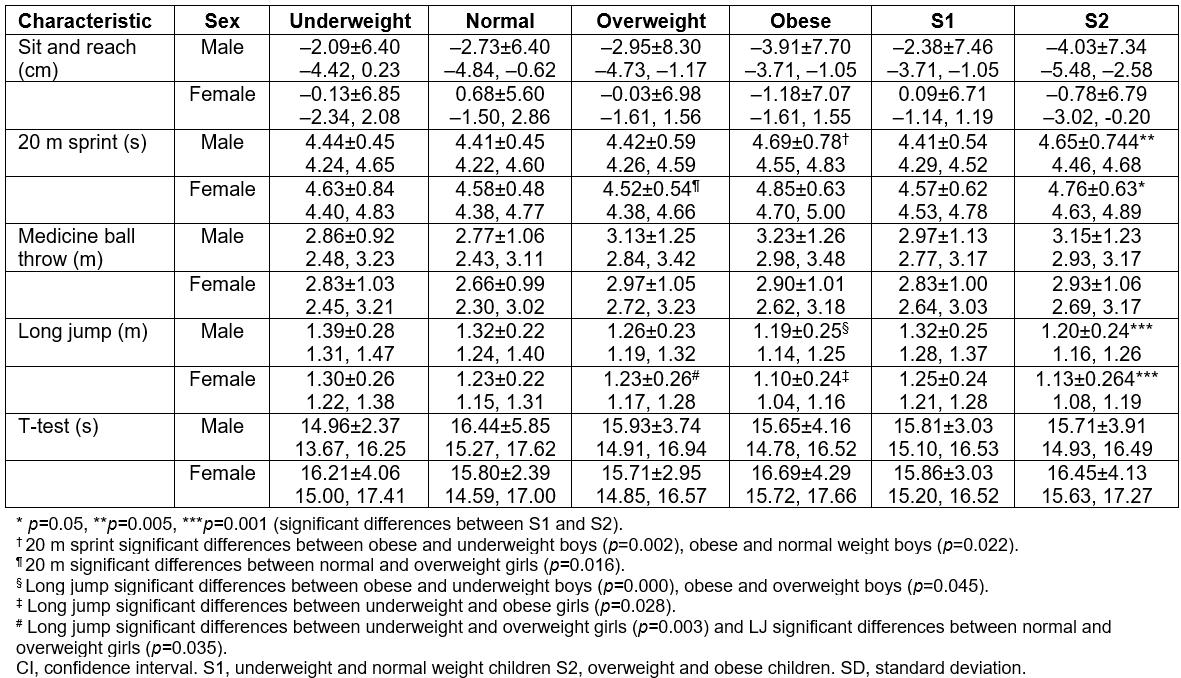
Physical fitness measures in relation to underweight and normal group (S1) versus overweight and obese group (S2)
ANOVA (2×2) revealed significant main effect for speed (F=12.869, p=0.000, n2=0.029) and long jump (F=22.060, p=0.000, n2=0.048, respectively), further highlighting a performance decrement with increasing BMI values. Moreover, a significant gender main effect was found for sprint speed (F=4.797, p=0.029, n2=0.011) and standing long jump (F=8.706, p=0.003, n2=0.02). Post-hoc comparisons are presented in Table 3. Significant differences were observed between underweight–normal and overweight–obese boys (5%, p=0.05) and girls (4%, p=0.005) for speed, respectively. Similar results were observed between underweight–normal and overweight–obese boys and girls for long jump (10 and 11%, p=0.001, respectively), indicating a significant BMI effect on jumping performance (Table 3).
Table 3: Prevalence of underweight, normal, overweight and obese children (mean, SD, 95%CI, n(%))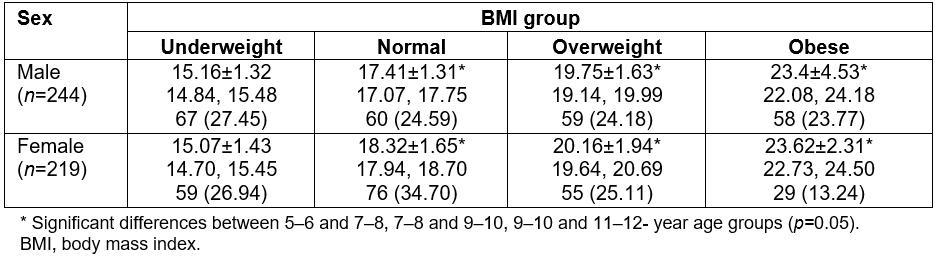
Correlations, percentiles and age differences in physical fitness values
Pearson r indicated that BMI is positively correlated with medicine ball throw and 20 m sprint time, and negatively associated with long jump and sit-and-reach values. All physical fitness correlations are presented in Table 4. Physical fitness percentiles, with respect to age, for boys and girls, are presented in Table 5 and Table 6, respectively.
Table 4: Pearson correlations (p-values) between body mass index and physical performance measures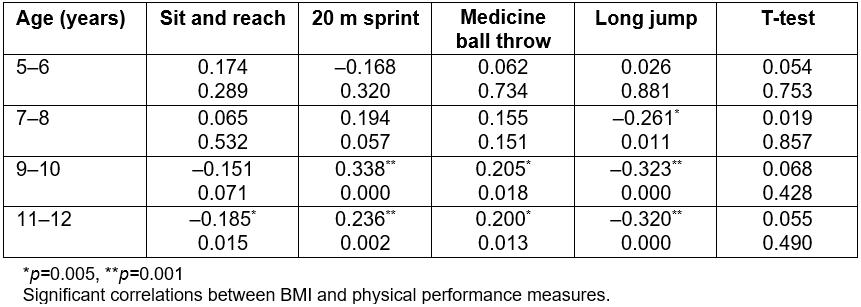
Table 5: Physical performance percentiles for boys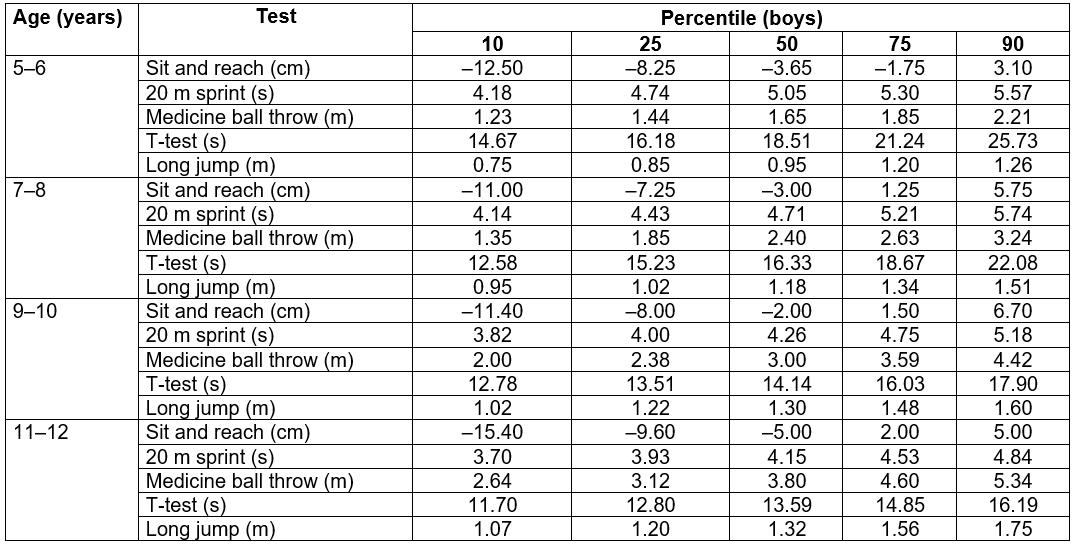
Table 6: Physical performance percentiles for girls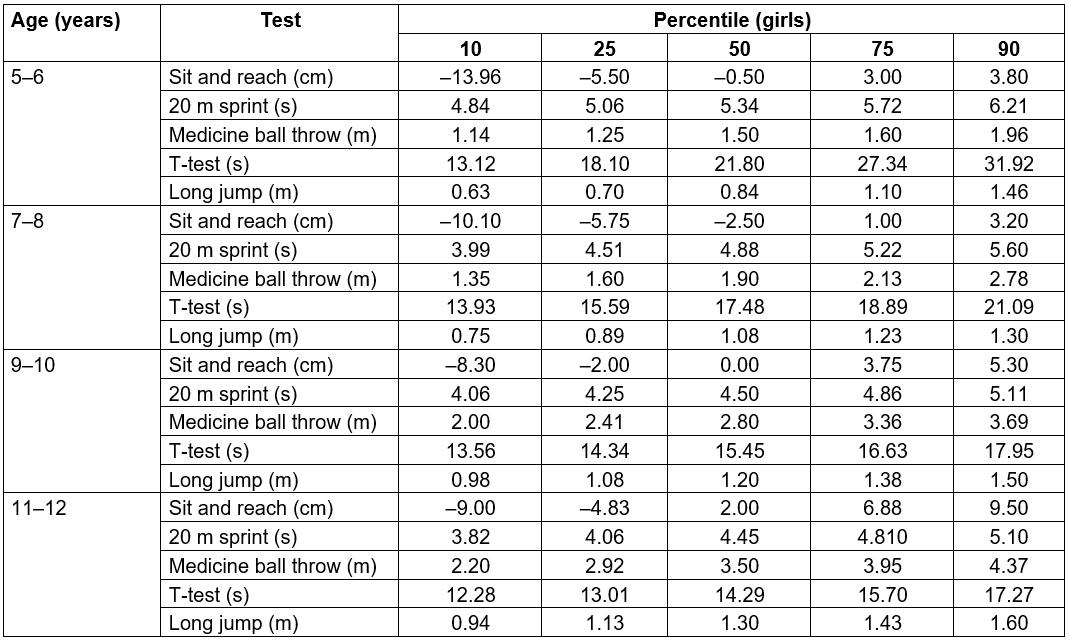
Discussion
This study examined the prevalence of obesity in young school-aged children (5–12 years) living in 18 remote and isolated Greek islands and at the same time evaluated the association of obesity (as defined using BMI cut-off points) with physical fitness indices. Although the association between physical activity and BMI in childhood is widely reported24, to the best of the authors’ knowledge this is the first study that accounts for specific geographical factors influencing poverty and social exclusion in rural areas and provides information concerning obesity and physical fitness measures for children in remote and isolated islands.
Childhood obesity has been extensively studied in Greek urban areas25-28, demonstrating increments by 50% over the last few years29. This increase in childhood obesity is related to unstable socioeconomic factors30, irregular nutritional habits31, increased sedentary time, insufficient physical activity and inadequate fitness levels32. Furthermore, the alarming magnitude of paediatric obesity is established in rural areas as well19,32,33, which sometimes is evident despite the high levels of physical activity19. In these studies, the prevalence of obesity is similar to that reported in other Mediterranean countries34. In the present study, the prevalences of obesity are 23.8% and 13.2% for boys and girls, respectively and are higher compared to the aforementioned findings. It can be speculated that limited parental nutritional education and lack of knowledge of healthy eating give rise to the elevated risk of obesity in children living in isolated, rural areas. Alternatively, the isolated rural life may not necessarily involve a physically demanding lifestyle, but be related to an excessive exposure to television and screen time in general. These two factors collectively may contribute to the increased prevalence of obesity34.
Despite the rising of childhood obesity, evidence is limited on the association between physical fitness and BMI values in children living in remote and isolated rural areas3,19. Physical fitness has been widely reported to be inversely related to obesity25,35 and BMI is negatively associated to children’s performance in several fitness measures36. Over the last few decades, children are less physically active than recommended and this increased sedentary behavior is considered as a significant determinant of increased body mass37. In the present study, it was found that overweight and obese children demonstrated lower performance scores compared to normal and underweight children, in almost all of the fitness tests, except for the medicine ball throw. Obese children may avoid vigorous physical activities due to the fear of reduced performance, thus further exacerbating their fitness levels. Furthermore, in isolated and remote areas there is a lack of after-school leisure activities to motivate children towards a healthy and active lifestyle34.
In the medicine ball throw, children aged 9–12 years tended to reach the highest values (as indicated by the positive correlation indices). These findings are in accordance with other investigations38-40. A possible explanation may be that, in absolute terms, a child with a higher body mass may haave a greater muscle mass content and therefore produce a significantly higher amount of force than a child with a lower body mass. The aforementioned findings were even more pronounced when considering the underweight and normal weight (group S1) in comparison to the overweight and obese children (group S2; Table 2).
Significant differences were also evident for 20 m sprint time and standing long jump distance between S1 and S2 groups for boys and girls. Underweight children had similar performance compared to normal weight children, whereas they demonstrated the best performances (although not significant) in long jump and the agility T-test, thus confirming results also reported by others40. The gender differences observed in the present study might be caused by sex-related growth factors in body composition, linear development and hormones, respectively41.
Furthermore, when taken as a group, boys outperformed girls in the sprint and standing long jump tests, which can be explained by the fact that boys tend to be more physically active than girls, participating more often in moderate-to-vigorous-intensity exercise, in larger groups and in more open settings42,43. In contrast, girls and especially those living in rural areas are participating in less vigorous physical activities, with minimal body contact, and they engage in activities that put more emphasis on neuromuscular coordination3,44.
As far as flexibility is concerned, there was a tendency for girls to be more flexible compared to boys at all age groups. These findings did not reach statistical significance due to the high intragroup variability observed for this parameter in both genders. Previous studies support the present findings and can be explained by gender differences demonstrating a greater percentage of body fat and a lower percentage of muscle mass due to the higher circulating levels of oestrogens or lower circulating levels of androgens in girls compared to boys. In this case, tissue density is lower in girls and this may lead to enhanced flexibility45. Furthermore, there is a social tendency for girls to select gymnastics or dancing drills, which activate the elastic elements of the musculoskeletal system.
Body height significantly increased after the age of 7 years and continued progressively to increase across childhood for both boys and girls, reaching the highest values at the age of 12 years. Βody mass significantly increased at a later stage (at the ages of 8 and 10 years) in comparison to height, a fact that can be attributed to the distinct growth and maturation processes46 (Table 1). No between-gender differences were found in anthropometric characteristics. However, a trend was observed for girls between 9 and 10 years old to be taller than boys, a common observation at this age, while at the same time girls grew faster in height in comparison to boys (7.8 vs 10.9%), confirming the diverse growth patterns between sexes45. According to Malina, Bouchard and Bar-Or45, body height in girls typically increases between 9 and 12 years. In the present study, this growth pattern was observed earlier, between 6 and 9 years, and highlights the importance of estimating biological age while reporting performance measures. After the age of 9 years, a similar rate of increase in body height was observed over time47. Moreover, similar BMI values were found in both genders at all time points between the ages of 5 and 10 years, thus confirming previous findings48,49.
Physical fitness increments, attributed to different rates of growth and maturation processes, are demonstrated in the percentile tables, for both boys and girls, observations that have also been reported in other investigations19,50,51. However, between-studies comparisons should be evaluated with caution, due to the fact that different assessment protocols and age group categorizations have been used in the past to evaluate fitness status. In general, children performing above the 80th percentile can be classified as ‘fit’, whereas children with values below the 20th percentile should be directed towards fitness-promoting programs to improve physical performance8.
Study strengths and limitations
This study examined obesity and its association with fitness indices of a relatively large number of young school-aged children, in remote and isolated Greek islands. In addition, fitness measures were obtained and presented through the use of standardized field measurements, conducted by trained professionals according to standard procedures. The relatively large number of participants, and the reliability of the procedures used, may allow for generalization and extrapolation of the findings to other Mediterranean remote and isolate rural areas, and raise concerns on health and physical fitness issues of residents and, in particular children, in these areas. Οne limitation of the present study is the use of BMI as an identification tool of obesity prevalence, as it is known that BMI does not take into account lean body mass. However, BMI cut-off points, based on WHO directives, are considered a robust measure, widely used in population-based studies due to their simplicity, which facilitates the assessment of temporal trends and allows for comparisons with other studies on a population level24.
Implications
Having addressed the prevalence of childhood obesity in remote and isolated islands, a secondary aim was to describe sex- and age-specific physical fitness characteristics. By considering the percentile table, a database evaluation system can be designed that can be helpful to specialists into monitoring the health and fitness status of children and design individualized and enjoyable physical education programs according to maturity level. Furthermore, by identifying high-risk cases, educational and motivational programs can be implemented for local families in order to improve physical activity levels and/or nutritional habits. In the long term it becomes possible to affect the lifestyle of a society, reducing future cardiometabolic disorders and diseases. In general, data from the present study may provide useful information that can help fine-tune government programs that target isolated and remote areas regarding exercise and health.
Conclusion
The information concerning the relationship between ΒΜΙ and physical fitness is rather limited in isolated rural areas. By taking into consideration the relationship between BMI and physical fitness measures, the results of the present study emphasize the importance of integrated physical fitness programs for children living in isolated rural areas. The early monitoring of obesity through preventive strategies may lead to improvements of physical fitness and health related outcomes in children living in remote and isolated areas.